. 2024 May 8;44(19):e1762232024.
doi: 10.1523/JNEUROSCI.1762-23.2024.

TRPM2 and CaMKII Signaling Drives Excessive GABAergic Synaptic Inhibition Following Ischemia

Affiliations

TRPM2 and CaMKII Signaling Drives Excessive GABAergic Synaptic Inhibition Following Ischemia

Amelia M Burch et al. J Neurosci. .

Abstract

Excitotoxicity and the concurrent loss of inhibition are well-defined mechanisms driving acute elevation in excitatory/inhibitory (E/I) balance and neuronal cell death following an ischemic insult to the brain. Despite the high prevalence of long-term disability in survivors of global cerebral ischemia (GCI) as a consequence of cardiac arrest, it remains unclear whether E/I imbalance persists beyond the acute phase and negatively affects functional recovery. We previously demonstrated sustained impairment of long-term potentiation (LTP) in hippocampal CA1 neurons correlating with deficits in learning and memory tasks in a murine model of cardiac arrest/cardiopulmonary resuscitation (CA/CPR). Here, we use CA/CPR and an in vitro ischemia model to elucidate mechanisms by which E/I imbalance contributes to ongoing hippocampal dysfunction in male mice. We reveal increased postsynaptic GABAA receptor (GABAAR) clustering and function in the CA1 region of the hippocampus that reduces the E/I ratio. Importantly, reduced GABAAR clustering observed in the first 24 h rebounds to an elevation of GABAergic clustering by 3 d postischemia. This increase in GABAergic inhibition required activation of the Ca2+-permeable ion channel transient receptor potential melastatin-2 (TRPM2), previously implicated in persistent LTP and memory deficits following CA/CPR. Furthermore, we find Ca2+-signaling, likely downstream of TRPM2 activation, upregulates Ca2+/calmodulin-dependent protein kinase II (CaMKII) activity, thereby driving the elevation of postsynaptic inhibitory function. Thus, we propose a novel mechanism by which inhibitory synaptic strength is upregulated in the context of ischemia and identify TRPM2 and CaMKII as potential pharmacological targets to restore perturbed synaptic plasticity and ameliorate cognitive function.

Keywords: E/I balance; GABAA receptors; TRPM2; cardiac arrest; global cerebral ischemia; inhibitory synapse.


Conflict of interest statement

The authors declare no competing financial interests.

Figures

Figure 1.
Figure 1.
Excitatory/inhibitory balance is disrupted following CA/CPR. A, Shown are representative traces for evoked EPSCs (solid) and IPSCs (dotted) recorded from the same CA1 hippocampal neurons of CA/CPR (blue) and sham (gray/black) mice. The AMPA eEPSCs are recorded with the neuron held at −70 mV, and GABA eIPSCs are recorded at 0 mV. B, Quantification of the absolute value of the ratio of GABA eIPSC amplitude to the AMPA eEPSC amplitudes; n = 11–15 cells/3–5 animals per condition; unpaired t test. C, Representative fEPSP traces from the stratum radiatum region of the CA1 hippocampus in CA/CPR slices without treatment (black) and CA/CPR slices (blue) treated with 5 µM picrotoxin during baseline. D, LTP data presented as a percentage of the baseline, where the baseline is set at 100%. E, Normalized slope of fEPSPs after theta burst stimulus; n = 4–6 slices/4–5 animals per condition; one-way ANOVA, Tukey's post hoc test. Values represent mean ± SEM. *p < 0.05, **p < 0.01.
Figure 2.
Figure 2.
GABA sIPSC amplitude is increased following CA/CPR. TRPM2 ion channel inhibition rapidly restores sIPSC amplitude and E/I balance post-CA/CPR. A, Representative traces from sham (top, left), sham with 2 µM tatM2NX bath applied (bottom, left), CA/CPR (top, right), CA/CPR with bath applied tatM2NX (bottom right) of whole-cell voltage-clamp recordings of sIPSC events recorded from CA1 pyramidal neurons in acute hippocampal slices using CsCl based internal solution holding at −60 mV. B, Cumulative frequency distribution of sIPSC amplitude from sham cells (black, solid), sham + tatM2NX (black, dotted), CA/CPR (pink, solid), CA/CPR + tatM2NX (pink, dotted). C, Mean amplitude (1), frequency (2), and tau decay (3) kinetics were measured from sIPSC events in different cells from sham and CA/CPR operated mice with and without bath application of tatM2NX; n = 18–24 cells/8–10 animals per condition; one-way ANOVA, Tukey's post hoc test. D, Representative traces from sham (top, left), sham after clotrimazole (CTZ) from the same cell (bottom, left), CA/CPR (top, right), CA/CPR after CTZ from the same cell (bottom, right). E, Cumulative frequency distribution of sIPSC amplitude from CA/CPR (black, dotted) following treatment with CTZ (20 mM) in the same cell (green, dotted). F, Mean amplitude (1), frequency (2), and tau decay (3) kinetics were measured from sIPSC events in the same cell before and after bath application of CTZ from sham and CA/CPR operated mice; n = 21–22 cells/9–11 animals per condition; two-way ANOVA with repeated measures, Sidak's post hoc test. G, Shown are representative traces for evoked EPSCs (solid) and IPSCs (dotted) recorded from the same CA1 hippocampal neurons of CA/CPR (blue) and CA/CPR with CTZ treatment (gray) mice. The AMPA eEPSCs are recorded with the neuron held at −70 mV, and GABA eIPSCs are recorded at 0 mV. H, Quantification of the absolute value of the ratio of GABA eIPSC amplitude to the AMPA eEPSC amplitudes; n = 11–15 cells/3–5 animals per condition; unpaired t test. Sham and CA/CPR data from Figure 1B was used to compare the CA/CPR + CTZ group. Values represent mean ± SEM. *p < 0.05, **p < 0.01, ***p < 0.001, ****p < 0.0001.
Figure 3.
Figure 3.
CA/CPR induces a persistent increase in gephyrin clustering and density. A, B, Shown are representative images of the CA1 region of the hippocampus from (A) sham-operated and (B) CA/CPR mice. Gephyrin staining is shown in green and VGAT is shown in magenta. C, Quantification of the cluster area and density of both gephyrin and VGAT in the stratum radiatum; n = 6 animals per group; unpaired t test. D, Quantification of the cluster area and density of both gephyrin and VGAT in the stratum pyramidale; n = 6 animals per group; unpaired t test. Values represent mean ± SEM. *p < 0.05; **p < 0.01.
Figure 4.
Figure 4.
Protein and mRNA expression of postsynaptic GABAergic components are unaltered 7 d following CA/CPR. A, Western immunoblot measuring total levels of gephyrin normalized to vinculin loading control in the P2 fraction from whole hippocampi. B, Quantification of gephyrin levels normalized to mean sham; n = 4 animals per condition; unpaired t test. C–E, Levels of mRNA transcript in CA1 hippocampal isolates as measured by quantitative qPCR for genes encoding the GABAAR-γ2 (C), GABAAR-b3 (D), GABAAR-a1 (E) subunits; n = 8 animals per condition; unpaired t test. Values represent mean ± SEM.
Figure 5.
Figure 5.
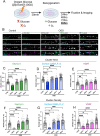
OGD induces a persistent increase in the clustering and density of postsynaptic GABAergic proteins. A, Cartoon illustrating timeline for in vitro OGD experiments. Dissociated hippocampal neurons were reoxygenated following 20 min OGD exposure. Neurons were fixed 24, 48, 72, and 96 h following reoxygenation. B, Representative confocal images of dendritic segments from pyramidal neurons stained for gephyrin (green), GABAAR-γ2 subunit (cyan), and VGAT (magenta). C–E, Quantification of cluster area for (C) gephyrin, (D) surface GABAAR-γ2, and (E) VGAT; n = 30–36 neurons per condition; one-way ANOVA, Dunnett's post hoc. F–H, Quantification of cluster density for (F) gephyrin, (G) surface GABAAR-γ2, and (H) VGAT; n = 30–36 neurons per condition; one-way ANOVA, Dunnett's post hoc. Values represent mean ± SEM. *p < 0.05; **p < 0.01, ***p < 0.001, ****p < 0.0001.
Figure 6.
Figure 6.
Validation of immunostaining in oxygen–glucose deprivation experiments. A, Representative low magnification image of CA1 pyramidal neuron (left) and high magnification images of dendritic segments (right) following gephyrin (green), GABAAR-γ2 subunit (cyan), and VGAT (magenta) staining under nonpermeabilizing conditions 96 h following OGD. B, Representative low magnification image of CA1 pyramidal neuron (left) and high magnification images of dendritic segments (right) following gephyrin (green), GABAAR-γ2 subunit (cyan), and VGAT (magenta) staining under permeabilizing conditions 96 h following OGD. C, Low magnification representative images of CA1 pyramidal neurons immunostained for MAP2 (blue), GABAAR-γ2 subunit (cyan), and VGAT (magenta) following control (top) and 96 h-OGD (bottom) treatment. D, Subset analysis of cluster area (left) and cluster density (right) GABAAR-γ2 subunit are increased 96 h following OGD using MAP2 as a guide for ROI analysis; n = 9–12 neurons per condition, unpaired t test. Values represent mean ± SEM. *p < 0.05; ***p < 0.001.
Figure 7.
Figure 7.
The TRPM2 ion channel mediates the OGD-induced increase in the clustering of postsynaptic GABAergic proteins. A, Cartoon illustrating experimental timeline for neurons subjected to OGD reoxygenation and treated with tatM2NX (2 mM) or CTZ (20 mM) 1 h prior to fixation. B, Representative confocal images of dendritic segments from pyramidal neurons immunostained for gephyrin (green), GABAAR-γ2 subunit (cyan), and VGAT (magenta). C–E, Quantification of cluster area (left) and cluster density (right) following treatment with tatM2NX for (C) gephyrin, (D) surface GABAAR-γ2, and (E) VGAT; n = 30–36 neurons per condition; one-way ANOVA, Tukey's post hoc. F–H, Quantification of cluster area (left) and cluster density (right) following treatment with CTZ for (F) gephyrin, (G) surface GABAAR-γ2, and (H) VGAT, n = 30–36 neurons per condition; one-way ANOVA, Tukey's post hoc. Values represent mean ± SEM. *p < 0.05; **p < 0.01, ***p < 0.001, ****p < 0.0001.
Figure 8.
Figure 8.
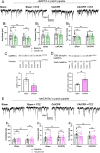
Ca2+ signaling and CaMKII activity contribute to CA/CPR-induced increase in the amplitude of GABA sIPSCs. A, Representative traces from sham (far left), sham after CTZ from the same cell (center left), CA/CPR (center right), and CA/CPR after CTZ from the same cell (far right). BAPTA (10 mM) was included in the patch pipette across all conditions. B, Mean amplitude (1), frequency (2), and tau decay (3) kinetics were measured from sIPSC events in the same cell before and after bath application of CTZ from sham and CA/CPR operated mice with 10 mM BAPTA included in patch pipette; n = 10 cells/4–7 animals per condition; two-way ANOVA with repeated measures, Sidak's post hoc test. C, Western immunoblot measuring total levels of CaMKII normalized to vinculin loading control in the membrane fraction of whole hippocampi from sham and CA/CPR operated mice; n = 5 animals per condition; unpaired t test. D, Western immunoblot measuring levels of T286 phosphorylation of CaMKII normalized to total CaMKII in the membrane fraction of whole hippocampi from sham and CA/CPR operated mice; n = 4 animals per condition; unpaired t test. E, Representative traces from sham (far left), sham after CTZ from the same cell (center left), CA/CPR (center right), and CA/CPR after CTZ from the same cell (far right). TatCN19o (5 mM) was included in the patch pipette across all conditions. F, Mean amplitude (1), frequency (2), and tau decay (3) kinetics were measured from sIPSC events in the same cell before and after bath application of CTZ from sham and CA/CPR operated mice with 5 mM tatCN19o included in patch pipette; n = 9 cells/45 animals per condition; two-way ANOVA with repeated measures, Sidak's post hoc test. Values represent mean ± SEM. *p < 0.05.
Figure 9.
Figure 9.
Ca2+-dependent CaMKII activity contributes to the increased clustering of postsynaptic GABAergic proteins via a TRPM2-dependent pathway. A, Cartoon illustrating experimental timeline for neurons subjected to OGD reoxygenation and treated with tatCN19o (5 mM), KN93 (5 mM), or combined treatment with tatM2NX (2 mM) 1 h prior to fixation. B, Representative confocal images of dendritic segments from pyramidal neurons stained for gephyrin (green), GABAAR-γ2 subunit (cyan), and VGAT (magenta). C–E, Quantification of cluster area (left) and density (right) following treatment with tatCN19o or tatCN19o + tatM2NX for (C) gephyrin, (D) surface GABAAR-γ2, and (E) VGAT; n = 30–36 neurons per condition; one-way ANOVA, Tukey's post hoc. F–H, Quantification of cluster area (left) and density (right) following treatment with KN93 or KN93 + tatM2NX for (E) gephyrin, (F) surface GABAAR-γ2, and (G) VGAT; n = 30–36 neurons per condition; one-way ANOVA, Tukey's post hoc. Values represent mean ± SEM. *p < 0.05; **p < 0.01; ***p < 0.001; ****p < 0.0001.

References

    1. Alicke B, Schwartz-Bloom RD (1995) Rapid down-regulation of GABAA receptors in the gerbil hippocampus following transient cerebral ischemia. J Neurochem 65:2808–2811. 10.1046/j.1471-4159.1995.65062808.x - DOI - PubMed
    1. Arancibia-Carcamo IL, Yuen EY, Muir J, Lumb MJ, Michels G, Saliba RS, Smart TG, Yan Z, Kittler JT, Moss SJ (2009) Ubiquitin-dependent lysosomal targeting of GABA(A) receptors regulates neuronal inhibition. Proc Natl Acad Sci U S A 106:17552–17557. 10.1073/pnas.0905502106 - DOI - PMC - PubMed
    1. Azad TD, Veeravagu A, Steinberg GK (2016) Neurorestoration after stroke. Neurosurg Focus 40:E2. 10.3171/2016.2.FOCUS15637 - DOI - PMC - PubMed
    1. Banks MI, Li TB, Pearce RA (1998) The synaptic basis of GABAA, slow. J Neurosci 18:1305–1317. 10.1523/JNEUROSCI.18-04-01305.1998 - DOI - PMC - PubMed
    1. Barcomb K, Goodell DJ, Arnold DB, Bayer KU (2015) Live imaging of endogenous Ca(2)(+)/calmodulin-dependent protein kinase II in neurons reveals that ischemia-related aggregation does not require kinase activity. J Neurochem 135:666–673. 10.1111/jnc.13263 - DOI - PMC - PubMed

Publication types

Substances

LinkOut - more resources