. 2024 Apr 2;15(1):2838.
doi: 10.1038/s41467-024-47304-6.

Early detection of emerging viral variants through analysis of community structure of coordinated substitution networks

Affiliations

Early detection of emerging viral variants through analysis of community structure of coordinated substitution networks

Fatemeh Mohebbi et al. Nat Commun. .

Abstract

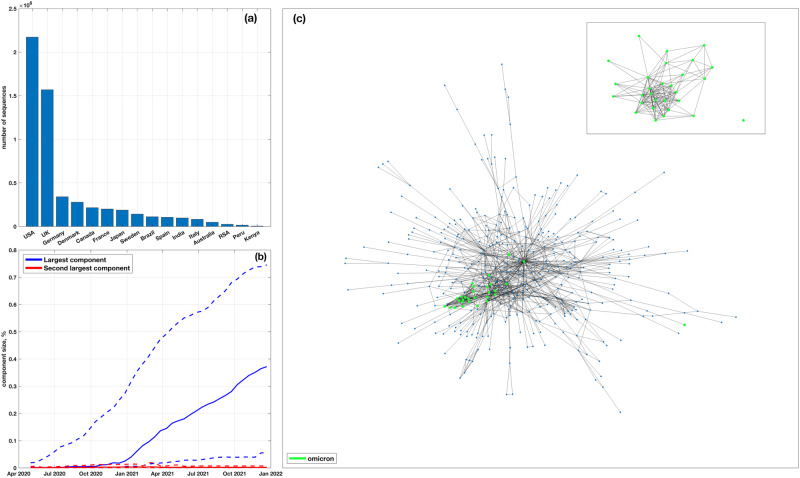
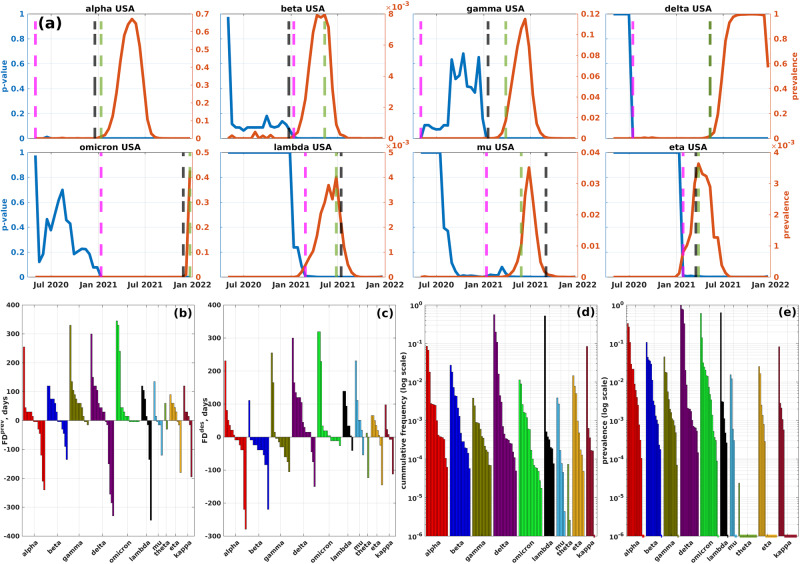
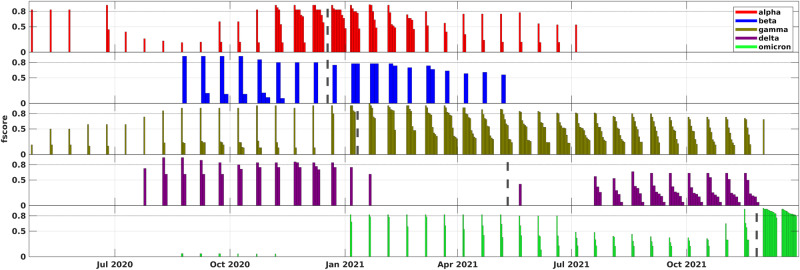
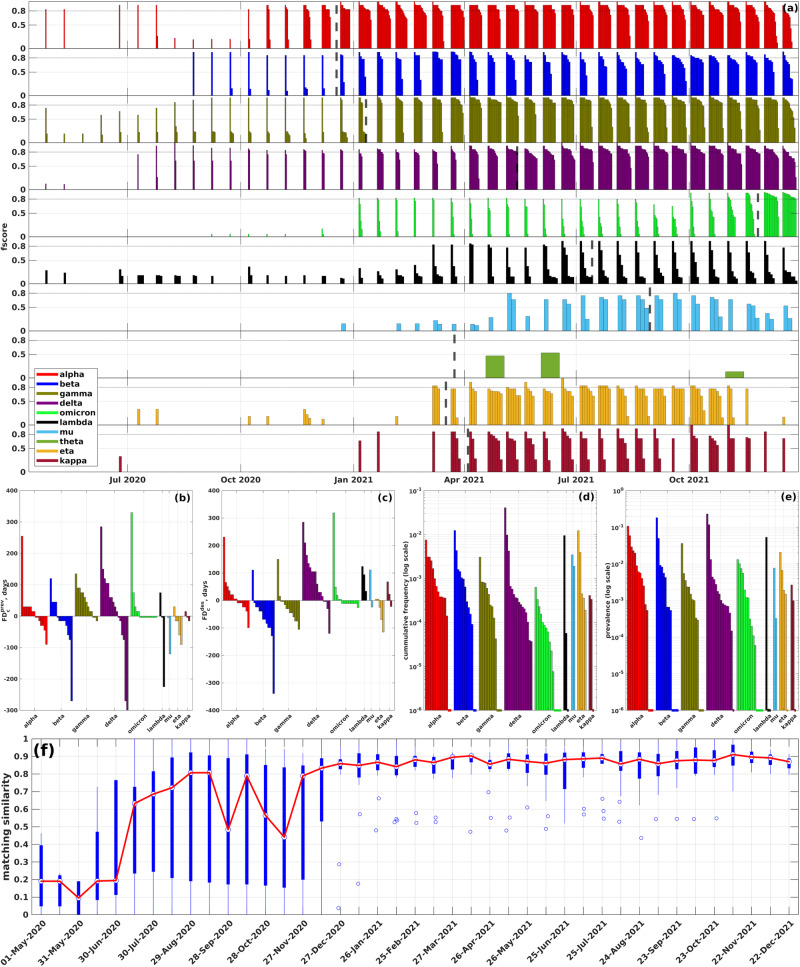
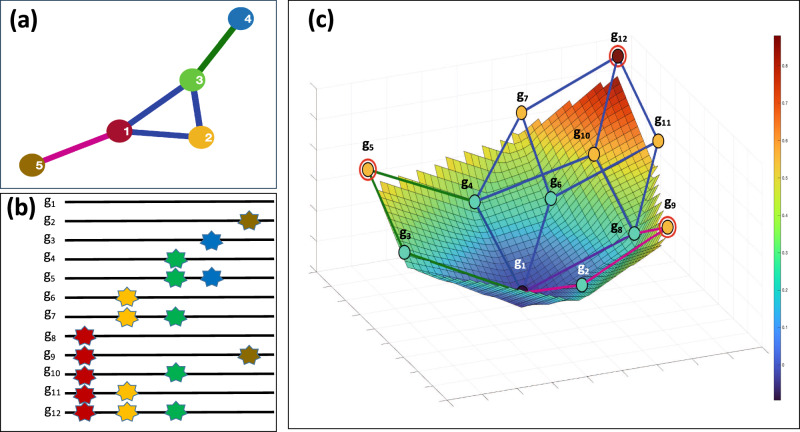
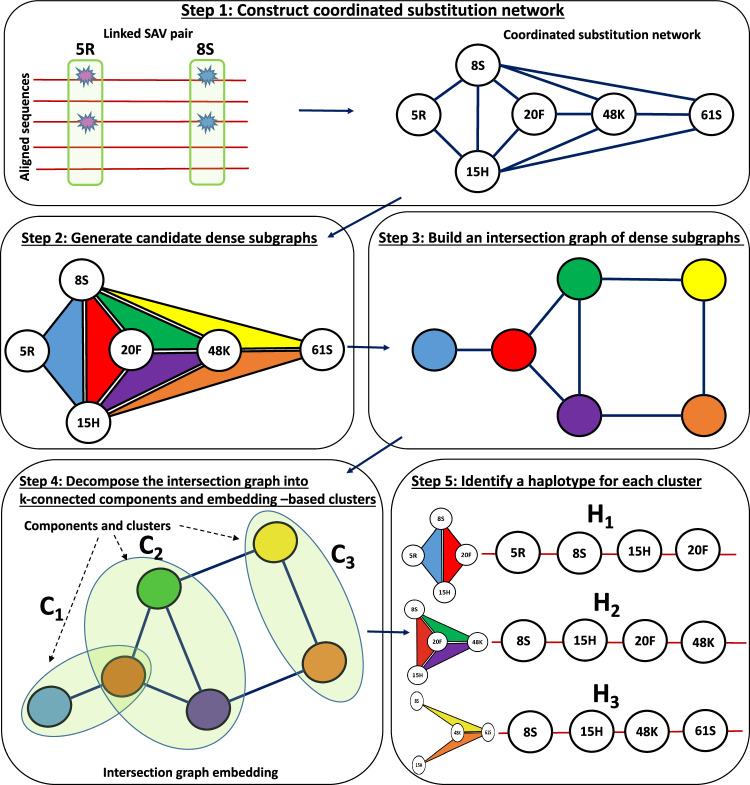
The emergence of viral variants with altered phenotypes is a public health challenge underscoring the need for advanced evolutionary forecasting methods. Given extensive epistatic interactions within viral genomes and known viral evolutionary history, efficient genomic surveillance necessitates early detection of emerging viral haplotypes rather than commonly targeted single mutations. Haplotype inference, however, is a significantly more challenging problem precluding the use of traditional approaches. Here, using SARS-CoV-2 evolutionary dynamics as a case study, we show that emerging haplotypes with altered transmissibility can be linked to dense communities in coordinated substitution networks, which become discernible significantly earlier than the haplotypes become prevalent. From these insights, we develop a computational framework for inference of viral variants and validate it by successful early detection of known SARS-CoV-2 strains. Our methodology offers greater scalability than phylogenetic lineage tracing and can be applied to any rapidly evolving pathogen with adequate genomic surveillance data.


Conflict of interest statement

The authors declare no competing interests.

Figures

Fig. 1
Fig. 1. Data and coordinated substitution networks.
a Numbers of analyzed spike amino acid sequences per country. b Relative sizes of the largest and second largest connected components of coordinated substitution networks over time. Solid and dashed lines depict median and maximum/minimum values over 16 countries at each time point, respectively. c An example of a giant component of a coordinated substitution network obtained using the complete dataset for the USA on January 11, 2021. The vertices highlighted in green correspond to SAVs of the Omicron variant (lineage B.1.1.529.1). Most of these SAVs form a dense community, visualizing the key idea of the study.
Fig. 2
Fig. 2. Density-based Benjamini–Hochberg-adjusted P values of VOCs/VOIs (first truncated dataset).
a P values (blue) and prevalences (red) of 8 VOCs and VOIs in the USA coordinated substitution networks (refer to Supplementary Figs. 2–31 for all VOCs/VOIs across all countries). Black, green, and magenta lines represent the times of VOC designation, achieving 1% prevalence, and becoming significantly dense, respectively. b, c Forecasting depths (y axis) in relation to the 1% prevalence time and WHO designation time for each analyzed VOC/VOI across different countries. d, e Cumulative frequencies and prevalences for VOCs/VOIs across various countries at the times when they become significantly dense (in a logarithmic scale). Dashed lines at the bottom of the plot indicate that the variants reached significant density at frequencies/prevalences of 0. For similar summaries for the complete and second truncated datasets, see Supplementary Figs. 32 and 33.
Fig. 3
Fig. 3. Comparison of densest subnetworks from coordinated substitution networks (aggregated over 16 countries) with VOCs, first truncated dataset.
Similar visuals for other datasets and individual countries can be found in Supplementary Figs. 34–36. Each bar in the plot represents a specific VOC. For every time point, the bars display the densest subgraphs of different countries that are most similar to that VOC, with the height of the bars indicating the corresponding f-scores. Dashed lines highlight the moments when the WHO designated the VOCs.
Fig. 4
Fig. 4. Analysis of inferred haplotypes.
a Summary of comparison between VOCs/VOIs and inferred haplotypes (first truncated dataset, the results for other datasets are depicted on Supplementary Figs. 44 and 45). Each bar plot depicts the comparison results for a particular VOC/VOI; at each time point, bars correspond to inferred haplotypes from different countries closest to that VOC, and the bar heights are equal to the respective f-scores. Colored dashed lines mark times when the VOCs were designated by WHO. b, c Forecasting depths (y axis) with respect to the 1% prevalence time and WHO designation time for each analyzed VOCs/VOIs over different countries. d, e Cumulative frequencies and prevalences of VOCs/VOIs over different countries at first variant call times (in logarithmic scale). Dashed lines at the bottom of the plot signify that the corresponding variants were detected at cumulative frequencies or prevalences 0. f Precision of haplotype inference. Blue box plot depicts summary statistics of matching similarity of n = 16 countries over T = 21 time points. The bottom and top of each box are the 25th and 75th percentiles, whiskers represent minimum and maximum values, white dot is a median. Red plot depicts the dynamics of median matching similarity over time.
Fig. 5
Fig. 5. The model of an epistatically-constrained sequence space and fitness landscape.
a The epistatic network G. Edges of inclusion-maximal cliques are displayed in blue, green and purple. b Genotypes that are viable under the constraints imposed by the epistatic networks. Stars represent 1-alleles, colors denote loci. c The viable space is depicted alongside the corresponding fitness landscape. For better visualization, as is customary in the literature, the fitness landscape is depicted as a continuous surface. Surface and vertex colors represent fitness values on a scale from blue (low fitness) to red (high fitness). Sub-hypercubes corresponding to three maximal cliques of the epistatic network G are highlighted in blue, green, and purple, respectively, with edges belonging to two sub-hypercubes colored in intermediate shades. The circled vertices represent local maximums within each sub-hypercube. For example, all minor alleles of the genotypes g4, g6, g7, g8, g10, g11, and g12 are situated at loci 1, 2, or 3. These loci form a clique of the epistatic network, while these genotypes, together with the wild-type genotype g0, form a 3-dimensional sub-hypercube of the sequence space (highlighted in black in (c)). The genotype g12 has the maximum fitness within this sub-hypercube.
Fig. 6
Fig. 6. General scheme of HELEN.
Step 1: construction of a coordinated substitution network (CSN) from aligned sequences. Step 2: generation of candidate dense subgraphs of CSN (highlighted in different colors). Step 3: construction of an intersection graph of subgraphs. Each colored vertex represents a subgraph of the same color; two vertices are adjacent whenever the corresponding subgraphs have sufficiently many common vertices (in this example—two). Step 4: decomposition of the intersection graph into clusters (depicted as ovals). Each cluster reflects a single haplotype. Step 5: construction of the haplotype for each cluster. The haplotype is found as a densest community in the union of the CSN subgraphs forming that cluster (e.g., the haplotype H1 is found as the union of the blue and the red subgraphs that form the cluster C1).

Similar articles

Cited by

References

    1. Lässig M, Mustonen V, Walczak AM. Predicting evolution. Nat. Ecol. Evol. 2017;1:1–9. doi: 10.1038/s41559-017-0077. - DOI - PubMed
    1. Icer Baykal PB, Lara J, Khudyakov Y, Zelikovsky A, Skums P. Quantitative differences between intra-host hcv populations from persons with recently established and persistent infections. Virus Evol. 2021;7:103. doi: 10.1093/ve/veaa103. - DOI - PMC - PubMed
    1. Maher MC, et al. Predicting the mutational drivers of future sars-cov-2 variants of concern. Sci. Transl. Med. 2022;14:3445. doi: 10.1126/scitranslmed.abk3445. - DOI - PMC - PubMed
    1. Rodriguez-Rivas J, Croce G, Muscat M, Weigt M. Epistatic models predict mutable sites in sars-cov-2 proteins and epitopes. Proc. Natl. Acad. Sci. USA. 2022;119:2113118119. doi: 10.1073/pnas.2113118119. - DOI - PMC - PubMed
    1. Davies NG, et al. Estimated transmissibility and impact of sars-cov-2 lineage b. 1.1. 7 in England. Science. 2021;372:3055. doi: 10.1126/science.abg3055. - DOI - PMC - PubMed