. 2024 Apr 2;14(1):7759.
doi: 10.1038/s41598-024-57707-6.

Key HPI axis receptors facilitate light adaptive behavior in larval zebrafish

Affiliations

Key HPI axis receptors facilitate light adaptive behavior in larval zebrafish

Han B Lee et al. Sci Rep. .

Abstract

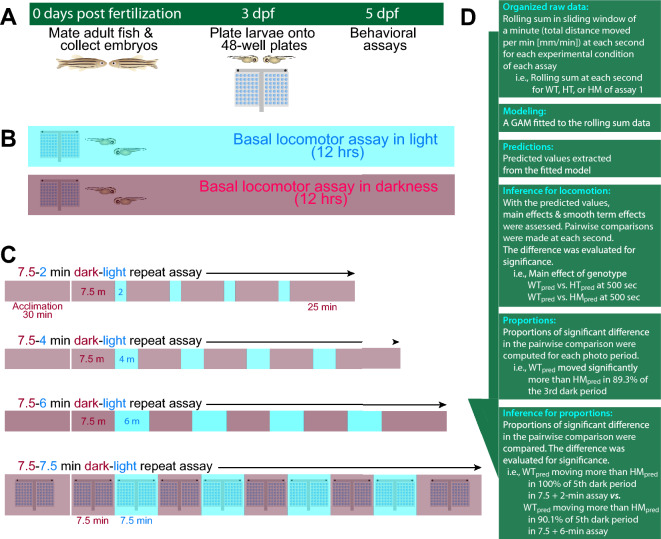
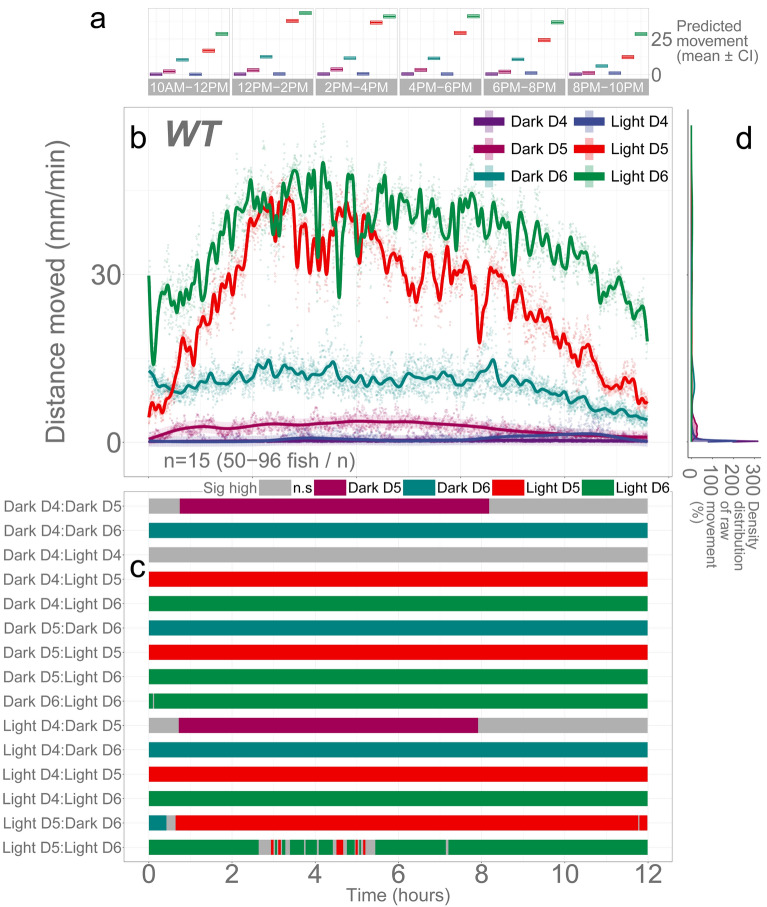
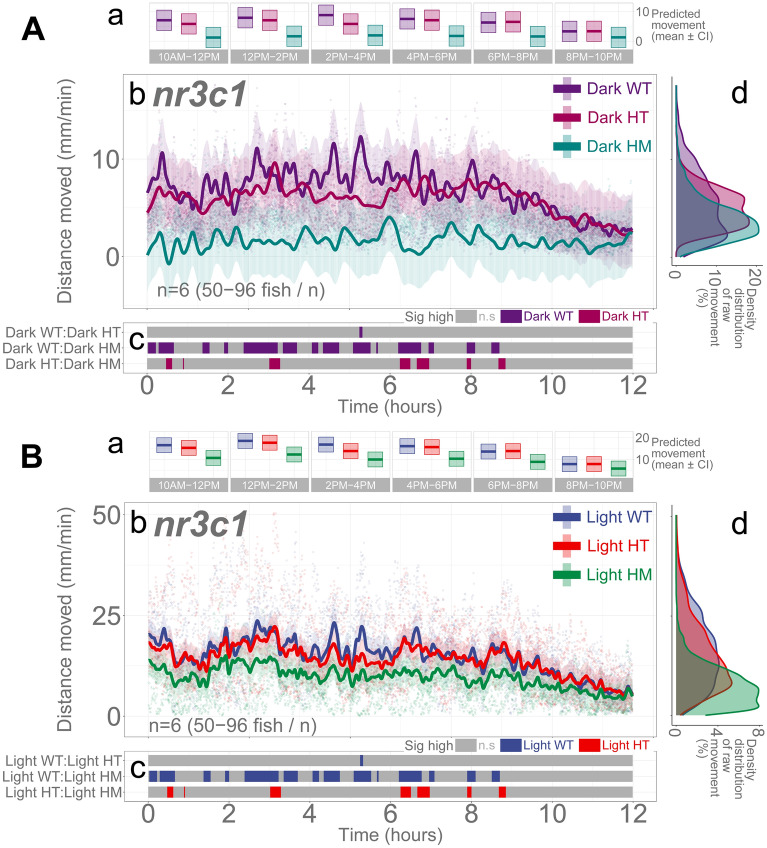
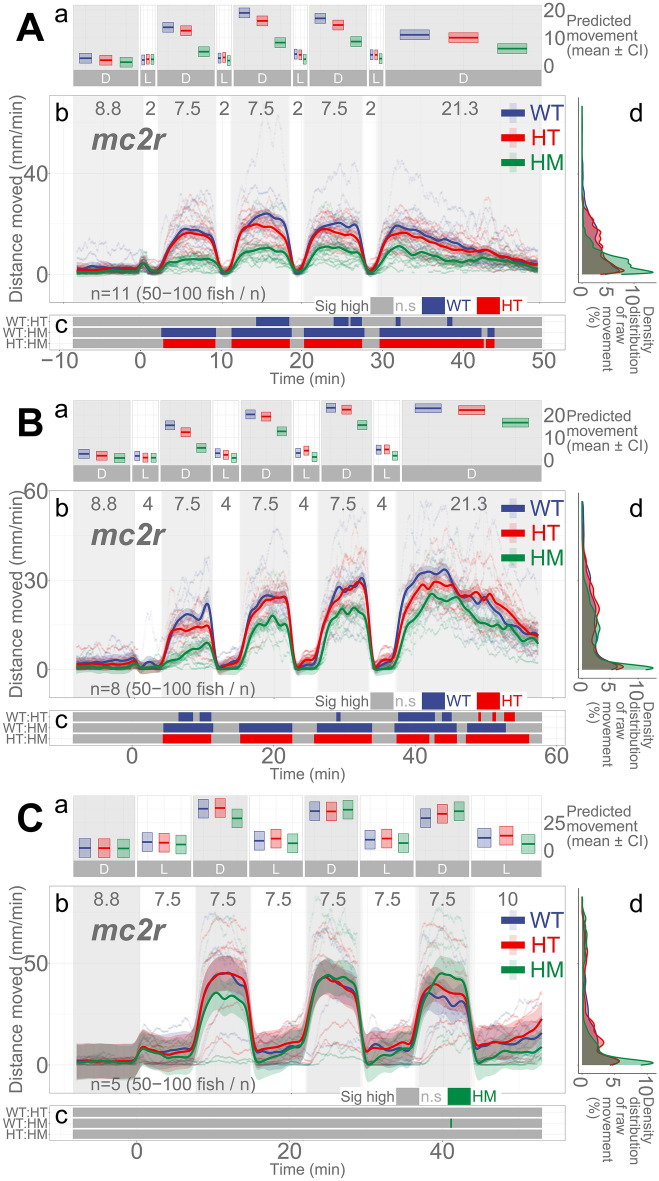
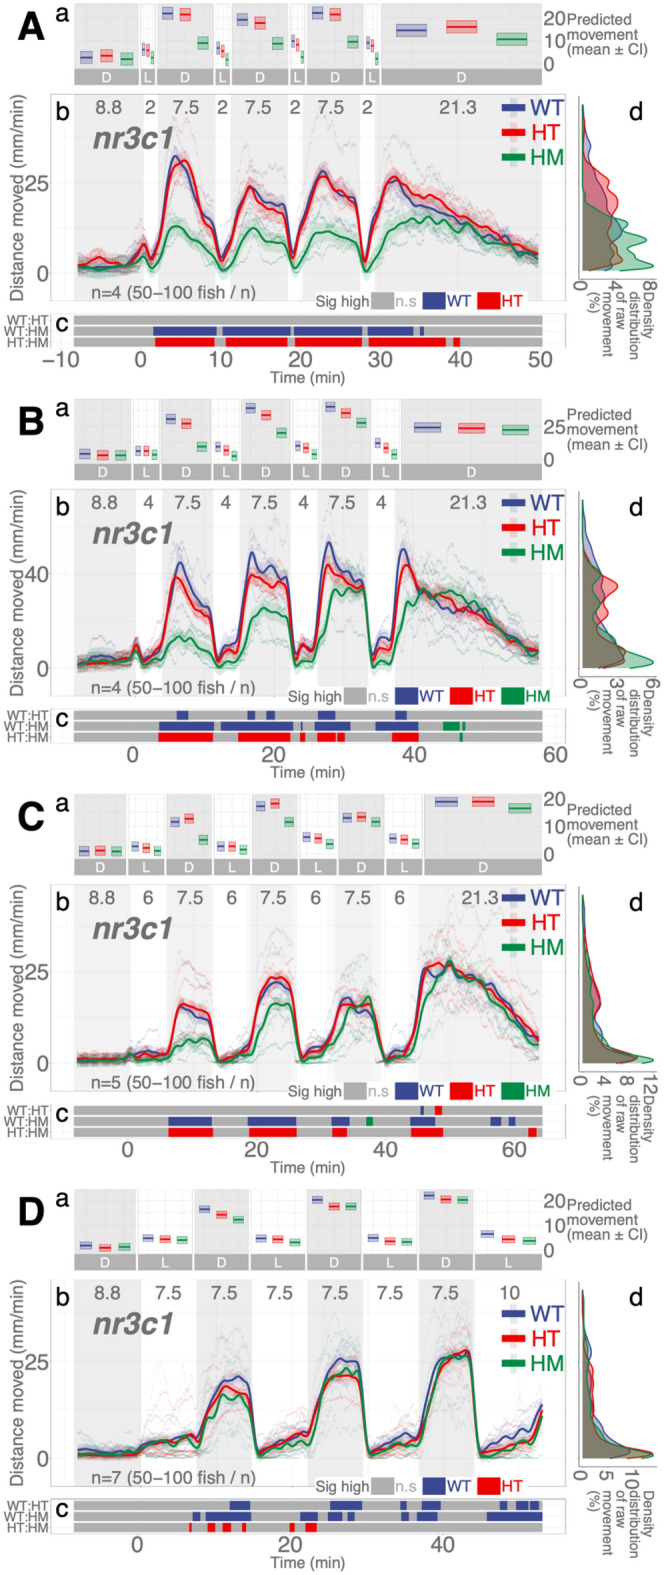
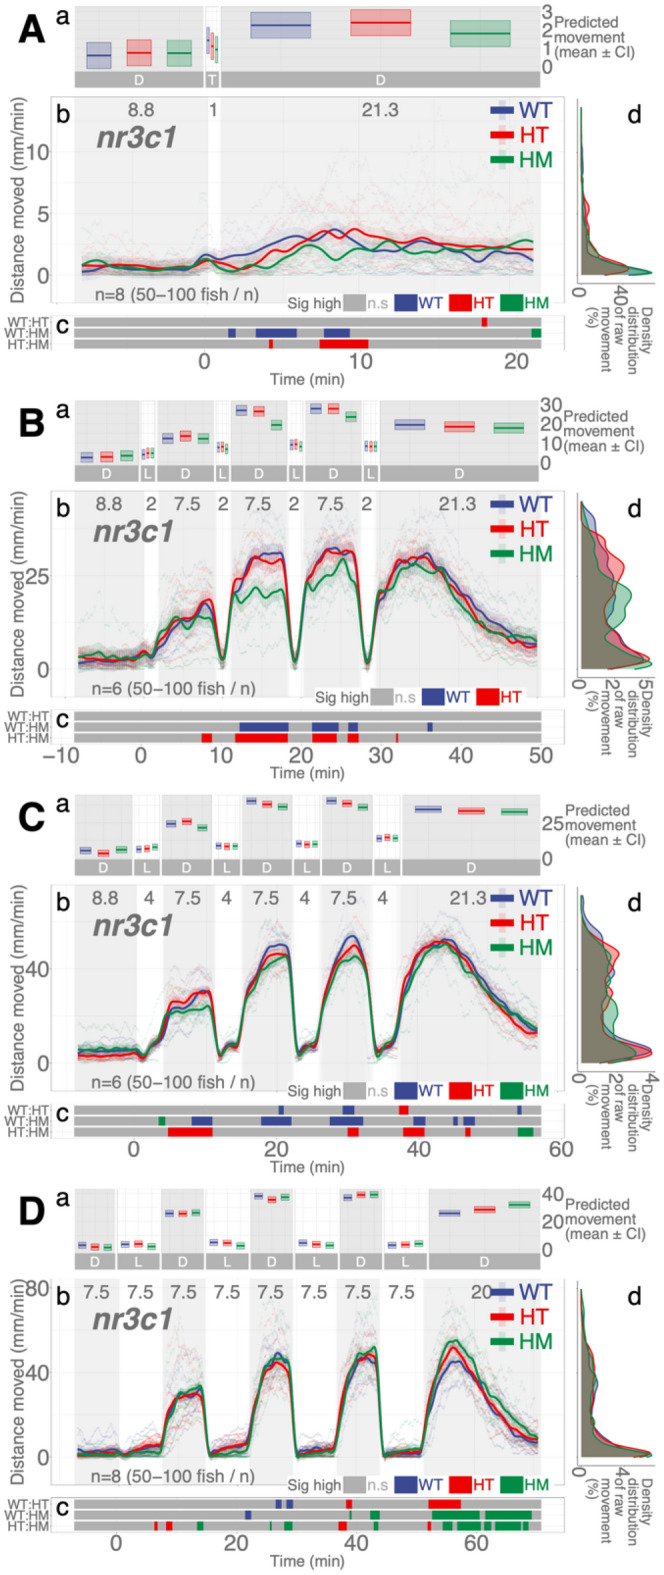
The vertebrate stress response (SR) is mediated by the hypothalamic-pituitary-adrenal (HPA) axis and contributes to generating context appropriate physiological and behavioral changes. Although the HPA axis plays vital roles both in stressful and basal conditions, research has focused on the response under stress. To understand broader roles of the HPA axis in a changing environment, we characterized an adaptive behavior of larval zebrafish during ambient illumination changes. Genetic abrogation of glucocorticoid receptor (nr3c1) decreased basal locomotor activity in light and darkness. Some key HPI axis receptors (mc2r [ACTH receptor], nr3c1), but not nr3c2 (mineralocorticoid receptor), were required to adapt to light more efficiently but became dispensable when longer illumination was provided. Such light adaptation was more efficient in dimmer light. Our findings show that the HPI axis contributes to the SR, facilitating the phasic response and maintaining an adapted basal state, and that certain adaptations occur without HPI axis activity.

Keywords: GAM (generalized additive models); GR (glucocorticoid receptor); Light adaptation; Light assays; Stress response; Zebrafish.


Conflict of interest statement

The authors declare no competing interests.

Figures

Figure 1
Figure 1
Schematics of experimental process and behavioral assay paradigms. (A) Experimental flow. Embryos obtained on 0 days-post-fertilization (dpf) through natural spawning. Healthy larvae were plated onto a pair of 48-well plates on 3–4 dpf. Assays were performed on 5 dpf unless otherwise stated. (B) Baseline assays. Larvae were videorecorded without any exogenous stimuli for about 12 h between 9:30 a.m. and 10:30 p.m. in light or darkness. (C) Dark–light repeat assays. Fish were observed in a changing illumination regimen i.e., 30-min acclimation + 4 × [7.5-min dark + 7.5-min light] + 25-min dark. Some assays do not include the final [25-min dark] component since they were performed before the experimental protocol was established. (D) Statistical analysis pipeline post-experiment. GAM modeling produces main effects of the predictors (i.e., genotype, illumination, developmental stages). When the main effect of the predictor is statistically significant, pairwise post-hoc analyses were conducted to identify the significant difference temporally (time points) and in the comparison group. The outcome of the statistical significance in the time window was summarized into proportions of significance over the entire range of time. Subsequently, the proportion was assessed for statistical significance to obtain the difference between different assay regimens (i.e., [7.5 + 2-min] assay vs. [7.5 + 7.5-min] assay). Inferences for the proportions were not made for baseline assays because there was only one assay regimen for the baseline assay (continuous recording in a dark or lit condition). GAM: generalized additive model.
Figure 2
Figure 2
Illumination and developmental stages are determinants of basal locomotion in WT larvae. The x-axis of the panels (ac) are Time in hours labeled below panel (c). The y-axis is given in each panel. (a) Descriptive statistics summarizing mean activity level. Locomotor activity (mean predicted value [mm/min] ± 95% CI) for each experimental condition predicted by the generalized additive model (GAM) for each time span. (b) Basal locomotor activity of WT larvae over 12 h. The scatterplot (points) shows actual mean locomotor activity (mm/min) for each experimental condition of each assay. The line graph shows predicted locomotor activity for each experimental condition by the GAM (predicted value ± 95% CI). (c) Time points where an experimental condition showed significantly higher locomotor activity compared to the other in a pairwise comparison. The color shown indicates the group with a significantly higher outcome in a pairwise comparison. For the actual numbers of pairwise comparison, refer to the corresponding Supplementary Tables of each Figure. For the main effects and smooth effects of the model, refer to the corresponding Supplementary Data for each Figure. (d) Histogram of individual fish locomotion (y-axis is the same as subpanel (b) [Distance moved]). Density distribution of actual mean locomotor activity shows severely right skewed distribution (low locomotor response). The integration of the curve equals 100%. Since individual y-axis bin (distance moved [mm/min]) is smaller than 1 (i.e., 0.2 mm/min), the x-axis values reach over 100% while the area under the curve is still 100%. (D: dark, D4: 4 dpf, L: light, n.s: not significant).
Figure 3
Figure 3
Illumination and genotype are determinants of basal locomotion in nr3c1 knockout larvae. Aa Ba Locomotor activity (mean predicted value [mm/min] ± 95%CI) for each genotype and experimental condition ((A) in darkness, (B) in light). (Ab, Bb) Basal locomotor activity of nr3c1 knockout larvae over 12 h. The scatterplot (points) shows actual mean locomotor activity (mm/min) for each experimental condition of each assay. The line graph shows predicted locomotor activity for each experimental condition by the GAM (predicted value ± 95%CI). (Ac, Bc) Time points where an experimental condition showed significantly higher locomotor activity compared to the other in a pairwise comparison. The color shown indicates the group with a significantly higher outcome in a pairwise comparison. (Ad, Bd) Histogram of individual fish locomotion (y-axis is the same as subpanel [b]). Density distribution of actual mean locomotor activity shows severely right skewed distribution (low locomotor response). The integration of the curve equals 100%. (D: dark, L: light, WT: wildtype, HT: heterozygous, HM: homozygous, n.s: not significant, nr3c1 genotypes: nr3c1+/+ [WT], nr3c1+/mn63 [HT], nr3c1mn63/mn63 [HM, KO], or nr3c1+/mn65 [HT], nr3c1mn65/mn65 [HM, KO]).
Figure 4
Figure 4
mc2r knockout larvae respond differentially in darkness based on the durations of illumination and genotype. (Aa, Ba, Ca) Locomotor activity (mean predicted value [mm/min] ± 95% CI) for each experimental condition predicted by the GAM for each photo period (gray: dark, white: light period). (Ab, Bb, Cb) Locomotor response of mc2rex1 larvae during dark–light repeat assays. The scatterplot (points) shows actual mean locomotor activity (mm/min) for each experimental condition of each assay. The line graph shows predicted locomotor activity for each experimental condition by the GAM (predicted value ± 95% CI; gray: dark, white: light period). (Ac, Bc, Cc) Time points where an experimental condition showed significantly high locomotor activity compared to the other in a pairwise comparison. The color shown indicates the group with a significantly higher outcome in a pairwise comparison. (Ad, Bd, Cd) Histogram of individual fish locomotion (y-axis is the same as subpanel [b]). Actual mean locomotor activity shows severely right skewed distribution (low locomotor response). The integration of the curve equals 100%. (D: dark, L: light, WT: wildtype, HT: heterozygous, HM: homozygous, n.s: not significant, mc2r genotypes: mc2r+/+ [WT], mc2r+/mn57 [HT], mc2rmn57/mn57 [HM, KO], mc2r+/mn58 [HT], mc2rmn58/mn58 [HM, KO], or mc2r+/mn59 [HT], mc2rmn59/mn59 [HM, KO]).
Figure 5
Figure 5
nr3c1 knockout larvae respond differentially in darkness based on the durations of illumination and genotype. (Aa, Ba, Ca, Da) Locomotor activity (mean predicted value [mm/min] ± 95% CI) for each experimental condition predicted by the GAM for each photo period (gray: dark, white: light period). (Ab, Bb, Cb, Db) Locomotor response of nr3c1 larvae during dark–light repeat assays. The scatterplot (points) shows actual mean locomotor activity (mm/min) for each experimental condition of each assay. The line graph shows predicted locomotor activity for each experimental condition by the GAM (predicted value ± 95% CI; gray: dark, white: light period). (Ac, Bc, Cc, Dc) Time points where an experimental condition showed significantly high locomotor activity compared to the other in a pairwise comparison. The color shown indicates the group with a significantly higher outcome in a pairwise comparison. (Ad, Bd, Cd, Dd) Histogram of individual fish locomotion (y-axis is the same as subpanel [b]). Density distribution of actual mean locomotor activity shows severely right skewed distribution (low locomotor response). The integration of the curve equals 100%. (D: dark, L: light, WT: wildtype, HT: heterozygous, HM: homozygous, n.s: not significant, nr3c1 genotypes: nr3c1+/+ [WT], nr3c1+/mn63 [HT], nr3c1mn63/mn63 [HM, KO], or nr3c1+/mn65 [HT], nr3c1mn65/mn65 [HM, KO]).
Figure 6
Figure 6
Mutation in nr3c2 do not have main effect on locomotion. (Aa, Ba, Ca) Locomotor activity (mean predicted value [mm/min] ± 95% CI) for each experimental condition predicted by the GAM for each photo period (gray: dark, white: light period). (Ab, Bb, Cb) Locomotor response of nr3c2ex2 larvae during dark–light repeat assays. The scatterplot (points) shows actual mean locomotor activity (mm/min) for each experimental condition of each assay. The line graph shows predicted locomotor activity for each experimental condition by the GAM (predicted value ± 95% CI; gray: dark, white: light period). (Ac, Bc, Cc) Time points where an experimental condition showed significantly high locomotor activity compared to the other in a pairwise comparison. Despite such apparent significant difference at some time points, there was no main effect of being HM on locomotor response compared to WT siblings (Refer to the “Results”). The significance in the post-hoc analysis should not be taken into consideration. The tile graphs are provided to show the incoherent patterns in difference and for consistency with other Figures. (Ad, Bd, Cd) Histogram of individual fish locomotion (y-axis is the same as subpanel [b]). Density distribution of actual mean locomotor activity shows severely right skewed distribution (low locomotor response). The integration of the curve equals 100%. (D: dark, L: light, WT: wildtype, HT: heterozygous, HM: homozygous, n.s: not significant, nr3c2 genotypes: nr3c2+/+ [WT], nr3c2+/mn67 [HT], nr3c2mn67/mn67 [HM, KO]).
Figure 7
Figure 7
nr3c1 (gr) and nr3c2 (mr) double knockout larvae show varying locomotor activity levels in darkness after short illumination (1-min) (a) Locomotor activity (mean predicted value [mm/min] ± 95% CI) for each genotype (gr WT mr WT, gr WT mr HM, gr HM mr WT, gr HM mr HM), predicted by the GAM. Only WT and HM mutants are shown to increase readability in this figure while the full genotypic combinations are shown in Supplementary Fig. S87. The underlying data set is the same in the two figures. (b) Locomotor response in the baseline (dark) and post-illumination (dark). The scatterplot (points) shows actual mean locomotor activity (mm/min) for each experimental condition of each assay. The line graph shows predicted locomotor activity for each genotype by the GAM (predicted value ± 95% CI). (c) Time points where a genotype showed significantly high locomotor activity compared to the other in a pairwise comparison. (d) Density distribution of actual mean locomotor activity shows severely right skewed distribution. The integration of the curve equals 100% (gr: glucocorticoid receptor [nr3c1], mr: mineralocorticoid receptor [nr3c2], D: dark, T: treatment [illumination], WT: wildtype, HM: homozygous, n.s: not significant, nr3c1 genotypes: nr3c1+/+ [WT], nr3c1+/mn63 [HT], nr3c1mn63/mn63 [HM, KO], or nr3c1+/mn65 [HT], nr3c1mn65/mn65 [HM, KO], nr3c2 genotypes: nr3c2+/+ [WT], nr3c2+/mn67 [HT], nr3c2mn67/mn67 [HM, KO]).
Figure 8
Figure 8
Much dimmer illumination reproduces the same pattern of dark–light responses in nr3c1 knockout larvae and may lead to more effective photoadaptation. Dimmer illumination (20.5 µW cm−2; 300 lx) was used compared to that of all other experiments (469.4 µW cm−2; 8000 lx). IR illumination was the same (116.0 µW cm−2; 0 lx). (Aa, Ba, Ca, Da) Locomotor activity (mean predicted value (mm/min) ± 95% CI) for each experimental condition predicted by the GAM for each photo period (gray: dark, white: light period). A brief illumination assay (1-min light) without the repeat components was included to understand behavior in dim light (A). (Ab, Bb, Cb, Db) Locomotor response of nr3c1ex5 larvae during dark–light repeat assays. The scatterplot (points) shows actual mean locomotor activity (mm/min) for each experimental condition of each assay. The line graph shows predicted locomotor activity for each experimental condition by the GAM (predicted value ± 95% CI; gray: dark, white: light period). (Ac, Bc, Cc, Dc) Time points where an experimental condition showed significantly high locomotor activity compared to the other in a pairwise comparison. Despite such apparent significant difference at some time points, there was no main effect of being HM on locomotor response compared to WT siblings, starting from the 2-min light assays (Refer to the “Results”). The tile graphs are provided to show the patterns in difference. (Ad, Bd, Cd, Dd) Histogram of individual fish locomotion (y axis is the same as the subpanel b). Density distribution of actual mean locomotor activity shows right skewed distribution (low locomotor response). The integration of the curve equals 100%. (D: dark, L: light, WT: wildtype, HT: heterozygous, HM: homozygous, n.s: not significant, nr3c1+/+ [WT], nr3c1+/mn63 [HT], nr3c1mn63/mn63 [HM, KO], or nr3c1+/mn65 [HT], nr3c1mn65/mn65 [HM, KO]).

Update of

Similar articles

Cited by

References

    1. Russell G, Lightman S. The human stress response. Nat. Rev. Endocrinol. 2019;15:525–534. doi: 10.1038/s41574-019-0228-0. - DOI - PubMed
    1. Chrousos GP. Stress and disorders of the stress system. Nat. Rev. Endocrinol. 2009;5:374–381. doi: 10.1038/nrendo.2009.106. - DOI - PubMed
    1. Sapolsky RM, Romero LM, Munck AU. How do glucocorticoids influence stress responses? Integrating permissive, suppressive, stimulatory, and preparative actions. Endocr. Rev. 2000;21:55–89. doi: 10.1210/edrv.21.1.0389. - DOI - PubMed
    1. Nicolaides NC, Charmandari E, Kino T, Chrousos GP. Stress-related and circadian secretion and target tissue actions of glucocorticoids: Impact on health. Front. Endocrinol. (Lausanne) 2017;8:70. doi: 10.3389/fendo.2017.00070. - DOI - PMC - PubMed
    1. Spiga F, Lightman SL. Dynamics of adrenal glucocorticoid steroidogenesis in health and disease. Mol. Cell Endocrinol. 2015;408:227–234. doi: 10.1016/j.mce.2015.02.005. - DOI - PubMed

MeSH terms

Substances