. 2024 May;27(5):940-951.
doi: 10.1038/s41593-024-01594-7. Epub 2024 Apr 2.

Climbing fibers provide essential instructive signals for associative learning

Affiliations

Climbing fibers provide essential instructive signals for associative learning

N Tatiana Silva et al. Nat Neurosci. 2024 May.

Abstract

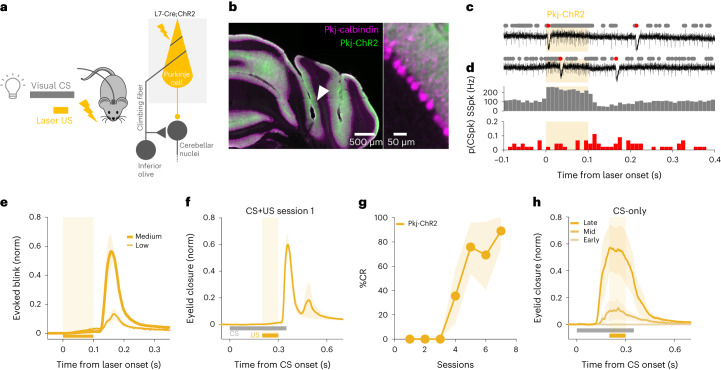
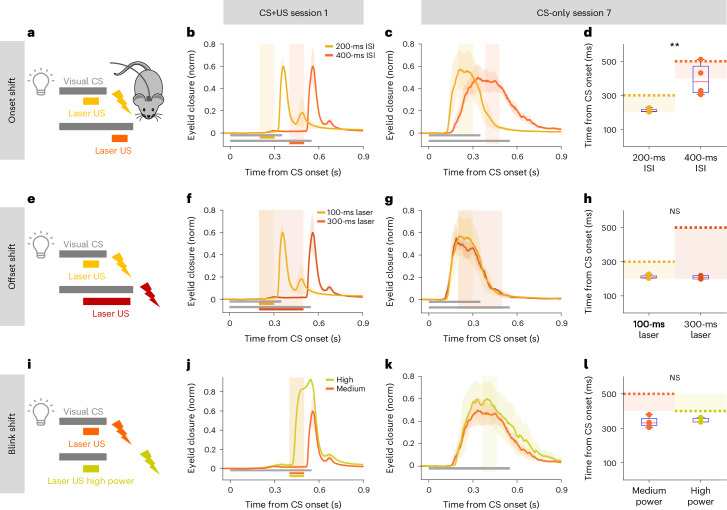
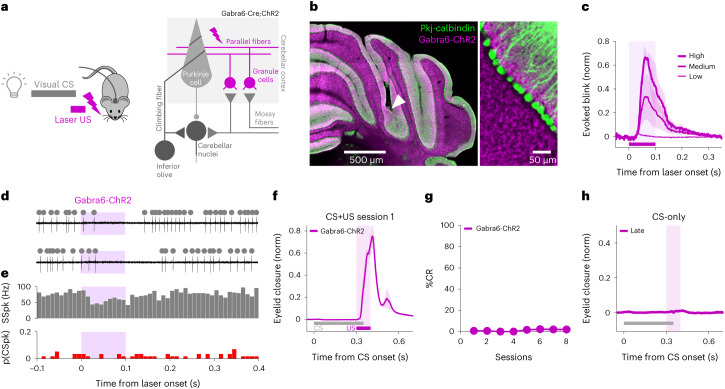
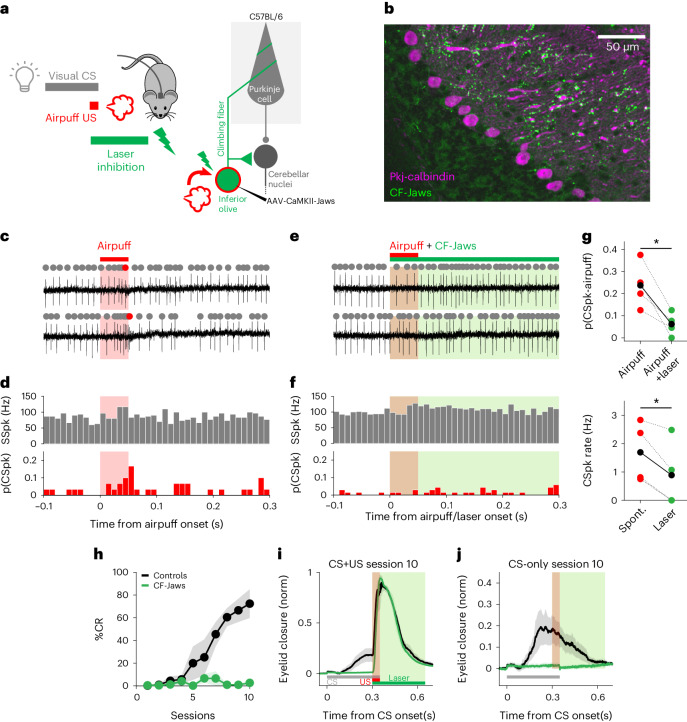
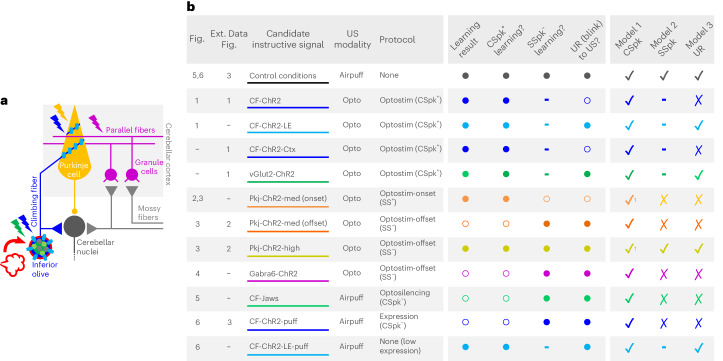
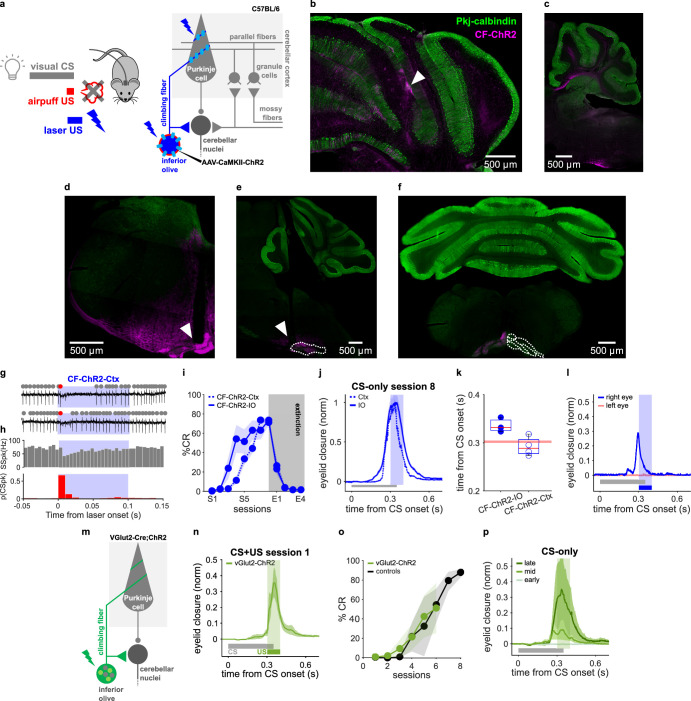
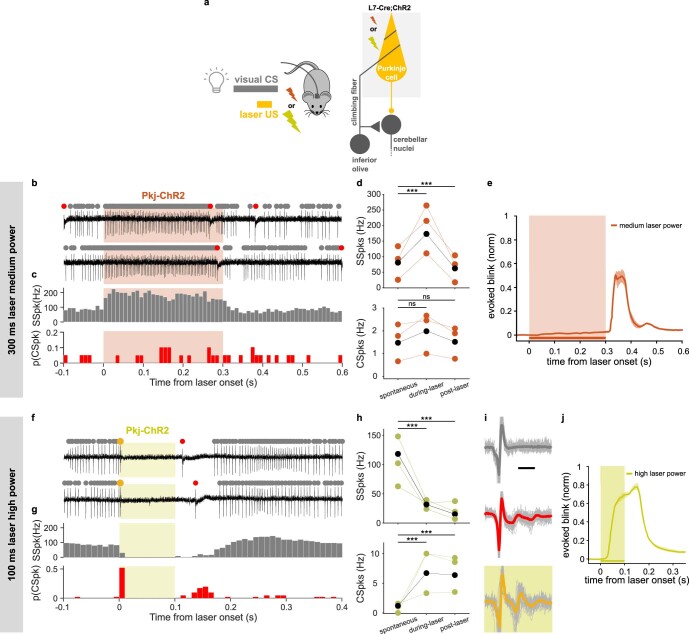
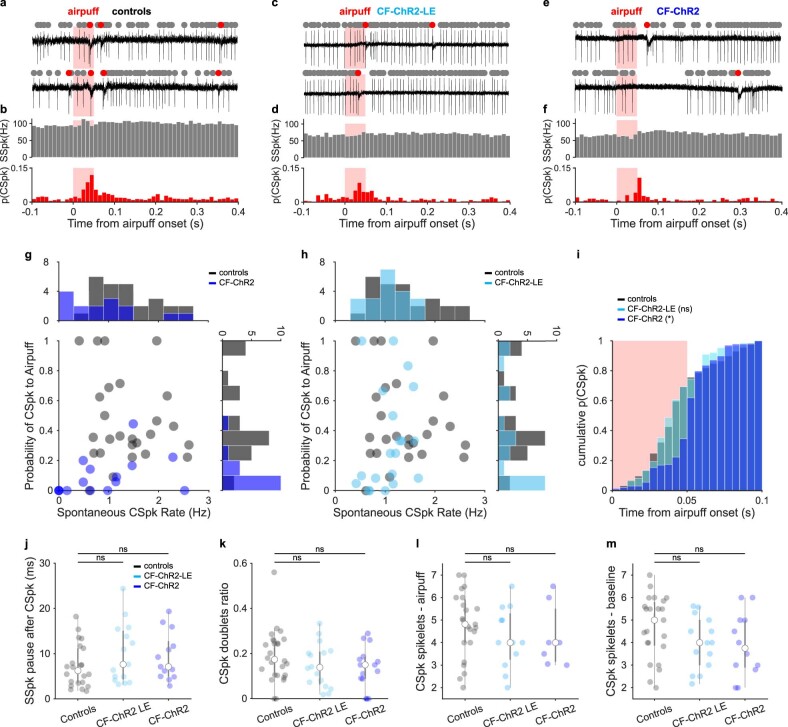
Supervised learning depends on instructive signals that shape the output of neural circuits to support learned changes in behavior. Climbing fiber (CF) inputs to the cerebellar cortex represent one of the strongest candidates in the vertebrate brain for conveying neural instructive signals. However, recent studies have shown that Purkinje cell stimulation can also drive cerebellar learning and the relative importance of these two neuron types in providing instructive signals for cerebellum-dependent behaviors remains unresolved. In the present study we used cell-type-specific perturbations of various cerebellar circuit elements to systematically evaluate their contributions to delay eyeblink conditioning in mice. Our findings reveal that, although optogenetic stimulation of either CFs or Purkinje cells can drive learning under some conditions, even subtle reductions in CF signaling completely block learning to natural stimuli. We conclude that CFs and corresponding Purkinje cell complex spike events provide essential instructive signals for associative cerebellar learning.


Conflict of interest statement

The authors declare no competing interests.

Figures

Fig. 1
Fig. 1. Optogenetic CF stimulation instructs eyeblink conditioning.
a, Left: experimental scheme. The traditional airpuff US was replaced by laser stimulation and paired with a visual CS. Right: cerebellar circuit and experimental strategy. b, Optical fibers implanted in either the left IO or right eyelid region of the cerebellar cortex, where Purkinje cells were recorded. c, Example sagittal section of cerebellar cortex (similar expression was observed in 15 mice). ChR2 (green) expression in CF inputs to Purkinje cells (magenta) (Extended Data Fig. 1). d, SSpk and CSpk Purkinje cell waveforms during spontaneous and laser epochs. e, Electrophysiological traces from a Purkinje cell showing SSpks (gray dots) and CSpks (red dots) during CF-ChR2 laser stimulation in IO (CF-ChR2-IO, blue). f, Population histogram of SSpk firing rate (gray) and CSpk probability (p(CSpk)) (red) (n = 74 trials, N = 4 units from 2 mice). CSpks: spontaneous versus laser, *P = 0.02, paired Student’s t-test; SSpks: spontantaneous versus laser, P = 0.22 nonsignificant (NS), paired Student’s t-test. g,h, As for e and f, respectively, but for CF-ChR2-LE animals (CF-ChR2-LE-IO; n = 102 trials, N = 8 cells from 2 mice). CSpks: spontaneous versus laser, *P = 0.01, paired Student’s t-test; SSpks: spontaneous versus laser, P = 0.11 NS, paired Student’s t-test. i, Average eyelid closure traces ± s.e.m. (shadows) from CS + US trials of the first training session showing no reflexive eyeblink to CF-ChR2-IO stimulation (N = 7 mice, blue) and very small eye twitch in CF-ChR2-LE-IO animals (N = 4 mice, light blue). norm, normalized. j, The %CR across daily training sessions ± s.e.m. (shadows) for CF-ChR2-IO (N = 7 mice, blue) or CF-ChR2-LE-IO (N = 4 mice, light blue) laser US training. Controls: wild-type mice (no ChR2 expression) with fiber in IO and laser US (N = 2 mice, black). The %CR at the last learning session (all two-sample Student’s t-tests): CF-ChR2-IO versus controls, ***P = 1.7726 × 10−4 (7 versus 2 mice); CF-ChR2-LE-IO versus controls, ***P = 4.0836 × 10−5 (4 versus 2 mice); CF-ChR2-IO versus CF-ChR2-LE-IO, P = 0.115 NS (7 versus 4 mice). k, Average eyelid closures ± s.e.m. (shadows) from CS-only trials of sessions 2, 4 and 8 for CF-ChR2-IO experiments shown in j. The shaded rectangle indicates time US would have appeared. l, Same as k but for sessions 2, 4 and 6 of CF-ChR2-LE-IO. m, Average eyelid closures ± s.e.m. (shadows) from CS-only trials after training to a 300-ms (blue, N = 4 mice) and 500-ms (green, N = 4 mice) CS + US ISI. Peak time: *P = 0.01, paired Student’s t-test.
Fig. 2
Fig. 2. Optogenetic stimulation of Purkinje cells can substitute for a US to drive learning.
a, Experimental scheme. L7-Cre;ChR2 mice were used to photostimulate Purkinje cells, which served as a US for conditioning. b, Example coronal section of cerebellar cortex indicating fiber placement in the eyelid area of the cerebellar cortex (white arrow) and labeling Purkinje cell ChR2 expression (green) and calbindin (magenta). Similar expression and fiber placement were observed in 11 mice. c, Example electrophysiological traces of Purkinje cell SSpks (gray dots) and CSpks (red dots) in response to Pkj-ChR2 laser stimulation (orange shading). d, Population histogram of SSpk rate (gray) and CSpk probability (p(CSpk)) (red; n = 44 trials, N = 2 cells from 2 mice) (see Extended Data Fig. 2d for statistics). e, Average eyelid closures ± s.e.m. (shadows) evoked by low and medium-power Pkj-ChR2 stimulation. Note the blink at stimulus offset. Peak amplitude of evoked blink: low versus medium power, *P = 0.047, paired Student’s t-test (N = 4 mice). f, Average eyelid closures ± s.e.m. (shadows) on CS + US trials in the first training session showing the blink evoked by Pkj-ChR2-US laser stimulation (N = 4 mice). g, The %CR across training sessions ± s.e.m. (shadows) to a Pkj-ChR2 US (N = 4 mice, plotted as in Fig. 1j). h, Average eyelid traces ± s.e.m. (shadows) from CS-only trials of sessions 2, 4 and 7 of the experiments in g.
Fig. 3
Fig. 3. Learning evoked by optogenetic Purkinje cell stimulation is temporally coupled to stimulation onset and not evoked blinks or SSpk modulation.
a,e,i, Schemes for Pkj-ChR2-US experiments in which stimulation onset timing, duration and intensity were varied systematically to dissociate candidate instructive signals (Extended Data Fig. 2). a, US onset shifts to obtain CS + US ISIs of 200 ms (yellow) or 400 ms (orange). b, CS + US trials before training, showing evoked blinks occurring at US offset in the two conditions (N = 4 mice for each ISI, ±s.e.m. in shadows). c, CS-only trials after training, showing the dependence of timing of learned eyelid closures on timing of US onset. d, Timing of peak eyelid closures occurring later for the longer ISI. Peak time: 200-ms versus 400-ms ISI, **P = 0.009, two-sample Student’s t-test (4 versus 4 mice). Shaded rectangles indicate laser US duration and dashed lines blink onset. Each dot is one mouse; the box plots indicate median (center bar) and 25th to 75th percentiles (bottom and top borders), with whiskers extending to data extremes. e, US duration adjusted so that CS + US onset times were identical, but US offset (and blink) timing varied with respect to the CS. f, US-evoked blinks on CS + US trials occurring at stimulus offset (note temporal correspondence with blinks in b, ±s.e.m.) (Extended Data Fig. 2b–e). g,h, Learned CRs (g), and timing (h), showing timing dependence not on stimulus offset or the evoked blink, but, rather, stimulation onset (peak time: 100-ms versus 300-ms duration, P = 0.87 NS, two-sample Student’s t-test, 4 versus 2 mice). i,j, Laser intensity adjusted (i) to evoke a blink (j) (associated with a decrease in SSpks; Extended Data Fig. 2f–h) either at laser offset (orange ±s.e.m., as above) or, with higher intensities, at laser onset (lime green ±s.e.m., N = 3 mice). Laser US timings and durations were identical in the two conditions. k,l, Learned CRs (k) showing timing dependent only on time of stimulation onset and not varying with the timing of the evoked blink (l) (peak time: high versus medium laser power, P = 0.67 NS, two-sample Student’s t-test, 4 versus 3 mice) or the direction of SSpk modulation (Extended Data Fig. 2f–h).
Fig. 4
Fig. 4. Optogenetic stimulation of cerebellar granule cells drives a blink but not learning.
a, Experimental scheme. Gabra6-Cre;ChR2 mice were used to photostimulate cerebellar granule cells, which served as a US for conditioning. b, Example coronal sections (representative of six mice) of cerebellar cortex showing expression of ChR2 in granule cells (Gabra6-ChR2, magenta; Pkj-calbindin, green) and fiber placement in the eyeblink area of the cerebellar cortex (white arrow). c, Gabra6-ChR2 laser stimulation evoking intensity-dependent eyelid closures at stimulation onset (±s.e.m. in shadows). Peak amplitude of evoked blink: medium versus high power, *P = 0.03, paired Student’s t-test (N = 6 mice). d, Example electrophysiological traces of Purkinje cell SSpk (gray dots) and CSpk (red dots) modulation to Gabra6-ChR2 laser stimulation (purple shading). e, Population histograms (n = 56 trials, N = 3 cells from 2 mice) showing decrease in SSpks (spontaneous versus laser, ***P = 1.28 × 10−5, paired Student’s t-test) and no change in CSpks (spontaneous versus laser: P = 1 NS, paired Student’s t-test) on laser stimulation. f, Average eyelid closures ± s.e.m. (shadows) on CS + US trials of the first training session showing the blink evoked by Gabra6-ChR2 laser stimulation (purple, N = 6 mice). g, The %CR across sessions ± s.e.m. in shadow (N = 6 mice). h, Average eyelid traces ± s.e.m. (shadows) from CS-only trials of the last training session showing no learning (purple, N = 6 mice).
Fig. 5
Fig. 5. Inhibition of the IO that blocks airpuff US-driven CSpks eliminates eyeblink conditioning.
a, Experimental scheme. Photoinhibition of CFs during airpuff US in CS + US trials. (Duration was randomized to avoid consistently timed rebound excitation; Methods.) Wild-type animals were injected with AAV-CamKII-Jaws in the IO where an optical fiber was also placed to photoinhibit CFs. b, Example sagittal section of cerebellar cortex. Similar expression was seen in eight mice. Jaws (green) is expressed in CF inputs to Purkinje cells (magenta). c, Two example electrophysiological traces from a Purkinje cell with identified SSpks (gray) and CSpks (red) in response to airpuff stimulation (red shading). d, Population histogram of SSpks (gray) and CSpks (red) (n = 29 trials, N = 4 units from 2 mice). e,f, Same as c and d, respectively, but paired with CF-Jaws laser inhibition (green; n = 68 trials, same units as in c and d). Spontaneous SSpk rate pre- and during laser epochs (P = 0.42 NS, paired Student’s t-test, N = 4 units). g, Top: average probability of CSpks in airpuff-only versus airpuff + laser trials (*P = 0.028, paired Student’s t-test, N = 4 units). Bottom: spontaneous CSpk rate pre- and during laser epochs (*P = 0.026, Student’s t-test, N = 4 units). Each circle represents a unit, linked through conditions by a dotted line; the black solid circles and line represent the average. h, The %CR across sessions ± s.e.m. (shadows) with and without CF-Jaws laser inhibition (green and black, respectively, N = 4 mice for both). The %CR at the last learning session: CF-Jaws versus controls, **P = 0.0015, two-sample Student’s t-test. Control animals expressed Jaws in CFs but no laser was presented. i, Average eyelid closure traces ± s.e.m. (shadows) from CS + US trials of the last training session of the experiment shown in h revealing an absence of learning in the laser inhibition condition despite the intact unconditioned reflex to the airpuff US. The shaded rectangle indicates where in the trial the US (red) and the laser (green) appeared. j, Same as for i, but for CS-only trials. The shaded rectangles indicate where US and laser would have appeared.
Fig. 6
Fig. 6. Moderate ChR2 expression is associated with subtle reductions in CF signaling and abolishes learning to a sensory US.
a, Experimental scheme. A visual CS was paired with a sensory airpuff US in a traditional classic conditioning experiment in CF-ChR2 animals. b, CF-ChR2-puff animals, without any photostimulation, unable to learn to an airpuff US (blue, N = 6 mice), but recovered learning (CF-ChR2-LE-puff, light blue, N = 4 mice) on lowering ChR2 expression. Shadows correspond to ±s.e.m. (%CR at the last learning session: CF-ChR2-puff versus CF-ChR2-LE-puff, ***P = 7.75 × 10−5, two-sample Student’s t-test). c, Animals with both expression levels exhibiting robust UR blinks on CS + US trials (CF-ChR2-puff, blue, N = 6 mice and CF-ChR2-LE-puff, light blue, N = 4 mice, ±s.e.m. in shadows). d, Average eyelid traces ± s.e.m. (shadows) from CS-only trials of the last training session revealing no learning in CF-ChR2-puff animals (blue, N = 6 mice and CF-ChR2-LE-puff, light blue, N = 4 mice). e, Spontaneous (Spont.) CSpk firing rate for each Purkinje cell recorded from control (black, N = 26 cells from 4 mice), CF-ChR2-LE (light blue, N = 20 cells from 4 mice) and CF-ChR2 (blue, N = 15 units from 5 mice) mice. Controls versus CF-ChR2: *P = 0.04, two-sample Student’s t-test (26 versus 15 cells); controls versus CF-ChR2-LE: P = 0.24 NS, two-sample Student’s t-test (26 versus 20 cells). f, Probability of an airpuff-evoked CSpk for each Purkinje cell recorded. Controls versus CF-ChR2: ***P = 0.00003, two-sample Student’s t-test (26 versus 15 cells); controls versus CF-ChR2-LE: P = 0.16 NS, two-sample Student’s t-test (26 versus 20 cells). g,h, SSpk statistics for each Purkinje cell recorded from control (black), CF-ChR2-LE (light blue) and CF-ChR2 (blue) mice. g, SSpk spontaneous firing rate: controls versus CF-ChR2, P = 0.41 NS, two-sample Student’s t-test (26 versus 15 cells); controls versus CF-ChR2-LE, P = 0.07 NS, two-sample Student’s t-test (26 versus 20 cells). h, SSpk coefficient of variation (CV). Controls versus CF-ChR2: P = 0.33 NS, two-sample Student’s t-test (26 versus 15 cells); controls versus CF-ChR2-LE: P = 0.26 NS, two-sample Student’s t-test (26 versus 20 cells).
Fig. 7
Fig. 7. Summary of candidate instructive signals tested in the study and explanatory power of three models for cerebellar learning.
a, Cerebellar circuit for eyeblink conditioning, highlighting the different strategies used in the present study. b, Summary table indicating the candidate instructive signal evaluated with each experiment, ordered and color coded by figure number. Ext. Data Fig., Extended Data Figure. For each candidate tested, the presence/absence of robust learning is indicated, followed by the predictions of CSpk+, SSpk or blink-driven models for learning. Closed circles represent ‘yes’ and open circles ‘no’. The last three columns assess the congruence between each model’s prediction and the learning result that was observed (check marks indicate congruence and Xs indicate lack of congruence; dashes indicate no prediction). Optostim, optogenetic stimulation.
Extended Data Fig. 1
Extended Data Fig. 1. Multiple genetic and anatomical strategies for targeting IO neurons.
a, Experimental scheme. b-f, Histological examples representative of 11 CF-ChR2 mice with IO fiber, 4 with Ctx fiber. b, Coronal section showing fiber placement (white arrow), in eyelid area of right cerebellar cortex. c, Sagittal section showing ChR2 expression in climbing fiber projections to the cerebellar cortex. d, Coronal, and e, sagittal sections showing CF-ChR2 expression and optical fiber placement (white arrow) in left IO. f, Coronal section showing ChR2 expression in left IO. g, Electrophysiological traces from a Purkinje cell with identified SSpks (grey dots) and CSpks (red) during CF-ChR2 laser stimulation in cerebellar cortex (CF-ChR2-Ctx, blue). h, Population histogram of SSpks (grey) and CSpks (red) (n = 211 trials, N = 15 units from 5 mice). CSpks: spont. vs laser, P = 1.82e-06***, paired t-test; SSpks: spont. vs laser, **P = 0.002, paired t-test. i, %CR + -SEM over training (S1-S8) and extinction sessions (E1-E4) of animals with CF-ChR2 stimulation in IO (CF-ChR2-IO, solid line, N = 3 mice) or cerebellar cortex (CF-ChR2-Ctx, dotted line, N = 4 mice) as US. %CR in S8: CF-ChR2-IO vs CF-ChR2-Ctx, P = 0.71n.s., two-sample t-Test (3 vs 4 mice). j, Normalized CRs ( ± SEM, shadows) (for experiments in i) illustrate broader CR timing for CF-ChR2-IO stimulation, which had sustained CSpk increase (Fig. 1f,h vs Extended Data Fig. 1h). k, Eyelid closure timing was subtly later for CF-ChR2-IO. Peak time: CF-ChR2-IO vs CF-ChR2-Ctx, P = 0.37n.s, two-sample t-test (3 vs 4 mice). Each dot is one mouse; box plots indicate median (center bar), 25th-75th percentiles (bottom and top borders), whiskers extend to data extrema. l, Conditioning was unilateral (right eye blue, left eye red; N = 2 mice). m, Experimental scheme for experiments stimulating glutamatergic IO neurons as US (vGlut2-ChR2-IO). n, Average eyelid closures ±SEM (shadows) on CS + US trials in the first training session showing blink evoked by vGlut2-ChR2-IO stimulation (N = 3 mice). o, %CR ± SEM for learning to vGlut2-ChR2-IO stimulation (green, N = 3 mice) and controls (expressing ChR2 but without laser stimulation, learning to airpuff-US). %CR at last session: vGlut2-ChR2-IO vs controls, P = 0.94n.s., two-sample t-test (3 vs 3 mice). p, Average eyelid closure traces ±SEM (shadows) from CS-only trials of sessions 2,4,6 for vGlut2-ChR2-IO-US (N = 3 mice).
Extended Data Fig. 2
Extended Data Fig. 2. Varying intensity and duration of Purkinje cell optogenetic stimulation to dissociate stimulation onset, simple spike modulation, and evoked blinks.
a, Experimental scheme for pairing a visual CS with optogenetic Purkinje cell-US. b,c, Example electrophysiological traces (b) and histogram (c) from a Purkinje cell with identified SSpk (grey dots) and CSpk (red) in response to 300 ms medium intensity Pkj-ChR2 laser stimulation in the cerebellar cortex (Pkj-ChR2-Ctx-med; corresponds to Fig. 3e-h). d, SSpk rate (top) and CSpk rate (bottom) pre-, during- and post- laser epochs for the recordings in (b,c) and Fig. 2d (N = 3 units from 2 mice). SSpks: spont. vs during laser, P = 0. 4.8e-7***, paired t-test; spont. vs after laser, P = 0.0003***, paired t-test. CSpks: spont. vs during laser, P = 0.22n.s., paired t-test; spont. vs after laser, P = 0.87n.s., paired t-test. Each orange circle and line represents a unit, linked through conditions; the black solid circles and line represent the average. e, Average eyelid closures ±SEM (shadows) to 300 ms Pkj-ChR2-Ctx medium intensity laser stimulation (N = 2 mice, shading represents laser stimulation). f-j Higher intensity Pkj-ChR2-Ctx laser stimulation was used to evoke a pause in simple spikes and a short-latency evoked blink at stimulus onset (corresponds to Fig. 3i-l). This stimulation elicited electrophysiological signatures of complex spike-like events at laser onset and, with a longer and more variable delay, at laser offset (likely due to rebound from release of Purkinje cell inhibition via olivo-cerebellar loop. f,g, SSpk and CSpk traces and histograms (N = 2 units from 2 mice). h, Same as in d, but for high intensity Pkj-ChR2-Ctx laser stimulation. SSpks: spont. vs during laser, P = 9.9e-17***, paired t-test; spont. vs after laser, P = 9.86e-20***, paired t-test. CSpks: spont. vs during laser, P = 1.335e-15***, paired t-test; spont. vs after laser, P = 2.45e-14***, paired t-test. i, SSpk (grey) and spontaneous CSpk (red) waveforms. Yellow trace represents complex spike-like events at laser stimulation onset; note the correspondence to spontaneous CSpk waveforms (red). j, Pkj-ChR2 laser stimulation at higher intensities yields a blink at stimulus onset (N = 3 mice, shading represents laser stimulation, ±SEM in shadows).
Extended Data Fig. 3
Extended Data Fig. 3. Purkinje cell responses to an airpuff stimulus in controls and CF-ChR2 animals with different expression levels.
a, b, Example electrophysiological traces and population histograms (N = 26 units from 4 mice) of Purkinje cell SSpks (grey) and CSpks (red) from control mice in response to an airpuff. c,d, Same as a,b but for low ChR2-CF expression levels (CF-ChR2-LE; N = 20 units from 4 mice). e,f, Same as c,d but for standard CF-ChR2 expression (N = 15 units from 5 mice). g, p(CSpk) to airpuff vs. spontaneous CSpk rate for each Purkinje cell of controls vs. mice with standard CF-ChR2 expression (CF-ChR2). h, Same as g, but comparing controls vs. mice with low CF-ChR2 expression (CF-ChR2-LE). i, Normalized cumulative histogram of timing of the first CSpk after airpuff onset (grey: controls N = 26 cells from 4 animals; light blue, CF-ChR2-LE, N = 20 cells from 4 animals; blue: CF-ChR2 N = 15 cells from 5 mice); controls vs CF-ChR2, P = 0.03*, KS-test; controls vs CF-ChR2-LE, P =  0.67n.s., KS-test. Shaded rectangle indicates time of airpuff (red). j, Average pause in SSpks after a CSpk: controls vs CF-ChR2, P = 0.15n.s., two-sample t-test; controls vs CF-ChR2-LE, P = 0.24n.s., two- sample t-test. k, Average CSpk doublets (2 CSpks occurring within 200 ms of each other) ratio to total number of CSpks during spontaneous and airpuff epochs; controls vs CF-ChR2, P = 0.14n.s., two-sample t-test (15 cells in 5 mice); controls vs CF-ChR2-LE, P = 0.24n.s., two-sample t-test (20 cells in 4 mice). l,m, Average number of airpuff-driven and spontaneous CSpk spikelets, respectively. (All two- sample t-test) Airpuff: controls vs CF-ChR2, P = 0.5n.s., 15 cells in 5 mice; controls vs CF-ChR2- LE, P = 0.3n.s., 20 cells in 4 mice. Spont.: controls vs CF-ChR2, P = 0.1n.s. 15 cells in 5 mice; controls vs CF-ChR2-LE, P = 0.1n.s., 20 cells in 4 mice.

References

    1. Marr D. A theory of cerebellar cortex. J. Physiol. 1969;202:437–470. - PMC - PubMed
    1. Albus JS. A theory of cerebellar function. Math. Biosci. 1971;10:25–61.
    1. Ito M. Neural design of the cerebellar motor control system. Brain Res. 1972;40:81–84. - PubMed
    1. Raymond JL, Lisberger SG, Mauk MD. The cerebellum: a neuronal learning machine? Science. 1996;272:1126–1131. - PubMed
    1. Mauk MD, Donegan NH. A model of Pavlovian eyelid conditioning based on the synaptic organization of the cerebellum. Learn. Mem. 1997;4:130–158. - PubMed

Publication types