. 2024 Apr 2;88(5):53.
doi: 10.1007/s00285-024-02078-9.

The effects of spatially-constrained treatment regions upon a model of wombat mange

Affiliations

The effects of spatially-constrained treatment regions upon a model of wombat mange

Ivy J Hindle et al. J Math Biol. .

Abstract

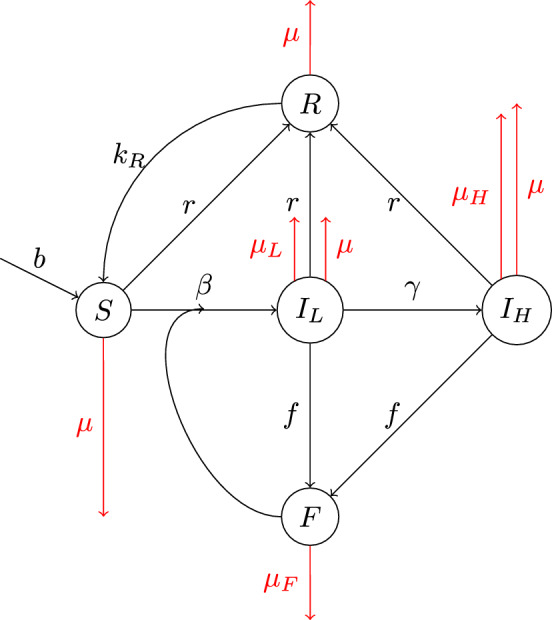
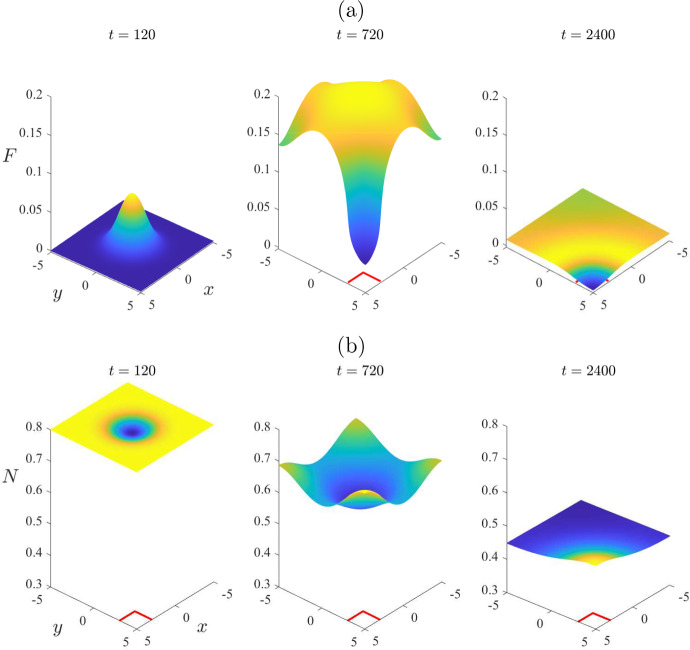
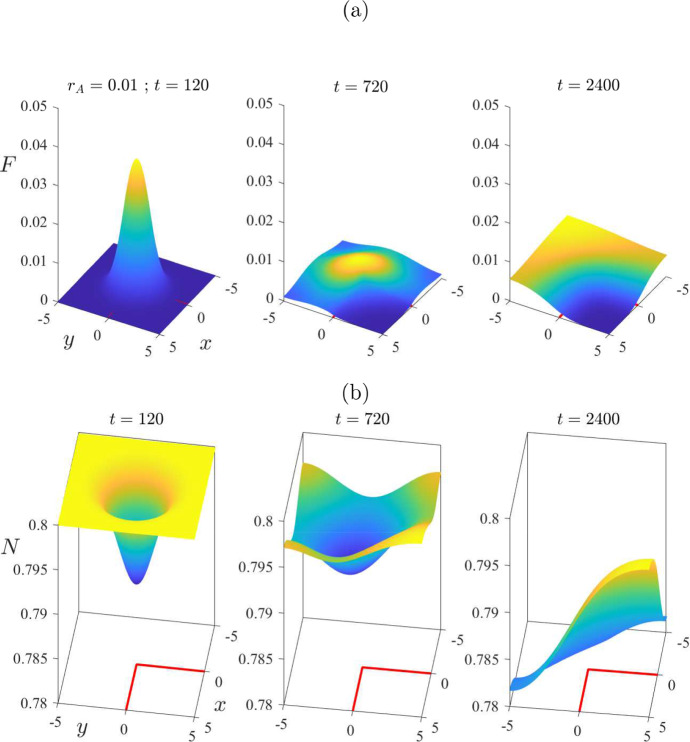
The use of therapeutic agents is a critical option to manage wildlife disease, but their implementation is usually spatially constrained. We seek to expand knowledge around the effectiveness of management of environmentally-transmitted Sarcoptes scabiei on a host population, by studying the effect of a spatially constrained treatment regime on disease dynamics in the bare-nosed wombat Vombatus ursinus. A host population of wombats is modelled using a system of non-linear partial differential equations, a spatially-varying treatment regime is applied to this population and the dynamics are studied over a period of several years. Treatment could result in mite decrease within the treatment region, extending to a lesser degree outside, with significant increases in wombat population. However, the benefits of targeted treatment regions within an environment are shown to be dependent on conditions at the start (endemic vs. disease free), as well as on the locations of these special regions (centre of the wombat population or against a geographical boundary). This research demonstrates the importance of understanding the state of the environment and populations before treatment commences, the effects of re-treatment schedules within the treatment region, and the transient large-scale changes in mite numbers that can be brought about by sudden changes to the environment. It also demonstrates that, with good knowledge of the host-pathogen dynamics and the spatial terrain, it is possible to achieve substantial reduction in mite numbers within the target region, with increases in wombat numbers throughout the environment.

Keywords: Mathematical model; Sarcoptic mange; Spatial variation; Terrain knowledge; Treatment; Wombats.


Conflict of interest statement

No conflict of interest exist.

Figures

Fig. 1
Fig. 1
A modified version of the model developed in Hindle et al. (2022). Here the transmission method is environmental (indirect) and the population of the mites is modelled explicitly, to represent this indirect transmission. In this diagram, S represents the sub-population of susceptible wombats, IL are asymptomatic carriers of the disease, IH are symptomatic infected wombats, F represents the proportion of fomites existing in the environment, and R are the treated wombats. The quantity r is the treatment rate, kR is the relapse rate at which treated wombats re-enter the susceptible group, b is the birth rate of wombats, μ is the death rate without infection of wombats, μL is the death rate due to asymptomatic infection, μH is the death rate due to symptomatic infection, β is the rate at which susceptible wombats are infected, γ is the rate at which asymptomatic wombats become symptomatic, f is the rate that infected wombats drop fomites into the environment and μF is the rate that fomites within the environment die
Fig. 2
Fig. 2
Equilibrium steady-state: a recovered sub-population R, b fomite population F and c total wombat population N, obtained using the parameters in Table 1. Results are shown for the mite death rate μF=1/190.0526 given in the Table, and also for the smaller value μF=0.005 discussed in the text
Fig. 3
Fig. 3
Region of stability for the mite-free equilibrium, as predicted by the linearized solution for μL=μH and parameter values taken from Table 1
Fig. 4
Fig. 4
A comparison of results obtained from the linearized solution of Sect. 4 with those obtained using the algorithm in Sect. 5 for the nonlinear problem. The parameters are all as given in Table 1. This figure illustrates the mite numbers F at the initial time t=0 and five subsequent times t=10, 20, 30, 40 and 50, on the centre-plane y=0. Linearized results are shown with solid (blue online) curves and numerical nonlinear results are drawn with dashed (red) lines (color figure online)
Fig. 5
Fig. 5
A comparison of results obtained from the linearized solution of Sect. 4 with those obtained using the algorithm in Sect. 5 for the nonlinear problem. The parameters are as given in Table 1, except that μF=0.005 and r=0.05. This figure illustrates: a the mite numbers F, and b the total wombat numbers N at the initial time t=0 and five subsequent times t=200, 400, 600, 800 and 1000, on the centre-plane y=0. The linearized solution is drawn with solid (blue) lines and the nonlinear results with dashed (red) lines (color figure online)
Fig. 6
Fig. 6
A comparison of results obtained from the linearized solution of Sect. 4 with those obtained using the algorithm in Sect. 5 for the nonlinear problem. The parameters are as given in Table 1, except that μF=0.005 and r=0.05. This figure illustrates: a the mite numbers F, and b the total wombat numbers N at times t=120 and t=480, 960, 1440, 1920 and 2400 days, on the centre-plane y=0. The initial condition consisted of a perturbation ε=0.2 to the mite-free state (16). The linearized solution (dashed, red lines) soon fails, but the nonlinear solution (solid, blue lines) evidently makes a transition to the endemic “plus” steady state (color figure online)
Fig. 7
Fig. 7
Some spatial patterns for selected times t=120, 960 and 2400, for the same case illustrated in Fig. 6. This figure illustrates: a the mite numbers F, and b the total wombat numbers N
Fig. 8
Fig. 8
Comparison of treated case (solid line—blue online) with untreated case (chain-dot line—purple online). Results obtained from the algorithm in Sect. 5 for the nonlinear problem. The parameters are as given in Table 1, except that there is assumed to be no ambient treatment, so that rA=0. There is then a single treatment (at the rate r=0.9/7 given in Table 1), over the time interval 200<t<250, in the square -1<x,y<1 centred at the origin. This figure illustrates: a the mite numbers F, and b the total wombat numbers N, at times t=120 and t=240, 720, 1320, 1920 and 2400 days, on the centre-plane y=0. The initial condition consisted of a perturbation ε=0.2 to the mite-free state (16) (color figure online)
Fig. 9
Fig. 9
A graph of the switching function fT(t) described in the text, that allows the treatment to be applied occasionally. Here, treatment is switched on at time t=200 days and off again at t=250 days. This treatment regime is repeated every 250 days
Fig. 10
Fig. 10
Comparison of treated case (solid line—blue online) with untreated case (chain-dot line—purple online). The parameters are the same as for Fig. 8. This figure illustrates: a the mite numbers F, and b the total wombat numbers N at times t=120 and t=240, 720, 1320, 1920 and 2400 days, on the centre-plane y=0. The initial condition consisted of a perturbation to the mite-free state (16). Multiple treatment occurred over a square centred at the origin (x,y)=(0,0) of the environment, lasting 50 days and repeating every 250 days. There was no ambient treatment, so that rA=0 with special rate rT=0.9/7 over the target region (color figure online)
Fig. 11
Fig. 11
Some spatial patterns for selected times t=120, 720 and 2400, for the same case illustrated in Fig. 10 with multiple treatment periods. This figure illustrates: a the mite numbers F, and b The total wombat numbers N for the treated case. There was no ambient treatment (rA=0) and the treatment rate was rT=0.9/7 over the central target region
Fig. 12
Fig. 12
Some spatial patterns for selected times t=120, 720 and 2400, for the same (treated) case illustrated in Fig. 10 with multiple treatment periods. There was no ambient treatment (rA=0) and the treatment rate rT=0.9/7 was applied over the square corner region indicated with (red) solid lines. This figure illustrates: a the mite numbers F, and b the total wombat numbers N (color figure online)
Fig. 13
Fig. 13
Some spatial patterns for selected times t=120, 720 and 2400, for the same (treated) case illustrated in Fig. 10 with multiple treatment periods. There was no ambient treatment (rA=0) and the treatment rate rT=0.9/7 was applied over a larger square corner region, indicated with (red) solid lines. This figure illustrates: a the mite numbers F, and b the total wombat numbers N (color figure online)
Fig. 14
Fig. 14
Some spatial patterns for selected times t=120, 720 and 2400, with multiple treatment periods applied in the same larger corner region as in Fig. 13. Here, however, there is an ambient treatment rate rA=0.01 across the entire region, with the treatment rate rT=0.9/7 from Table 1 used in the target region (indicated with red solid lines). This figure illustrates: a the mite numbers F, and b the total wombat numbers N (color figure online)

Similar articles

References

    1. Arlian LG, Morgan MS. A review of Sarcoptes scabiei: past, present and future. Parasites Vectors. 2017 doi: 10.1186/s13071-017-2234-1. - DOI - PMC - PubMed
    1. Arlian LG, Runyan RA, Achar S, Estes SA. Survival and infestivity of Sarcoptes scabiei var. canis and var. hominis. J Am Acad Dermatol. 1984;11:210–215. doi: 10.1016/S0190-9622(84)70151-4. - DOI - PubMed
    1. Astorga F, Carver S, Almberg ES, Sousa GR, Wingfield K, Niedringhaus KD, Van Wick P, Rossi L, Xie Y, Cross P, Angelone S, Gortázar C, Escobar LE (2018) International meeting on sarcoptic mange in wildlife, June 2018, Blacksburg, Virginia, USA. Parasites and Vectors, vol 11, p 449. 10.1186/s13071-018-3015-1 - PMC - PubMed
    1. Banks SC, Skerratt LF, Taylor AC. Female dispersal and relatedness structure in common wombats (Vombatus ursinus) J Zool Lond. 2002;256:389–399. doi: 10.1017/s0952836902000432. - DOI
    1. Beeton NJ, Carver S, Forbes LK. A model for the treatment of environmentally transmitted sarcoptic mange in bare-nosed wombats (Vombatus ursinus) J Theor Biol. 2019;462:466–474. doi: 10.1016/j.jtbi.2018.11.033. - DOI - PubMed

Supplementary concepts