. 2024 Apr;25(4):2071-2096.
doi: 10.1038/s44319-024-00113-w. Epub 2024 Apr 2.

The ER-SURF pathway uses ER-mitochondria contact sites for protein targeting to mitochondria

Affiliations

The ER-SURF pathway uses ER-mitochondria contact sites for protein targeting to mitochondria

Christian Koch et al. EMBO Rep. 2024 Apr.

Abstract

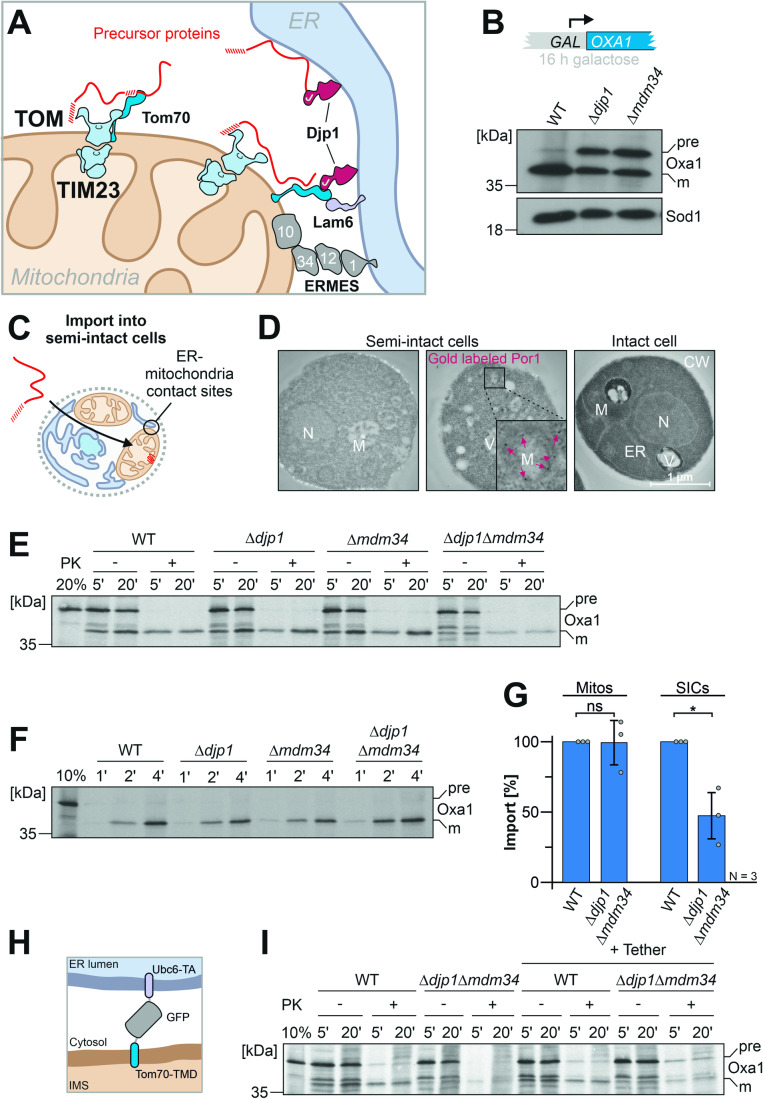
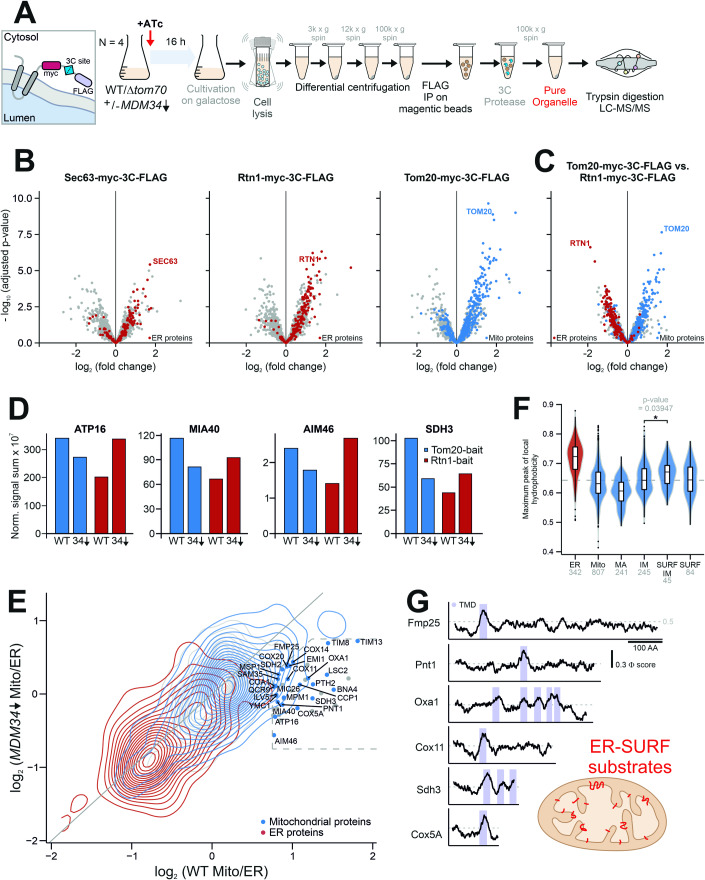
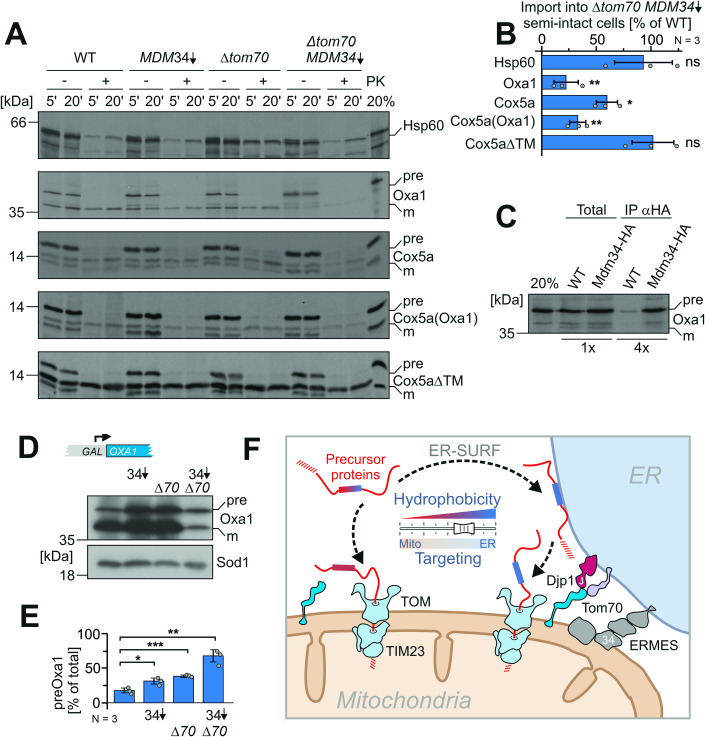
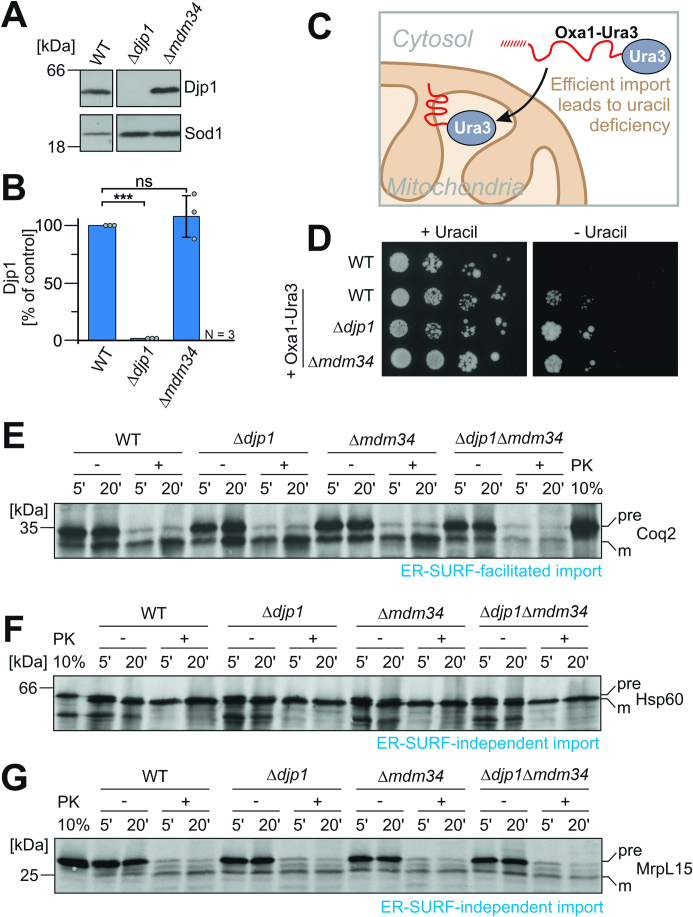
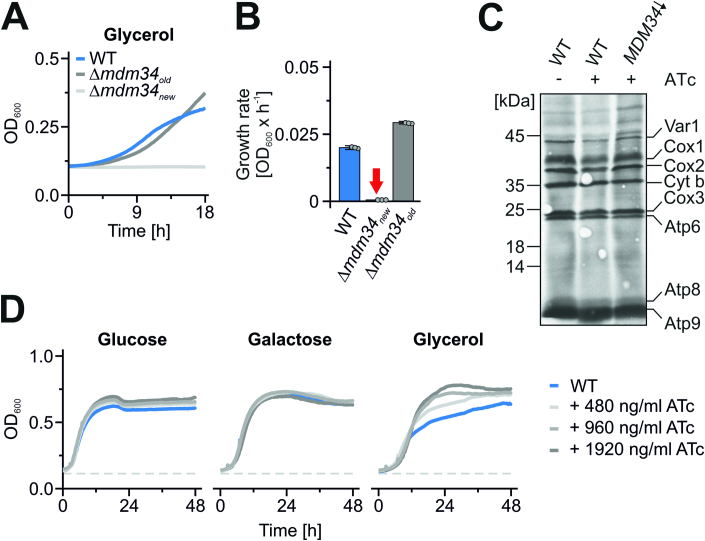
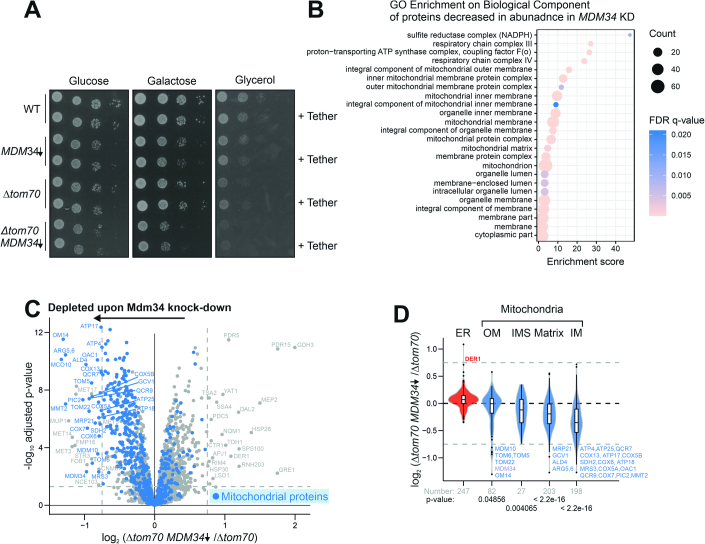
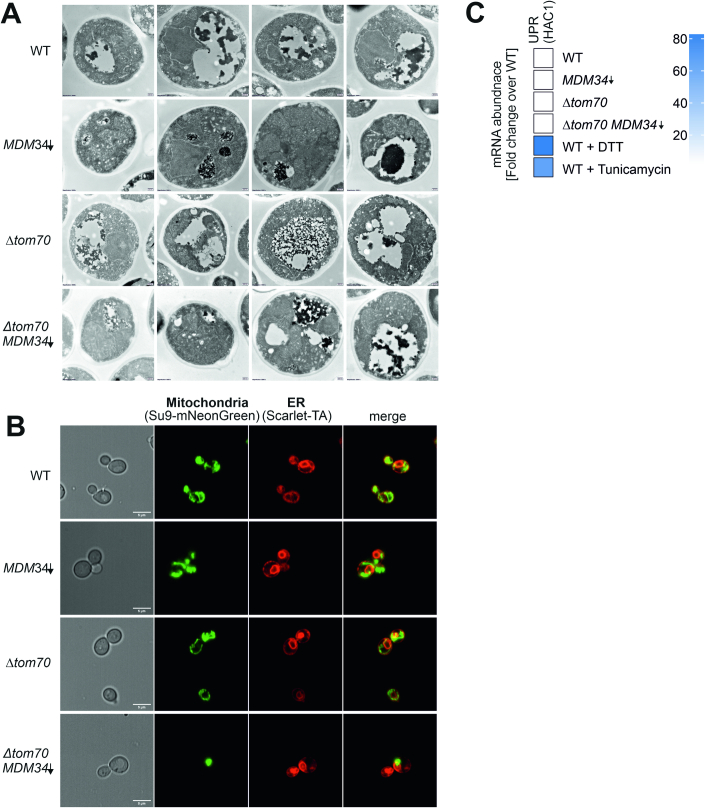
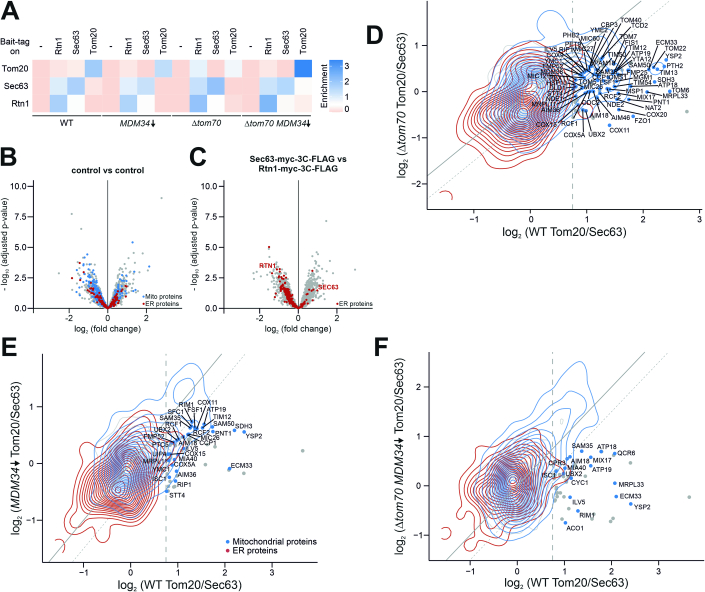
Most mitochondrial proteins are synthesized on cytosolic ribosomes and imported into mitochondria in a post-translational reaction. Mitochondrial precursor proteins which use the ER-SURF pathway employ the surface of the endoplasmic reticulum (ER) as an important sorting platform. How they reach the mitochondrial import machinery from the ER is not known. Here we show that mitochondrial contact sites play a crucial role in the ER-to-mitochondria transfer of precursor proteins. The ER mitochondria encounter structure (ERMES) and Tom70, together with Djp1 and Lam6, are part of two parallel and partially redundant ER-to-mitochondria delivery routes. When ER-to-mitochondria transfer is prevented by loss of these two contact sites, many precursors of mitochondrial inner membrane proteins are left stranded on the ER membrane, resulting in mitochondrial dysfunction. Our observations support an active role of the ER in mitochondrial protein biogenesis.

Keywords: Contact sites; ERMES; Endoplasmic reticulum; Mitochondria; Protein import.


Conflict of interest statement

The authors declare no competing interests.

Figures

Figure 1
Figure 1. Djp1 and ERMES cooperate in ER-SURF targeting.
(A) Schematic representation of the ER-SURF pathway. Precursor proteins can be directly bound from the cytosol to mitochondria or via the ER surface. The ER-bound Djp1 supports precursor targeting via the ER. Djp1 and the ER membrane protein Lam6 form contacts with Tom70. The ERMES components form another, independent ER-mitochondria contact site. (B) The ER-SURF substrate Oxa1 was expressed from a strong GAL promoter. Cells of the indicated strains were shifted from lactate medium to lactate medium that contains 0.5% galactose for 4 h. Whole cell extracts were analyzed by Western blotting. The precursor (pre) and mature (m) species of Oxa1 are indicated. (C) Schematic representation of an import reaction into semi-intact yeast cells (SICs). SICs maintain the intracellular architecture and maintain organellar structures and contacts. (D) Wild-type cells were converted to semi-intact cells (see Materials and Methods) or directly used for electron microscopy. In the central image, the mitochondrial outer membrane protein Por1 was labeled by immunogold staining and highlighted by red arrows. (E) Radiolabeled Oxa1 was synthesized in reticulocyte lysate in the presence of 35S methionine and incubated with semi-intact cells derived from the indicated strains. After 5 or 20 min, the cells were isolated, treated without or with proteinase K (PK) for 30 min on ice, and subjected to SDS-PAGE and autoradiography. 20% of the radioactive Oxa1 protein used per import reaction (time point) was loaded for comparison. (F) Radiolabeled Oxa1 was imported into isolated mitochondria and treated as described for (E). (G) Quantification of import experiments with semi-intact cells and mitochondria, respectively. Shown are the mean values and standard deviations of three biological replicates. Statistical difference was calculated with a student’s t-test. ns non significant, *p value <0.05. (H) Schematic overview of the Chimera tether (Kornmann et al, 2009). The transmembrane domain of Tom70 (residues 1–30) was fused to GFP and to the c-terminal tail anchor sequence of Ubc6 (residues 233–250). (I) Indicated cells expressing Chimera or carrying an empty vector were converted to semi-intact cells and used for an import experiment equivalent to that described for (E). Please note that the expression of the tether did not suppress the import defect in the double mutant. Source data are available online for this figure.
Figure 2
Figure 2. A Mdm34 depletion model to study the function of ERMES in protein biogenesis.
(A) Schematic representation of the MDM34 depletion by CRISPR interference (CRISPRi) (Smith et al, 2016). ATc-induced inhibition of the Tet repressor leads to the expression of a gRNA that recruits the dCas9-Mxi1 fusion to the MDM34 promoter, thereby blocking transcription of the MDM34 gene. (B) A Mdm34-CRISPRi plasmid coding for the gRNA under Tet repressor control as well as for the dCas9-Mxi1 fusion, was transformed into wild-type cells. Cells were grown to the early log phase in a medium containing the indicated carbon sources (2% each) before 960 ng/ml ATc was added. The mRNA levels of MDM34 as well as control transcripts, were quantified by qPCR before and 4 h after ATc-induced repression. Shown are the mean values and standard deviations of three biological replicates. Since the depletion efficiency depends on gene repression and dilution of existing transcripts, the depletion was quicker on glucose, where cells grow more rapidly than on glycerol. (C, D) MDM34 expression was repressed in glucose-grown cultures of cells harboring a chromosomally tagged MDM34 allele for expression of an Mdm34 protein with a C-terminal hemagglutinin (HA) tag. The protein levels of Mdm34-HA and of control proteins were analyzed by Western blot and quantified. Panel D shows the mean values and standard deviations of three biological replicates. (E) Wild-type cells were transformed with the Mdm34-CRISPRi plasmid (or an empty plasmid control) and with a plasmid for the expression of a mitochondria-targeted NeonGreen protein (Lenhard et al, 2023). The cells were grown on agar pads that contain galactose as a carbon source to better visualize the mitochondrial network. The mitochondrial network was continuously analyzed in a wide field microscope using a Leica 100x objective in a Dmi8 Thunder Imager. Whereas the mitochondrial network was maintained in the control cells, the network collapsed in MDM34-depleted cells, similar to the spherical mitochondria described before for Δmdm34 strains (Dimmer et al, 2002). (F) The indicated strains were grown in galactose medium to log phase and used to inoculate cultures with the carbon sources indicated. Cells were grown at 30 °C under constant agitation. Cell growth was continuously monitored. The graphs show the mean values of three technical replicates. Source data are available online for this figure.
Figure 3
Figure 3. Depletion of ER-mitochondria contact sites leads to a specific reduction of inner membrane proteins.
(A) The ERMES complex and Tom70 connect the ER to mitochondria. Djp1 and Lam6 serve as ER-bound interactors of Tom70. Cells were grown in glucose-containing media and grown for 8 and 24 h in the presence of ATc. Afterward, samples were taken, cells were lysed, and the resulting lysate was analyzed via LC-MS/MS. (B) Cells of the indicated strains were grown to log phase in galactose medium before tenfold serial dilutions were dropped onto plates with the indicated carbon sources. (C) Scheme of the proteome analysis of cells before and after Mdm34-depletion in wild type and Δtom70 cells. (D) Principal component analysis of the data set. Please note, that depletion of Mdm34 induces a characteristic and consistent protein pattern of the cellular proteome. (E) Comparison of the proteomes of wild-type control and Mdm34-depleted cells 24 h after ATc addition. Mitochondrial proteins (Morgenstern et al, 2017) were indicated in blue. For the calculation of fold changes and p values, the limma package within the R programming language was used (Ritchie et al, 2015). (F) The violin plot shows the ratio of protein abundance (log2-fold enrichment scores) in control relative to Mdm34-depleted cells. Numbers below the different subclasses represent the number of proteins (n) within a given subclass. Boxes represent the data range from the first (Q1) to the third quartile (Q3), with the line in the middle representing the median. The minimum/maximum whisker values were calculated as Q1/Q3 ± 1.5 * interquartile range (IQR). Every data point outside is represented as a potential outlier in the form of a dot. Mitochondrial proteins, particularly those of the inner membrane, are significantly depleted. Statistical difference was calculated with a Kolmogorov–Smirnov test comparing the indicated subpopulations with all other proteins. The p values are shown as a measure of statistical significance. The source data for panels (E) and (F) are provided in Dataset EV1. Source data are available online for this figure.
Figure 4
Figure 4. Depletion of ER-mitochondria contact sites changes mitochondrial properties.
(A) Schematic representation of the workflow for the analysis of the proteomic analysis of mitochondrial fractions. Cells were grown in galactose-containing media, and the depletion of MDM34 was induced for 16 h before mitochondria were isolated. Subsequently, mitochondria were lysed and subjected to LC-MS/MS. (B) Proteins in these fractions were identified and quantified by mass spectrometry as described in the materials and methods. The relative intensities measured of proteins from mitochondria (Morgenstern et al, 2017), the ER, and the nucleus as well as of peroxisomes (Wiederhold et al, 2010) in the “mitochondria” fraction was quantified. Shown are mean values and standard deviations of three (Δtom70) and four (WT) biological replicates. The source data are provided in Dataset EV2. (C, D) Yeast cells were grown to log phase in galactose medium before 960 ng/ml ATc was added for 16 h. Cells were embedded, cut into thin slices, and visualized by transmission electron microscopy. Mitochondrial membranes are indicated in yellow and the number and relative area of mitochondria in the section was quantified from eight different cells per strain. Shown are the mean values and standard deviations of eight samples. Statistical difference was calculated with a student’s t-test. ***p value <0.005 M, mitochondria, N, nucleus, V, vacuole. (E) Cells of the indicated strains were grown on galactose in the presence of ATc for 16 h. Cells contained reporters for the gene expression under the control of the heat shock element (HSE), the proteasome-associated control element (PACE), or the pleiotropic drug response element (PDRE). Source data are available online for this figure.
Figure 5
Figure 5. Many inner membrane proteins accumulate on the ER in the absence of contact sites.
(A) Schematic representation of the affinity purification of ER and mitochondrial membranes. First, all indicated strains were grown in galactose-containing media, and the depletion of ERMES was induced for 16 h. Afterward, cells were subjected to a crude subcellular fractionation followed by an immunoprecipitation against the flag epitope. The obtained eluates were lysed and subjected to LC-MS/MS. (B, C) Volcano plots of proteomes of the affinity-purified fractions. All measurements are based on three biological replicates and were processed as described in Materials and Methods. For the calculation of fold changes and p values, the limma package within the R programming language was used (Ritchie et al, 2015). (D) Normalized signal intensities for specified proteins in either wild type or Mdm34-depleted cells for Tom20 or Rtn1 pulldowns. The source data for panels (BD) are provided in Dataset EV3; proteins of mitochondria (Morgenstern et al, 2017) and the ER (Wiederhold et al, 2010) were labeled according to previous publications. (E) Correlation plot showing the log2 fold changes of the ER vs mitochondria fractions from the Rtn1 and Tom20 affinity purification samples from wild type (x-axis) and Mdm34-depleted (y-axis) cells. Samples on the diagonal were unaffected by Mdm34 depletion, whereas samples in the area indicated by the dashed line were found to be enriched on the ER only upon knock-down of Mdm34. The names of these ERMES-dependent mitochondrial proteins are shown. (F) The hydrophobicity scores, based on the Kyte and Doolittle scales (Kyte and Doolittle, 1982), were calculated for 20-residue windows of mitochondrial and ER proteins. The highest value (i.e., the maximum peak of local hydrophobicity) was calculated and is shown for different compartments. Numbers below the different subclasses represent the number of proteins (n) within a given subclass. Boxes represent the data range from the first (Q1) to the third quartile (Q3), with the line in the middle representing the median. The minimum/maximum whisker values were calculated as Q1/Q3 ±1.5 * interquartile range (IQR). Every data point outside is represented as a potential outlier in the form of a dot. Please note that ER proteins tend to be more hydrophobic than mitochondrial proteins. Among the mitochondrial proteins, inner membrane proteins, particularly those dependent on the ER-SURF pathway, tend to show an increased hydrophobicity. ER-SURF-dependent proteins were defined as proteins which were shifted from the mitochondrial to the ER fraction (deviation from diagonal >0.5 and log2 (WT EV Mito/ER) >0) upon depletion of Mdm34 or deletion of Tom70. Statistical difference was calculated with a Kolmogorov–Smirnov test comparing the indicated subpopulations. The p values are shown as a measure of statistical significance. (G) Hydrophobicity profiles of several Mdm34-dependent inner membrane proteins. Hydrophobicity (Φ) scores were calculated from 20-residue windows (Kyte and Doolittle, 1982). Transmembrane domains (TMD) are highlighted. AA amino acid residues. Source data are available online for this figure.
Figure 6
Figure 6. The hydrophobicity of internal segments determines the ER-SURF-dependence.
(A) Radiolabeled precursor proteins were synthesized in reticulocyte lysate and incubated with semi-intact cells of the indicated strains. After 5 and 20 min, aliquots were taken before samples were treated with proteinase K (PK). Hsp60 is a hydrophilic matrix protein. Oxa1 contains five transmembrane segments. Cox5a is a single-spanning inner membrane protein. For Cox5a(Oxa1), the transmembrane domain of Cox5a was replaced by the second transmembrane domain of Oxa1. For Cox5aΔTM, the transmembrane domain was deleted so that the protein is now translocated into the matrix (Meier et al, 2005). (B) The experiment shown in A was repeated three times from independent semi-intact cell preparations (biological replicates) and the signals of the imported proteins in wild type and Mdm34-depleted ∆tom70 cells after 20 min of incubation were quantified. Shown are mean values and standard deviations. Statistical difference was calculated with a student’s t-test. ns non significant, *p value <0.05, **p value <0.01. (C) Radiolabeled Oxa1 precursor was incubated with semi-intact cells of wild type and Mdm34-HA expressing cells. After 5 min, cells were lysed. The extract was incubated with HA-specific antibodies coupled to protein A Sepharose beads. Beads were washed before bound proteins were eluted with sample buffer and subjected to SDS-PAGE. The total samples correspond to 25% of what is shown in the IP (immune precipitation) samples. (D, E) Oxa1 was expressed from a strong GAL promoter in the lactate-containing medium by the addition of 0.5% galactose for 4 h in the indicated mutants. Western blots with HA-specific antibodies showed signals for the precursor (pre) and mature (m) Oxa1 protein. Signals from three independent (biological) replicates were quantified. Mean values and standard deviations are shown. Statistical difference was calculated with a student’s t-test. Statistical significance was assigned as follows: *p value <0.05, **p value <0.01, ***p value <0.005. (F) Schematic representation of the ER-supported protein import into mitochondria. Proteins with hydrophobic patches show an increased tendency to associate with the ER surface, but can efficiently be passed on to the mitochondrial import machinery. For the productive protein transfer from the ER to mitochondria, the presence of the ER-mitochondria contact sites (ERMES and Tom70-Djp1/Lam6) are crucial. See discussion for details. Source data are available online for this figure.
Figure EV1
Figure EV1. The ERMES contact site is critical for protein targeting via ER-SURF.
(A, B) The protein levels of Djp1 and of control proteins in wild type, ∆djp1 and ∆mdm34 strains were analyzed by Western blotting and quantified. Panel B shows the mean values and standard deviations of three biological replicates. Statistical difference was calculated with a student’s t-test. Statistical significance was assigned as follows: ***p value <0.005. (C, D) Schematic representation of the Oxa1-Ura3 reporter assay. Normal import of this reporter leads to the depletion of Ura3 from the cytosol and uracil auxotrophy. Impaired import of this reporter restores uracil prototrophy and allows for growth on plates lacking uracil. Cells of the indicated strains were grown to log phase in glucose medium before tenfold serial dilutions were dropped onto plates containing or lacking uracil. (EG) Radiolabeled proteins were synthesized in reticulocyte lysate in the presence of 35S-methionine and incubated with semi-intact cells derived from the indicated strains. After 5 or 20 min, the cells were isolated, treated without or with proteinase K (PK) for 30 min on ice, and subjected to SDS-PAGE and autoradiography. 20% of the radioactive protein used per import reaction (time point) was loaded for comparison. Precursor and mature forms are indicated as pre and m. Source data are available online for this figure.
Figure EV2
Figure EV2. The deletion of ERMES contact sites lead to transient growth defects.
(A, B) The indicated strains were grown in galactose medium to log phase and used to inoculate cultures in glycerol media. Cells were grown at 30 °C under constant agitation. Cell growth was continuously monitored. Growth rates were determined by calculation of the slope of the curve in the log phase. The graphs show the mean values of three technical replicates. (C) Indicated strains were grown in galactose medium and expression of Mdm34 was suppressed by the addition of ATc for 16 h. Mitochondrial translation products were radiolabeled for 15 min with 35S-methionine in the presence of cycloheximide to inhibit cytosolic translation. Radiolabeled proteins were visualized by SDS-PAGE and autoradiography. (D) The indicated strains were grown in galactose medium to log phase and used to inoculate cultures in either glucose, galactose, or glycerol media containing varying concentrations of ATc. Cells were grown at 30 °C under constant agitation. Cell growth was continuously monitored. Source data are available online for this figure.
Figure EV3
Figure EV3. Loss of ERMES and Tom70 leaves a strong footprint on the mitochondrial proteome.
(A) Cells of the indicated strains were grown to log phase in galactose medium and depletion of Mdm34 was induced by the addition of 960 ng/ml of ATc before tenfold serial dilutions were dropped onto plates with the indicated carbon sources. (B) The whole-cell proteomes of wild type and Mdm34-depleted cells were measured and further analyzed by gene ontology (GO) enrichment. Proteins with smaller than −0.5 log2 fold change were used as target set and analyzed by using the GOrilla tool (http://cbl-gorilla.cs.technion.ac.il/) with all quantified proteins as background. The top results with a false discovery rate [FDR] <5% are shown. (C) Comparison of the proteomes of ∆tom70 and Mdm34-depleted cells 24 h after ATc addition. Mitochondrial proteins (Morgenstern et al, 2017) were indicated in blue. (D) The violin plot shows the ratio of protein abundance (log2-fold enrichment scores) in ∆tom70 relative to Mdm34-depleted cells. Numbers below the different subclasses represent the number of proteins (n) within a given subclass. Boxes represent the data range from the first (Q1) to the third quartile (Q3), with the line in the middle representing the median. The minimum/maximum whisker values were calculated as Q1/Q3 ± 1.5 * interquartile range (IQR). Every data point outside is represented as a potential outlier in the form of a dot. Mitochondrial proteins, particularly those of the inner membrane, are significantly depleted. Statistical difference was calculated with a Kolmogorov–Smirnov test comparing the indicated subpopulations with all other proteins. The p values are shown as a measure of statistical significance. Source data are available online for this figure.
Figure EV4
Figure EV4. Loss of ERMES strongly affects mitochondrial morphology.
(A) Yeast cells were grown to log phase in galactose medium before 960 ng/ml ATc was added for 16 h. Cells were embedded, cut into thin slices, and visualized by transmission electron microscopy. (B) The indicated strains expressing a matrix-targeted mNeonGreen (Su9-mNeonGreen) and an ER-targeted mScarlet (Scarlet-TA) were grown to log phase in galactose medium before 960 ng/ml ATc was added for 16 h. Afterwards, cells were harvested and imaged using a Leica Dmi8 Thunder imager. (C) Cells of the indicated strains were grown on galactose in the presence of ATc for 16 h. The induction of the unfolded protein response (UPR) was measured by qPCR based on HAC1 splicing. Wild-type strains treated for 1 h with either DTT or tunicamycin served as positive controls. Source data are available online for this figure.
Figure EV5
Figure EV5. Proteomic analysis of ERMES and Tom70-deficient cells identifies ER-SURF clients.
(A) Specific enrichment scores (difference in log2 fold change) for Tom20 and the ER proteins Sec63 and Rtn1 in the affinity-purified fractions were calculated to validate the selective recovery of the bait proteins. Data show mean values of three biological replicates. (B, C) Volcano plots of the proteomic data of the affinity-purified fractions. All measurements are based on three biological replicates and were processed as described in Materials and Methods. For the calculation of fold changes and p values, the limma package within the R programming language was used (Ritchie et al, 2015). (DF) Correlation plot showing the log2 fold changes of the ER vs mitochondria fractions from the Sec63 and Tom20 affinity purification samples from wild type (x-axis) and ∆tom70 (D), Mdm34-depleted (E), and ∆tom70 Mdm34-depleted (F) (y-axis) cells. Samples on the diagonal were unaffected by Mdm34 depletion, whereas samples in the area indicated by the dashed line were classified as putative ER-SURF clients. The names of these mitochondrial proteins are shown.

Similar articles

Cited by

References

    1. Araiso Y, Tsutsumi A, Qiu J, Imai K, Shiota T, Song J, Lindau C, Wenz LS, Sakaue H, Yunoki K, et al. Structure of the mitochondrial import gate reveals distinct preprotein paths. Nature. 2019;575:395–401. doi: 10.1038/s41586-019-1680-7. - DOI - PubMed
    1. Avendano-Monsalve MC, Ponce-Rojas JC, Funes S. From cytosol to mitochondria: the beginning of a protein journey. Biol Chem. 2020;401:645–661. doi: 10.1515/hsz-2020-0110. - DOI - PubMed
    1. Backes S, Bykov YS, Flohr T, Raschle M, Zhou J, Lenhard S, Kramer L, Muhlhaus T, Bibi C, Jann C, et al. The chaperone-binding activity of the mitochondrial surface receptor Tom70 protects the cytosol against mitoprotein-induced stress. Cell Rep. 2021;35:108936. doi: 10.1016/j.celrep.2021.108936. - DOI - PMC - PubMed
    1. Backes S, Hess S, Boos F, Woellhaf MW, Godel S, Jung M, Muhlhaus T, Herrmann JM. Tom70 enhances mitochondrial preprotein import efficiency by binding to internal targeting sequences. J Cell Biol. 2018;217:1369–1382. doi: 10.1083/jcb.201708044. - DOI - PMC - PubMed
    1. Becker J, Walter W, Yan W, Craig EA. Functional interaction of cytosolic hsp70 and a DnaJ-related protein, Ydj1p, in protein translocation in vivo. Mol Cell Biol. 1996;16:4378–4386. doi: 10.1128/MCB.16.8.4378. - DOI - PMC - PubMed

MeSH terms

Substances