. 2024 Apr 2;14(1):7690.
doi: 10.1038/s41598-024-56508-1.

Characterization of a putative orexin receptor in Ciona intestinalis sheds light on the evolution of the orexin/hypocretin system in chordates

Affiliations

Characterization of a putative orexin receptor in Ciona intestinalis sheds light on the evolution of the orexin/hypocretin system in chordates

Maiju K Rinne et al. Sci Rep. .

Abstract

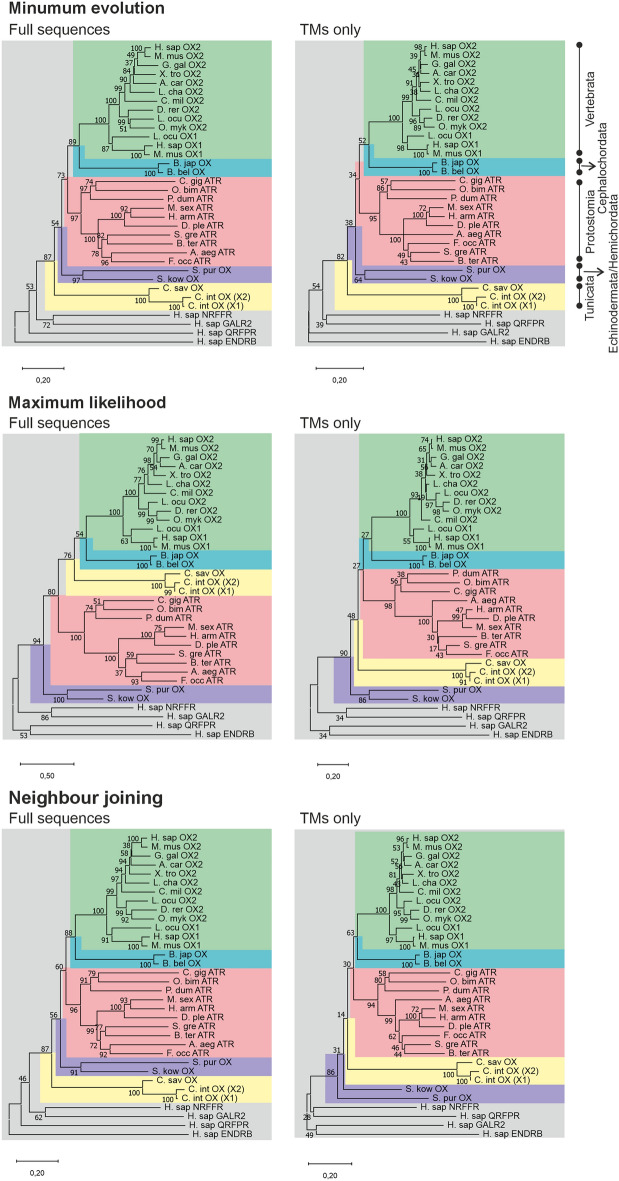
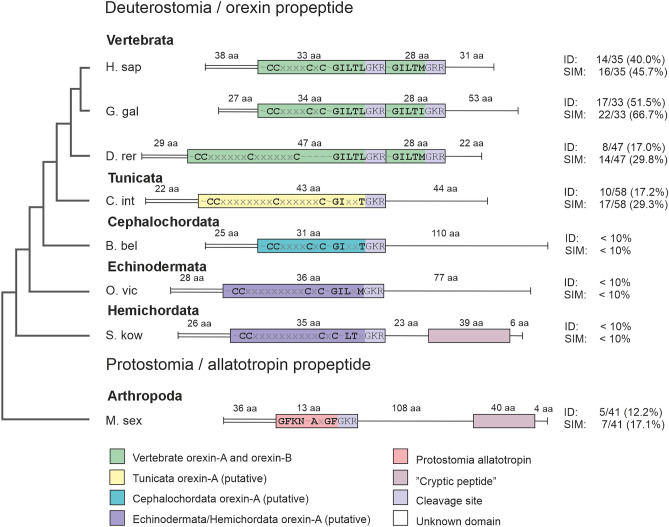
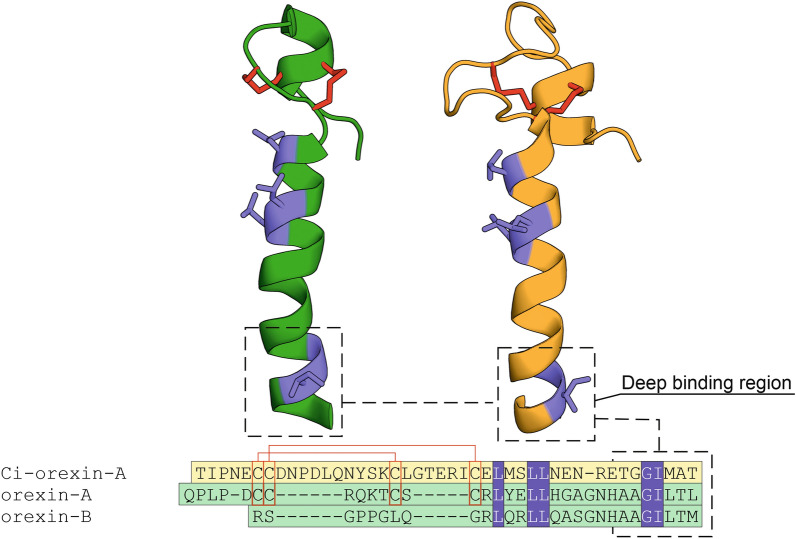
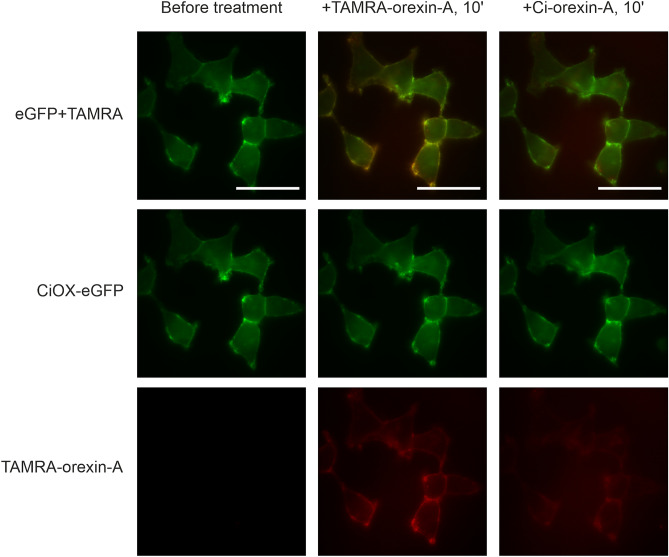
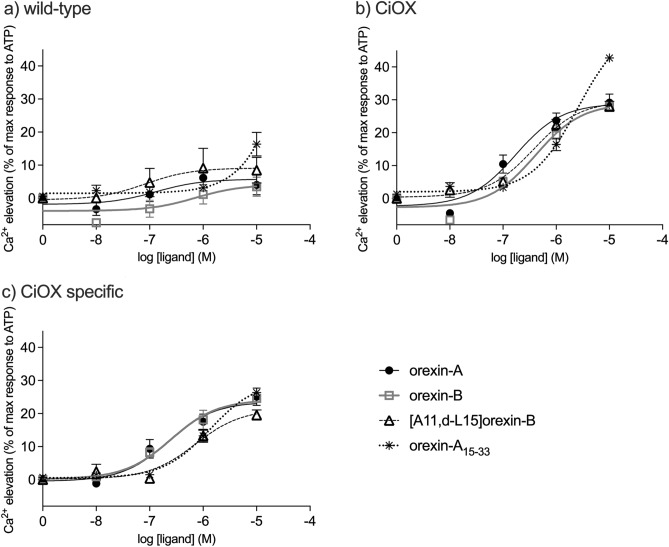
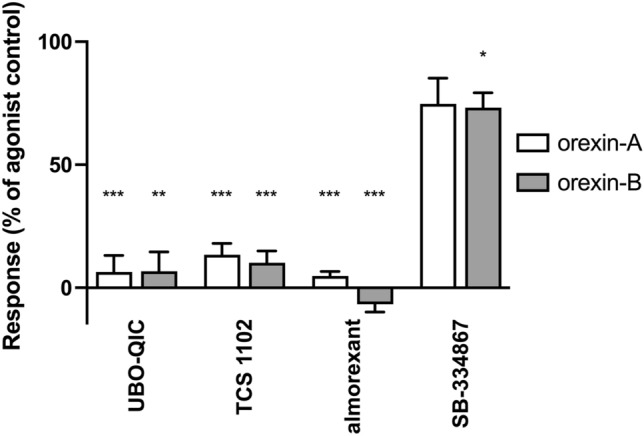
Tunicates are evolutionary model organisms bridging the gap between vertebrates and invertebrates. A genomic sequence in Ciona intestinalis (CiOX) shows high similarity to vertebrate orexin receptors and protostome allatotropin receptors (ATR). Here, molecular phylogeny suggested that CiOX is divergent from ATRs and human orexin receptors (hOX1/2). However, CiOX appears closer to hOX1/2 than to ATR both in terms of sequence percent identity and in its modelled binding cavity, as suggested by molecular modelling. CiOX was heterologously expressed in a recombinant HEK293 cell system. Human orexins weakly but concentration-dependently activated its Gq signalling (Ca2+ elevation), and the responses were inhibited by the non-selective orexin receptor antagonists TCS 1102 and almorexant, but only weakly by the OX1-selective antagonist SB-334867. Furthermore, the 5-/6-carboxytetramethylrhodamine (TAMRA)-labelled human orexin-A was able to bind to CiOX. Database mining was used to predict a potential endogenous C. intestinalis orexin peptide (Ci-orexin-A). Ci-orexin-A was able to displace TAMRA-orexin-A, but not to induce any calcium response at the CiOX. Consequently, we suggested that the orexin signalling system is conserved in Ciona intestinalis, although the relevant peptide-receptor interaction was not fully elucidated.

Keywords: Ciona intestinalis; Calcium; Hypocretin; Orexin; Receptor binding.


Conflict of interest statement

The authors declare no competing interests.

Figures

Figure 1
Figure 1
Phylogenetic analysis of putative Ciona orexin receptors based on amino acid sequences; for the species codes, see Supplementary Table S1, for the sequences used, see Supplementary Information 1, and for the alignments, see Supplementary Information 2–3. The CiOX gene encodes for two transcripts (X1 and X2), of which the X2 transcript isolated from C. intestinalis is used in this study. Trees were constructed based on either full sequences (left) or TMs only (right), with three different phylogenetic construction methods as indicated. Robustness was assessed with 500 × bootstrap method (values in % at the intersections of the branches). Green, vertebrate orexin receptors; turquoise, cephalochordate orexin receptors; pink, protostome ATRs; purple, echinoderms/hemichordates orexin receptors; and yellow tunicate orexin receptors. The tree is rooted (grey) with human sequences of NPFF1 (NPFFR), GAL2 (GALR2), QFR (QRFPR), and ETB (ENDRB) receptors.
Figure 2
Figure 2
Comparison of the receptor binding sites. (a) The determined binding sites of hOX2 (PDB code 5WQC (b) homology model of CiOX and (c) homology model of M. sexta ATR are shown from two points of view. The top row presents mainly the TM2 and TM7 and the bottom row mainly the TM3, ECL2, TM5 and TM6. Conserved residues between hOX2, CiOX and ATR are uncoloured sticks, otherwise in green (hOX2), light brown (CiOX) and coral (ATR). Yellow dashes indicate hydrogen bonds and salt bridges, while red dashes indicate long distance (4.0 Å) between the heavy atoms. Numbering according to the Ballesteros–Weinstein convention. (d) aligned protein sequences of hOX2, CiOX and ATR. Binding site residues in black boxes, conservation in gradient blue, residues involved in salt bridges in red letters, salt bridge connections in red numbers. Regions of the sequences not shown are indicated by blue vertical lines.
Figure 3
Figure 3
Prepro-orexin peptides from different species. For the species codes (Supplementary Table S1), the sequences used and the alignment (Supplementary Fig. S6), see Supplementary material 1. Left, a schematic presentation of the phylogenetic tree of the taxa shown. Boxes, coding/mature regions of the peptides (both orexin-A and -B in vertebrates and a single peptide in invertebrates and early vertebrates). Black lettering indicates conserved motives, ~ denotes region of length not specified here, x denotes region with a length specified here (number of x:s' = number of aa). Colour coding as in Fig. 1. Parallel horizontal double line, signalling peptide; vertical end of the line (prepro-peptide), stop. Right, percent identity (ID) and similarity (SIM) between orexin-A and orexin-B (vertebrates), orexin-A and the sequence directly downstream that would correspond to orexin-B (tunicates, cephalocordates, echinoderms), orexin-A and “cryptic peptide” (hemichordates), or allatotropin and “cryptic peptide” (protostome) within the individual species calculated by EMBOSS Needle, BLOSUM62 global alignment. Abbreviations: aa, amino acids.
Figure 4
Figure 4
Comparison of human and C. intestinalis orexin peptides. Left, an NMR solution structure of human orexin-A (dark green; PDB code: 1WSO); and right, a homology model of Ci-orexin-A (orange). Below, a sequence alignment of human orexin-B, orexin-A and Ci-orexin-A. Disulphide bridges are shown as red sticks in the models and red lines in the sequence alignment. Identical residues are represented as blue sticks and blue boxes. Alignment was manually revised to match cysteines in orexin-A and Ci-orexin-A.
Figure 5
Figure 5
Binding of TAMRA-orexin-A to the plasma membrane and displacement by Ci-orexin-A(1) in CiOX-eGFP cells. Left, the cells before additions; middle, the cells after a 10 min incubation with 10 nM TAMRA-orexin-A; right, the cells after a further 10 min incubation with 1 µM Ci-orexin-A(1). Scale bar = 50 µm.
Figure 6
Figure 6
Ca2+ responses to receptor stimulation. Concentration–response curves for orexin-A, orexin-B, [A11, d-L15]orexin-B and orexin-A15–33 in (a) wild-type and (b) CiOX-expressing cells. In (c), CiOX-specific response, obtained by subtracting the response in wild-type cells from the response in CiOX-expressing cells. Responses are presented as normalized to the maximum ATP (100 µM; 100%) response separately for each independent sample to allow comparison between cell types. Data presented as mean ± S.E.M. N = 3.
Figure 7
Figure 7
The sensitivity of the human endogenous orexin peptide (1 µM) -mediated Ca2+ responses to inhibitors (1 µM) in CiOX-expressing cells. The responses were normalized to the basal + inhibitor (0%) and the control agonist peptide response (in the absence of inhibitor; 100%) separately for each independent experiment before averaging. Data presented as mean ± S.E.M. N = 3–4. The significances are given in relation to the agonist control.
Figure 8
Figure 8
Comparison of the binding interactions of human and C. intestinalis orexin peptides. (a) Cryo-EM structure of human orexin-B (dark green) bound to hOX2 (light green) (PDB ID: 7L1U), (b) homology model of the putative binding mode of human orexin-A (dark green) to CiOX (bleak yellow), and (c) homology model of the putative binding mode of Ci-orexin-A (orange) to CiOX (bleak yellow). Binding site side chains conserved between hOX2 and CiOX are shown as uncoloured sticks. Residues not conserved are shown in light green (hOX2) and bleak yellow (CiOX). Residues conserved between human and C. intestinalis orexin peptides are shown as blue sticks.

References

    1. Kukkonen JP, Leonard CS. Orexin/hypocretin receptor signalling cascades. Br. J. Pharmacol. 2014;171:314–331. doi: 10.1111/bph.12324. - DOI - PMC - PubMed
    1. Inoue A, et al. Illuminating G-protein-coupling selectivity of GPCRs. Cell. 2019;177:1933–1947.e25. doi: 10.1016/j.cell.2019.04.044. - DOI - PMC - PubMed
    1. Avet C, et al. Effector membrane translocation biosensors reveal G protein and βarrestin coupling profiles of 100 therapeutically relevant GPCRs. Elife. 2022;11:e74101. doi: 10.7554/eLife.74101. - DOI - PMC - PubMed
    1. Scammell TE, Arrigoni E, Lipton JO. Neural circuitry of wakefulness and sleep. Neuron. 2017;93:747–765. doi: 10.1016/j.neuron.2017.01.014. - DOI - PMC - PubMed
    1. Kukkonen JP. Physiology of the orexinergic/hypocretinergic system: A revisit in 2012. Am. J. Physiol. Cell Physiol. 2013;304:C2–32. doi: 10.1152/ajpcell.00227.2012. - DOI - PubMed