. 2024 Jul;5(7):1102-1120.
doi: 10.1038/s43018-024-00754-9. Epub 2024 Apr 2.

Direct and selective pharmacological disruption of the YAP-TEAD interface by IAG933 inhibits Hippo-dependent and RAS-MAPK-altered cancers

Affiliations

Direct and selective pharmacological disruption of the YAP-TEAD interface by IAG933 inhibits Hippo-dependent and RAS-MAPK-altered cancers

Emilie A Chapeau et al. Nat Cancer. 2024 Jul.

Erratum in

Abstract

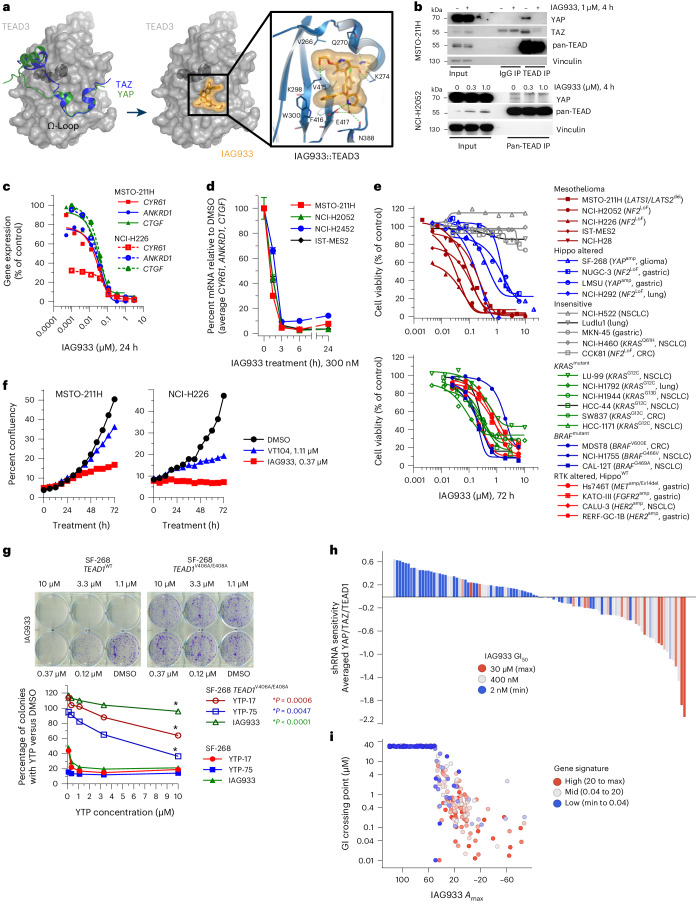
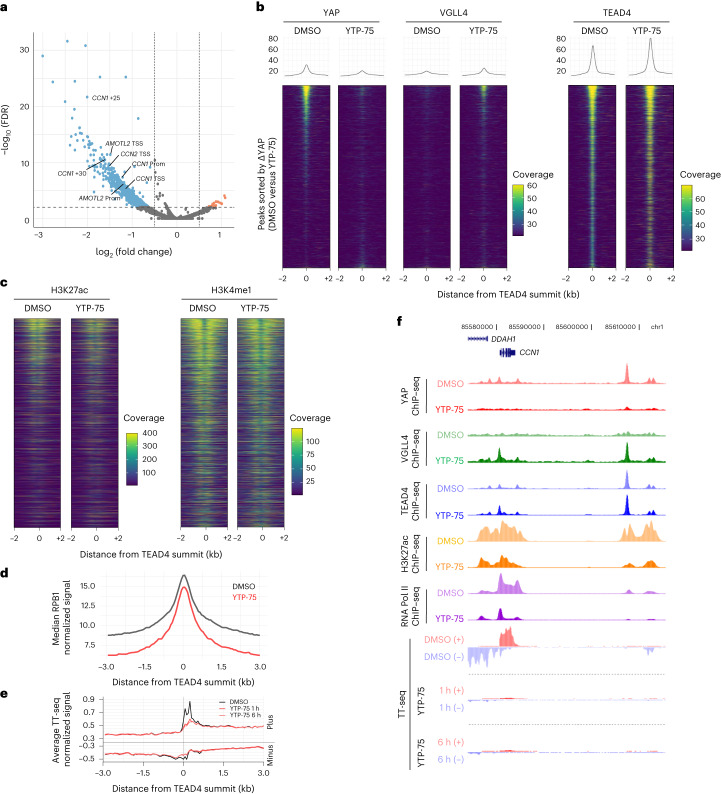
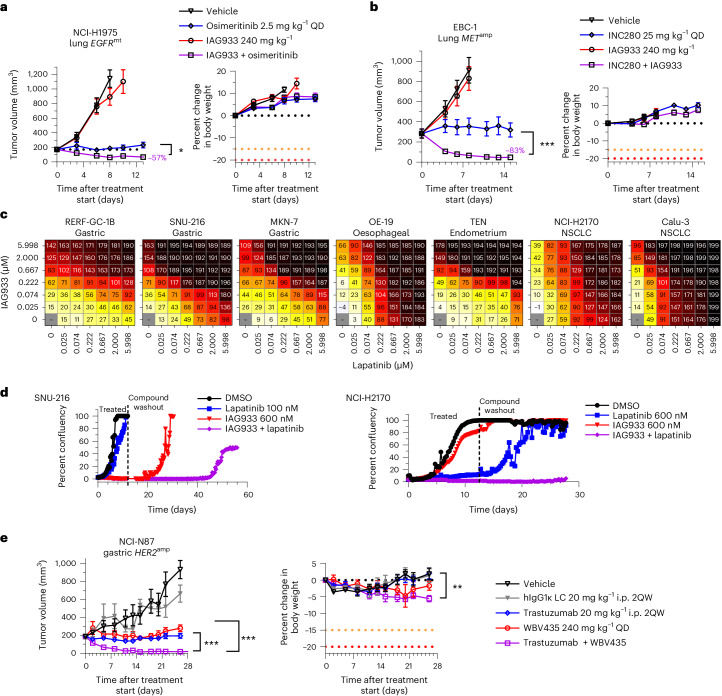
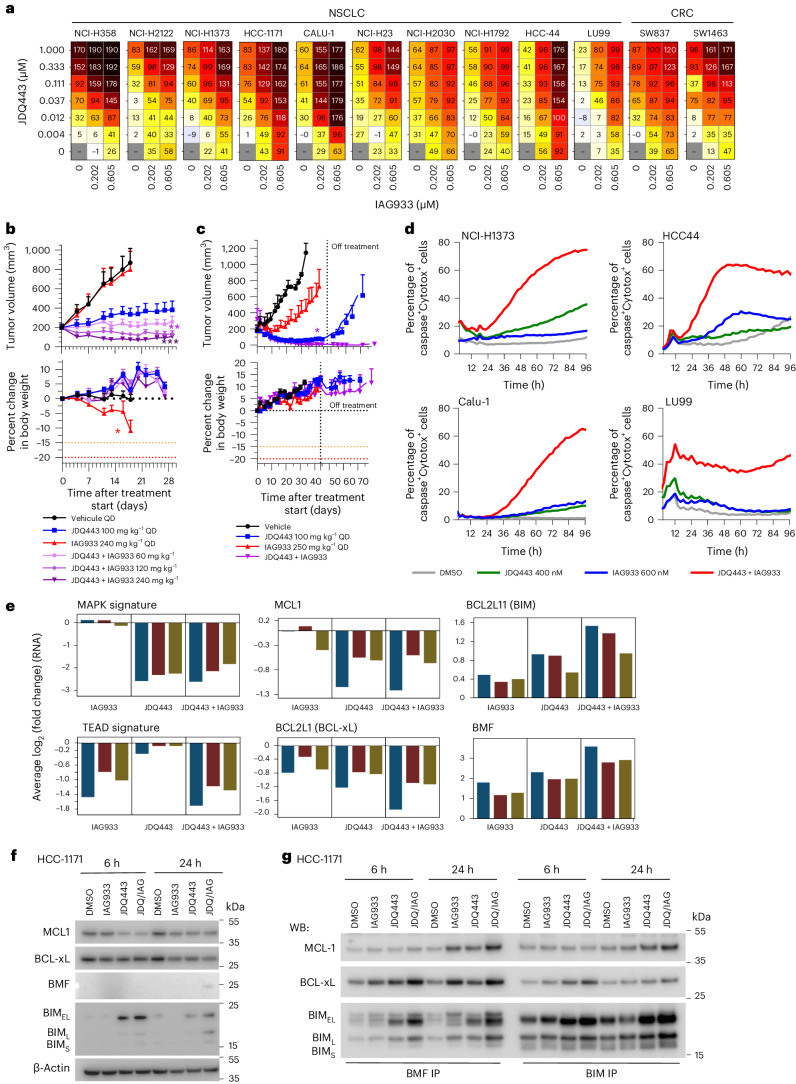
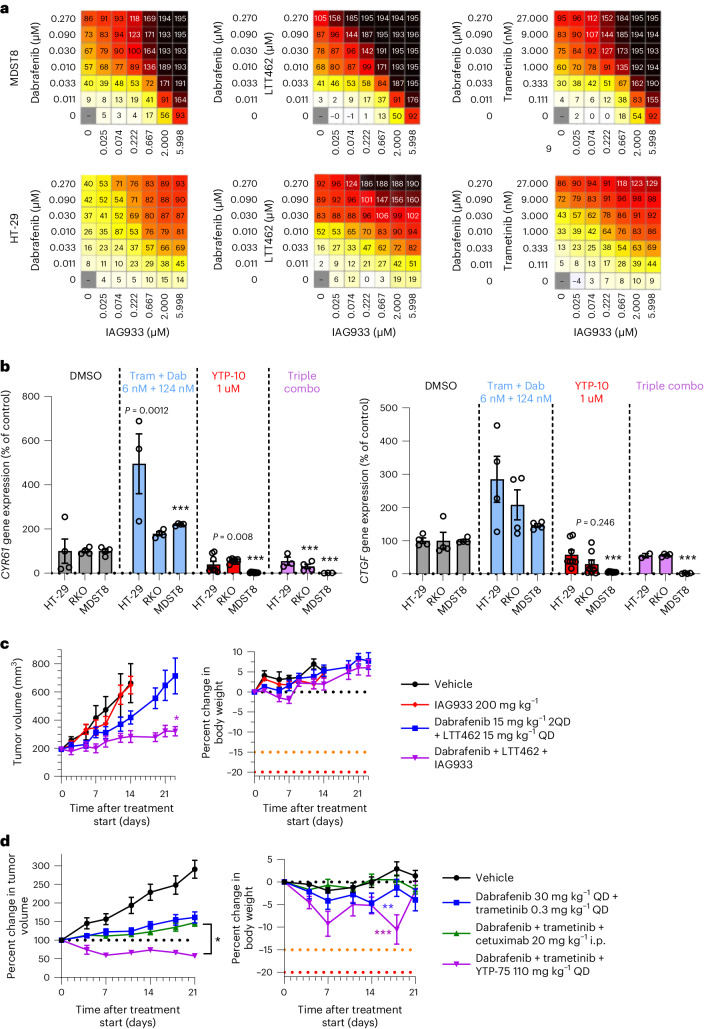
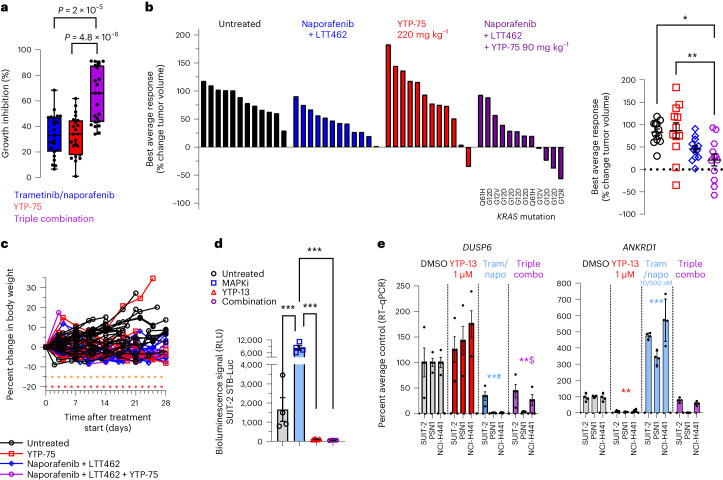
The YAP-TEAD protein-protein interaction mediates YAP oncogenic functions downstream of the Hippo pathway. To date, available YAP-TEAD pharmacologic agents bind into the lipid pocket of TEAD, targeting the interaction indirectly via allosteric changes. However, the consequences of a direct pharmacological disruption of the interface between YAP and TEADs remain largely unexplored. Here, we present IAG933 and its analogs as potent first-in-class and selective disruptors of the YAP-TEAD protein-protein interaction with suitable properties to enter clinical trials. Pharmacologic abrogation of the interaction with all four TEAD paralogs resulted in YAP eviction from chromatin and reduced Hippo-mediated transcription and induction of cell death. In vivo, deep tumor regression was observed in Hippo-driven mesothelioma xenografts at tolerated doses in animal models as well as in Hippo-altered cancer models outside mesothelioma. Importantly this also extended to larger tumor indications, such as lung, pancreatic and colorectal cancer, in combination with RTK, KRAS-mutant selective and MAPK inhibitors, leading to more efficacious and durable responses. Clinical evaluation of IAG933 is underway.


Conflict of interest statement

All authors are Novartis Pharma employees or were Novartis Pharma employees at the time of the studies.

Figures

Fig. 1
Fig. 1. Selective target modulation by YTPs in cellular systems.
a, Left, YAP and TAZ proteins mapped on the TEAD3 surface, as a result of structural alignments with the complex structures (PDB codes 5GN0, 5OAQ). The TEAD3 surface is shown in gray with the bound myristate in the buried LP drawn in dark gray. Middle/right, TEAD3–IAG933 cocrystal structure. Bound inhibitor is shown as a stick model with its surface in orange. IAG933 binds within the TEAD Ω-loop pocket to prevent coactivator binding by steric hindrance. The main hydrogen bonds and the salt bridge between protein, inhibitor and water are indicated with dotted green lines. b, Coimmunoprecipitation after a 4-h incubation of NCI-H2052 or MSTO-211H cells with DMSO (0 or –) or the indicated concentrations of IAG933 shows compound-induced inhibition of YAP and TAZ binding to TEAD isoforms. The blots are representative of two individual experiments; IP, immunoprecipitation. c, Dose-dependent inhibition of TEAD target gene expression in MSTO-211H and NCI-H226 cells treated for 24 h with IAG933. IC50 values are between 11 and 26 nM. d, TEAD target gene inhibition kinetics (mean ± s.e.m., n = 4 of the three genes combined) in four mesothelioma cell lines treated with 300 nM IAG933. e, Antiproliferative activity of IAG933 (72-h treatment) in a panel of mesothelioma, Hippo-altered, non-Hippo-mutated or insensitive cell lines. The GI50 in MSTO-211H cells was 73 nM. The results from one experiment or the mean of two experiments is shown; amp, amplification; Ex, exon; LoF, loss of function; WT, wild type. f, Real-time live-cell assessments of MSTO-211H and NCI-H226 cells treated with IAG933 or VT104; data show the mean of n = 2 replicates. g, Dose-dependent rescue of YTP activity in a CRISPR knock-in TEAD1V406A/E408A-mutant YTP-resistant clone of (YAP-amplified) SF-268 glioma cells. These TEAD1 residues correspond to V415 and E417 of the TEAD3 protein. Two-tailed paired t-test P values are included in the graph. h, Correlation of pharmacological and genetic sensitivity profiles in 103 cancer cell lines. Each bar represents one cell line. The y axis shows cell survival values of averaged shRNA drop-out profiles for YAP, TAZ (WWTR1) and TEAD1. Bar colors stratify GI50 for IAG933 (blue, maximum survival/refractory; red, minimum survival/sensitive). Data were analyzed by two-tailed Spearman correlation test between shRNA sensitivity and GI50; P < 0.0001. i, In vitro pharmacological sensitivity of 283 cancer cell lines to IAG933 (GI50 versus maximal response (Amax)). Color stratifies geometric mean expression of TEAD target genes CCN1, CCN2, ANKRD1 and AMOTL2. Data were analyzed by two-tailed Spearman correlation test between gene signature and Amax (P < 0.0001) or between gene signature and GI50 (P < 0.0001). Source data
Fig. 2
Fig. 2. YTPs evict YAP from TEAD-occupied sites to reduce transcription of Hippo target genes.
ad, MSTO-211H mesothelioma cells treated for 24 h with 250 nM YTP-75 or DMSO. The results of three independent experiments are presented. a, Volcano plot of differential chromatin binding of YAP (YTP-75 versus DMSO). Representative peaks assigned to canonical Hippo target genes are highlighted; TSS, transcription start site; Prom, promoter; +n, distance to closest transcription start site (kilobases). b, ChIP–seq signal heat maps showing occupancy of YAP, VGLL4 and TEAD4 in TEAD4 peaks. Heat maps are sorted according to YAP differential occupancy (YTP-75 versus DMSO). c, Heat maps of H3K27ac and H3K4me1 ChIP–seq signals, with a similar representation as in b. d, Metaplot of RPB1 ChIP–seq distribution on TEAD4 sites in cells after treatment with DMSO or YTP-75. e, Metaplot of stranded TT-seq signal at TEAD4 sites in MSTO-211H cells 1 or 6 h after treatment with 250 nM YTP-75 or DMSO. f, Representative genome browser snapshot of the CCN1 gene locus overlaying indicated ChIP–seq and TT-seq signals. Source data
Fig. 3
Fig. 3. IAG933 demonstrates rapid PD and robust antitumor activity in mouse and rat MSTO-211H xenograft models.
a, Inhibition of TEAD target gene expression in tumors after single-dose oral administration of IAG933. Data are shown as mean ± s.e.m.; n = 5 mice for vehicle and n = 3 mice for each dose per time point. Data were analyzed by one-way analysis of variance (ANOVA) using the results of all three target genes, treated versus vehicle, for all doses; ***P < 0.0001. Plasma, total blood and tumor exposures were quantified (mean of n = 3 mice); RT–qPCR, quantitative PCR with reverse transcription. b, Exposure-dependent inhibition of tumor target gene expression after single-dose oral administration of IAG933. In vivo IC50 values were calculated based on a 95% confidence interval for all genes, nonlinear fit to a simple logistic function. c, Kinetics of IAG933 bioluminescence inhibition in an in vivo reporter assay in mice bearing orthotopic pleural MSTO-211H tumors expressing firefly luciferase under the control of TEAD-responsive elements (MSTO-211H-STB-Luc cells). Data are shown as mean ± s.e.m.; n = 3 mice per group; BioL, bioluminescence; ROI, region of interest. d, Comparative dose-dependent effect on tumor volume and body weight of IAG933 and its close analog YTP-75 in orthotopic pleural MSTO-211H tumors. Body weight reduces when pleural tumor burden becomes excessive. Data are shown as mean ± s.e.m.; n = 3 mice per group. Data were analyzed by one-way ANOVA, treated versus vehicle, P < 0.0001 for treatment versus vehicle groups; RLU, relative light units; QD, once per day. e, Modulation of mRNA expression of antiapoptotic genes in tumors following administration of IAG933 in mice. Data are shown as mean ± s.e.m.; n = 3 mice per time point except n = 5 for the vehicle. Data were analyzed by one-way ANOVA with a Turkey’s multiple comparisons test (*P = 0.045, *#P = 0.0225, **#P = 0.006, **P = 0.0087 and ***P = 0.0002). f, Western blot analysis of proapoptotic protein expression in tumors after IAG933 dosing in mice. Data are shown as mean ± s.e.m.; n = 3 mice per time point. Quantifications were performed using images and a one-way ANOVA with a Turkey’s multiple comparisons test (*P = 0.0165, **P = 0.005, **$P = 0.041, ***#P < 0.001 and ***P = 0.0006). g, Antitumor efficacy and tolerability of IAG933 in a rat MSTO-211H xenograft model. Data are shown as mean ± s.e.m.; n = 5 rats per group. Data were analyzed by one-way ANOVA with a Tukey’s multiple comparison test (*P = 0.029 at 10 mg kg−1 and P < 0.0001 at 30 mg kg−1 versus vehicle groups). T/C, tumor control ratio. Source data
Fig. 4
Fig. 4. Antitumor efficacy in mesothelioma PDX and Hippo-altered non-mesothelioma models.
a, Endpoint tumor responses of nine mesothelioma PDX models treated with 240 mg kg−1 YTP-75 once daily for 14–21 days. Data are shown as mean ± s.e.m.; n = 4, 5 or 6 mice per group depending on the model. Data were analyzed by two-tailed unpaired t-test (*P = 0.014, **P = 0.002, **#P = 0.0001 and ***P < 0.0001). Gene expression levels and genetic alterations across models retrieved from the Charles River database are displayed on the bottom. b,c, Antitumor efficacy of IAG933 or YTP-75 and change in body weight in two NF2 loss-of-function mouse xenograft models of non-mesothelioma cancers. Data are shown as mean ± s.e.m. and were analyzed by two-tailed paired t-tests (**P = 0.001, *P = 0.0146 and *#P = 0.0397); n = 5 per group (5938-HX triple-negative breast ductal carcinoma PDX model; b) and n = 6 per group (NCI-H292 lung carcinoma CDX model; c). d, Dose-dependent inhibition of the CCN2 TEAD target gene by YTP-75 (24-h treatment) in NIH-3T3 cells stably expressing YAPMAML2 or TAZCAMTA1 fusion genes. Calculated IC50 values are between 82 and 292 nM. e, Dose-dependent antitumor efficacy and change in body weight of IAG933 in subcutaneous NIH-3T3 xenograft tumors expressing TAZ–CAMTA1. Data are shown as mean ± s.e.m. and were analyzed by one-way ANOVA; n = 6 per group; *P = 0.0252. Source data
Fig. 5
Fig. 5. IAG933 enhances responses to EGFR, MET and HER2 RTK inhibitors.
a,b, Tumor responses and body weight changes in mouse CDX lung cancer xenograft models. Data are shown as mean ± s.e.m. and were analyzed by one-way ANOVA; n = 6 per group (*P = 0.252 and ***P < 0.001). a, NCI-H1975 EGFR-mutant (EGFRmt) xenografts treated with osimertinib, IAG933 or both. b, EBC-1 MET-amplified (METamp) xenografts treated with capmatinib, IAG933 or both. c,d, IAG933 enhances HER2 inhibitor efficacy in HER2-amplified (HER2amp) tumor cell lines. c, Short-term (6-day) treatment matrices show IAG933 dose-dependent enhancement of lapatinib antiproliferative activity. Growth inhibition (%) is shown in relation to treatment start: 0–99%, delayed proliferation; 100%, growth arrest/stasis; 101–200%, reduction in cell number/cell death. Data are shown as the mean values of triplicates. d, Long-term lapatinib and IAG933 combination treatment in SNU-216 gastric cancer and NCI-H2170 NSCLC cells. Data are derived from live-cell imaging experiments and are presented as the mean values of duplicates. e, Antitumor responses and body weight changes of the mouse NCI-N87 HER2-amplified gastric cancer CDX model to vehicle (n = 4), IgG1 control (n = 4), trastuzumab (n = 7), YTP-75 (n = 7) or trastuzumab + YTP-75 (n = 7). Data are shown as mean ± s.e.m. and were analyzed by one-way ANOVA (**P = 0.076 and ***P < 0.0001); LC, light chain; i.p., intraperitoneal; 2QW, twice per week; hIgG1κ, human IgG1κ. Source data
Fig. 6
Fig. 6. Synergistic antitumor efficacy of JDQ443 + IAG933 in KRASG12C-mutated cancer models involves convergence of apoptotic regulators to induce cell death.
a, Cell viability dosing matrices (7 days) show a combination benefit for IAG933 and JDQ443 in a range of KRASG12C-mutated NSCLC and CRC cell lines. Data represent the mean values of triplicates. b,c, In vivo antitumor efficacy and tolerability of JDQ443 + IAG933 in the NCI-H2122 CDX (b; n = 6 per group) and 2094-HX PDX (c; n = 3 per group) NSCLC models (KRASG12C). Treatment was discontinued at day 45 for 2094-HX to assess tumor eradication. Data in b are shown as mean ± s.e.m. and were analyzed by one-way ANOVA comparing JDQ443 and combinations. Data in c are shown as mean ± s.e.m. and were analyzed by two-tailed paired t-test comparing JDQ443 and combinations. d, Kinetics of apoptotic cell death induction by IAG933 and JDQ443 in four cell lines by live-cell imaging assessing caspase activity and cell death. Data represent the mean values of triplicates. e, RNA-seq following treatment of NSCLC cell lines Calu1, HCC1171, NCI-H1373, NCI-H23 and HCC44 with JDQ443 (400 nM), IAG933 (600 nM) or both. The average log2 (fold change) versus vehicle control across all five lines is reported for the indicated expression signatures or individual gene. f,g, Apoptosis factors in HCC1171 cells treated with JDQ443 (400 nM), IAG933 (600 nM) or both. Total cell lysates were subjected to immunoblotting analysis in one replicate with the indicated antibodies (f) or were used for immunoprecipitation with either BMF or BIM before immunoblotting (g); JDQ/IAG, JDQ443 + IAG933; WB, western blot; BIM-EL, BIM extra long; BIM-L, BIM long; BIM-S, BIM short. Source data
Fig. 7
Fig. 7. IAG933 shows a combination benefit with dabrafenib and other MAPK inhibitors in BRAFV600E-mutated cancer models.
a, Antiproliferative activity dose matrices, 6-day readout; data represent the mean values of triplicates for IAG933 with dabrafenib, IAG933 with dabrafenib and LTT462 and IAG933 with dabrafenib and trametinib in HT-29 and MDST8 BRAFV600E-mutated CRC cells. b, CCN1 and CCN2 TEAD target gene expression in three cell lines after 24 h of treatment with dabrafenib (Dab) plus trametinib (Tram), YTP-10 or all three. Data are shown as mean ± s.e.m.; n = 4 for DMSO, n = 8 for YTP-10, n = 3 for dabrafenib/trametinib and n = 3 for the combination. Data were analyzed by one-way ANOVA, and comparisons to DMSO are shown (***P < 0.001; other P values are indicated on graphs). c, Antitumor efficacy of IAG933, dabrafenib + LTT462 or all three therapeutic agents combined in mouse HT-29 xenografts. Data are shown as mean ± s.e.m.; n = 5 per group. Data were analyzed by one-way ANOVA, and comparisons to the vehicle group are shown (*P = 0.0255). 2QD indicates twice daily. d, Antitumor efficacy of dabrafenib + trametinib ± cetuximab or YTP-75 in the 5238-HX mouse PDX model. Data are shown as mean ± s.e.m.; n = 10 for the vehicle group, n = 18 for the dabrafenib/trametinib group, n = 32 for the dabrafenib/trametinib + cetuximab group and n = 6 for the dabrafenib/trametinib + YTP-75 group. Data were analyzed by one-way ANOVA, and triple combinations were compared (*P = 0.083) or body weights were compared to the vehicle group (**P = 0.0471 and ***P < 0.0002). Source data
Fig. 8
Fig. 8. YTP blockade of MAPK pathway inhibitor-induced TEAD activation and increased antitumor response in pancreatic cancer models.
a, Pharmacological sensitivity profiles across a panel of 23 pancreatic cancer cell lines using trametinib (10 nM), naporafenib (1 µM) and YTP-75 (1 µM). Cells were treated for 72 h. Significance was determined using a two-sided Welch’s t-test from 23 independent experiments. A box plot with whiskers extending to minimum and maximum is represented with individual data points. b, Best average responses (waterfall and scatter plots) in a panel of 12 non-KRASG12C-mutated pancreatic cancer mouse PDX models treated with naporafenib (50 mg kg−1 twice daily) + LTT462 (15 mg kg−1 once daily), single-agent YTP-75 (220 mg kg−1 once daily) or naporafenib + LTT462 + YTP-75 (90 mg kg−1 once daily) in a 1 × 1 × 1 format (1 mouse × 1 model × 1 treatment). Significance was determined by a one-way ANOVA with a Tukey’s multiplicity adjustment and is represented on the scatter plot; *P = 0.0045 and **P = 0.0024. c, Good tolerability of the treatments reflected by body weight monitoring of animals implanted with 12 non-KRASG12C-mutated pancreatic cancer mouse PDX models. d, TEAD activity in vitro reflected by the SUIT-2 STB-Luciferase cell bioluminescence reporter assay; data are shown as mean ± s.d.; n = 4 replicates after 48 h of treatment with naporafenib (500 nM) + trametinib (10 nM), YTP-13 (1 μM) or all three. Significance was determined by a one-way ANOVA with a Tukey’s multiplicity adjustment (***P < 0.0001); MAPKi, MAPK inhibitor. e, DUSP6 and ANKRD1 gene expression; data are shown as mean ± s.d.; n = 4 replicates in three cell lines treated for 48 h with naporafenib (500 nM) + trametinib (10 nM; Tram/napo), YTP-13 (1 μM) or all three. Data were analyzed by one-way ANOVA for all three cell lines, and comparisons to DMSO are shown (**#P = 0.002, **$P = 0.0051, **P = 0.0072 and ***P = 0.0005). Source data
Extended Data Fig. 1
Extended Data Fig. 1. Crystallographic and biochemical characterization of dihydrobenzofuran YTP compounds.
a, The initial unbiased difference electron density map contoured at 3.5σ within the Ω-loop pocket for all four protein chains within the asymmetric unit. The final refined inhibitor models are superimposed as ball-and-stick representation in yellow for protein chain A, in brown for protein chain B, in blue for protein chain C and in green for protein chain D. All four complexes from the asymmetric unit superimpose well, especially around the binding site of IAG933 (bottom panel, residues of TEAD3 are labelled). Only subtle conformational changes for a few side chains are observed. b, Crystallographic data collection and refinement statistics. c, IAG933 structure represented in 2D. d,e, Surface plasmon resonance. The four N-biotinylated avi-tagged TEAD proteins were immobilized on sensor chips and the binding of YTPs was measured at 298°K. d, Representative sensorgrams are shown for YTP-32. The data were globally fitted with a 1:1 interaction model to determine the dissociation constants (Kd) measured at equilibrium. e, The SPR values are represented as the mean ± SD of n = 2 experiments. f, 2D chemical structures of the two compounds used in the SPR assay. Source data
Extended Data Fig. 2
Extended Data Fig. 2. Biochemical and cellular activities of YTPs and allosteric TEAD inhibitors.
a, Results from biochemical and 72 h cell proliferation assays. Biochemical IC50’s have been obtained from a TR-FRET assay. Values represent the mean ± SD of n ≥ 2 experiments as indicated in the table. The values for YTP-3, YTP-3a, YTP-10 and YTP-17 were previously reported,. All the compounds targeting the TEAD lipid-pocket are inactive in TR-FRET because the TEAD4 protein used in this assay is fully acylated. Resazurin 72 h cell proliferation assays were performed in three cell lines for YTP compounds and indicated lipid-pocket binders. SF-268 (MCAT engineered line) is a YAP-amplified, TEAD-dependent glioma cell line, NCI-H2052 (MCAT engineered line) is a NF2-mutant, highly TEAD-dependent mesothelioma cell line, and MKN-45 is a YAP-deleted and TEAD-insensitive gastric cell line (negative control). GI50’s are represented as geometric mean and SD. b, Coimmunoprecipitation with MSTO-211H cell lysate shows dose-dependent YAP-TEADs disruption with YTPs. Left panel: After 20 h incubation with DMSO (-) or 250 nM YTP-75 (+). Right panel: After 4 h incubation with DMSO (0) or increasing doses of IAG933. The blots are representative of at least two repeats. c, Concentration-dependent antiproliferative effect of YTP-75 and TEAD lipid-binders VT104 and K-975. The number of viable NCI-H2052 cells following a 72 h incubation with the indicated compounds was quantified by resazurin assay. Values are mean of two independent experiments. Half-maximal growth inhibition is indicated by a dashed line. d, Real-time live cell measurements were performed over 6 days with the live-cell analysis system Incucyte in three indicated mesothelioma cell line models with a range of dose levels for IAG933 or the TEAD allosteric lipid pocket (LP) binders VT104 and K-975. All compounds displayed antiproliferative effects in long-term assays. MSTO-211H is a cell line with LATS1/2 deletion, NCI-H2052 and NCI-H226 are cell lines with NF2-inactivation. Mean of duplicates, or triplicates for DMSO, one-way ANOVA test were run for each cell line and each compound at concentration of 370 nM, as indicated in the table below the graphs. Source data
Extended Data Fig. 3
Extended Data Fig. 3. Cellular activity and selectivity.
a, Time-dependent effect in quantitative measurements of TEAD target gene expression in cultured mesothelioma cell lines MSTO-211H, NCI-H2052, NCI-H2452, and IST-MES2, with IAG933 PPI inhibitor and VT104 TEAD allosteric inhibitor. Data shown for four replicates, Mean ± SD. Two-tailed paired t test VT-104 [1.2 µM]” vs. “IAG933 [300 nM] using the results from all 3 genes: **p = 0.0002, ***$, p = 0.0001***, p < 0.0001 for each cell line. b-f, Transcriptional modulation induced byIAG933 in cell lines from non-human species shows a similar range of activity after 24 h treatment. b, human, c, dog, d, rat, e, mouse cell lines were subjected to in vitro treatment with a concentration range of IAG933 for 16 h. mRNA levels of three YAP/TEAD target genes (CYR61, ANKRD1 and CTGF), expressed as relative percentages vs the vehicle control (DMSO), are represented on the y-axis versus tested concentrations of IAG933 (μM) on the log-scaled x-axis. In some cell lines, one of the TEAD target genes could not be detected. f, Lists of the mean IC50 values (n = 2–4) of IAG933, calculated using Fit models (203) from XLFit (Microsoft). g, Right: characterization of the SF-268 cell clones derived from lentivirus infection with a TEAD1 WT or TEAD1V406A/E408A mutant. The sensitivity to IAG933 is impaired in the mutant clone. Mean ± SD, results of 6 individual experiments. Left: Rescue experiments that demonstrate TEAD-selectivity of IAG933 and YTPs in a colony formation assay. Cell colonies obtained using CRISPR knock-in engineered clones of the SF-268 YAP-amplified glioma cell line assess the rescue of YTP effects. This cell line mainly expresses and depends on the TEAD1 isoform. Wild-type and TEAD1V406A/E408A mutant clones were treated with indicated doses of IAG933, YTP-17, or YTP-75. The picture is representative of 3 individual experiments. Source data
Extended Data Fig. 4
Extended Data Fig. 4. Compound effects on sub-cellular localization of YAP1 and transcriptional changes.
a, Correlation analysis of RNA-seq results NCI-H2052 cell viability when treated with YTP-75 for 24 hr or subjected to YAP shRNA knockdown. R2 indicates the coefficient of determination of the linear model used for regression analysis. The results of 3 independent experiments are presented. b, Immunofluorescence microscopy shows nuclear/cytoplasmic localization of YAP1 and TEAD in the presence of 0.1% DMSO or 500 nM of YTP-75. NCI-H2052 cells were incubated for 4 h before immunofluorescence staining was performed. Nuclei were stained with Hoechst 33342. Size bar indicates 50 μm. The picture is representative of 3 individual experiments. c, Volcano plots representing gene expression changes based on RNA-Seq analyses of MSTO-211H cells treated with 250 nM of YTP-75 for 6 h or 24 h. p-values obtained by a two-sided Wald test were corrected for multiple testing using the Benjamini and Hochberg method. d, Summary table of the gene functional annotation analysis performed on genes differentially expressed based on the RNA-seq results. Two-sided hypergeometric test p values with Benjamini–Hochberg multiple-testing adjustment are shown. Source data
Extended Data Fig. 5
Extended Data Fig. 5. PK/PD/efficacy relationships of TEAD inhibitors in mesothelioma mouse subcutaneous xenografts.
a, Kinetics of inhibition of TEAD target genes expression in MSTO-211H subcutaneous tumors after single administration of YTP-75 at indicated doses. Mean ± SEM, n = 4 mice for vehicle group, n = 3 mice for each treatment point. One-way ANOVA test using the results of all three target genes, treated vs untreated, p < 0.0001***. Total blood and tumor exposures of YTP-75 were measured in three animals. b, TEAD target gene expression- in MSTO-211H tumors 24 h after single-dose administration of YTP-75 at four dose levels. n = 4 mice for vehicle, n = 3 mice for each treatment point. c, TEAD-related pharmacodynamics of IAG933 and TEAD allosteric lipid pocket (LP) binders VT104 and K-975 in NCI-H226 mesothelioma murine xenografts. The inhibition kinetics of TEAD target gene expression was assessed by RT-qPCR after administration of three daily doses of compounds. Plasma, total blood and tumor exposures are displayed. Mean ± SEM, n = 3 mice per point. d, Comparative dose-dependent antitumor effect of IAG933 and its close analog YTP-75 in subcutaneous MSTO-211H xenografts. Three experiments are shown on the graph. Percentage change of tumor volume and body weight from first day of treatment are shown. Mean ± SEM, n = 5 mice per group, except for IAG933 240 mg/kg for which only two animals were used. e, PK parameters in mice for IAG933 showing linear PK and no compound accumulation at 60 mg/kg at the indicated number of days. (d.n. dose-normalized). Mean values are shown. f, Correlation (Pearson r) between pharmacokinetic (PK) parameters and antitumor responses following two weeks of YTP-75 treatment. The data were collected from five distinct pharmacology studies conducted in Nude mice with MSTO-211H subcutaneous xenograft tumors. The mice were treated either daily (QD), twice daily (2QD), or via continuous infusion using minipump delivery. The utilization of a twice daily dosing schedule or continuous infusion enabled the assessment of the correlation between antitumor efficacy and PK parameters. Source data
Extended Data Fig. 6
Extended Data Fig. 6. In vivo evaluation of pro-apoptotic protein expression, cell apoptosis and proliferation in mesothelioma tumors.
a, Evaluation of changes in protein expression in MSTO-211H xenograft tumors after administration of a single dose of IAG933 at 30 and 240 mg/kg. Western-blots detected cleaved PARP and BIM proteins, Vinculin was used as loading control. This blot is representative of 2 individual experiments. b, Immunohistochemistry changes following treatment of NCI-H2052 xenograft tumors with three daily doses of YTP-13. Representative panels are shown for Ki-67, cleaved PARP and cleaved CASP3. Mean and SEM are shown, n = 3 per point. Source data
Extended Data Fig. 7
Extended Data Fig. 7. Exposure-response relationships of IAG933 in a MSTO-211H mesothelioma rat xenograft model, and YTP-75 antitumor efficacy in mouse mesothelioma PDX models.
a-d, The MSTO-211H subcutaneous xenograft model was developed in irradiated Nude rats. Following cell implantation, measurable tumors developed in all animals. a, Exposure-dependent inhibition of the expression of three TEAD target genes in MSTO-211H tumors after single-dose administration of IAG933 in rats. Mean ± SEM; n = 3 rats per point. b, Correlation of IAG933 blood concentration with TEAD target gene expression in MSTO-211H tumors after single-dose IAG933 administration. In vivo IC50 and IC90 were calculated based on a 95% confidence interval for all genes (fit to a simple logistic function). c, PK parameters in rats for IAG933 showing linear PK and no compound accumulation at 30 mg/kg at the indicated number of days. One-way ANOVA test results are shown for the comparison of Day 5 AUC24h values. Mean ± SEM; n = 5 rats per group, except for the Day1 30 mg/kg group: n = 3. d, Comparative representation of antitumor efficacy in MSTO-211H xenograft models of mice and rats. Daily administration of IAG933 at specified doses was employed. By overlaying the anti-tumor response curves from mice and rats in 2-week experiments, corresponding doses for tumor near-stasis (10 mg/kg QD for rats vs. 20 mg/kg QD for mice) and near-complete regression (30 mg/kg QD for rats vs. 240 mg/kg QD for mice) could be determined. Mean ± SEM; n = 5 animals per group, except for the IAG933 240 mg/kg, n = 2 mice. e, YTP-75 was administered at 240 mg/kg daily in PDX models from Charles River. Only PDX models sensitive to treatment are shown here; two which did not respond are not represented. All treatments were well tolerated. Mean ± SEM; n = 4, 5, or 6 mice per group depending on the PDX models. Two-tailed paired t test results are shown for the comparison of vehicle vs. YTP-75-treated for each PDX model, significant p values are indicated in the graphs. Source data
Extended Data Fig. 8
Extended Data Fig. 8. NIH-3T3 engineered cell line models transformed with YAP1 or TAZ fusion genes show sensitivity to IAG933 or YTP-75.
The NIH-3T3 cell line was transformed with the YAP-MAML2, TAZ-CAMTA1, or YAP1 genes. Lentivirus infection allowed for stable integration of the construct. a, Western-blot analysis with V5, YAP1 or GAPDH antibodies, showing expression of the exogenous proteins. This blot is representative of 3 individual experiments. b, Cellular activity of YTP-75 represented by effects on cell viability after a 7-day treatment in NIH-3T3 cells expressing indicated genes. GI50’s were calculated from two independent experiments. Source data
Extended Data Fig. 9
Extended Data Fig. 9. Effects of JDQ443 + IAG933 combination treatment on KRASG12C-mutated NSCLC models.
a, The maximal antiproliferative effect (Amax) was determined for JDQ443 with (x-axis) and without (y-axis) the indicated combination partner using a 7-day assay (CellTiter-Glo). Cell lines falling in the blue-shaded quadrant were those where a given combination was more inhibitory than JDQ443 alone. For each cell line indicated, the Amax was derived from a titration of JDQ443 (from 1.6 µM) with a fixed dose of other inhibitors. Results of 12 different cell lines are shown. b, Live-cell confluency was measured over 30 days using an Incucyte device with 3 cell lines treated as indicated. Mean of duplicates for HCC44, and 5 replicates for NCI-H2122 and NCI-H358. c, In vivo anti-tumor efficacy and body weight monitoring in the NCI-H2122 KRASG12C-mutated NSCLC CDX model. Treatments were given until day 21. Mean ± SEM; n = 7 per group, One-way ANOVA, Tukey’s multiple comparisons test, show significant differences for JDQ443 vs. JDQ443/IAG933 **p = 0.0007, and JDQ443/TNO155 vs. JDQ443/TNO155/IAG933, ***p < 0.0001. d, Cultured NCI-H1792, NCI-H1373 and Calu1 KRASG12C-mutated NSCLC cells were treated as indicated for 6 h and 24 h. Total cell lysates were prepared and subjected to immunoblot analysis with the indicated antibodies. Some blots were partially shown in a previous report. Each experiment was performed once and repeated in several cell lines. e, Cultured KRASG12C-mutated NSCLC cell lines were treated with JDQ443 400 nM and IAG933 600 nM alone or in combination for 6 h and 24 h. Total cell lysates were prepared and subjected to immunoblot analysis with the indicated antibodies. Each experiment was performed once and repeated in several cell lines. Source data
Extended Data Fig. 10
Extended Data Fig. 10. IAG933 improves the antiproliferative activity of the KRASG12D mutant-specific inhibitor MRTX1133 in KRASG12D-dependent pancreatic and colorectal cancer cells, and prevents MRTX1133-induced TEAD activation.
a, Antiproliferation dose matrices of MRTX1133 and IAG933 combinations in 8 different PDAC cell lines in 6-day assays. Mean of three experiments is shown. b, Combinations of IAG933 (600 nM), and MRTX1133 (40 nM) in extended cancer cell culture assays (Incucyte). Mean of n = 2 (AsPC-1, GP2D) or n = 3 independent experiments (HPAF-II), Mean ± SEM. c, MAPK pathway (DUSP6) and TEAD reporter gene expression in HPAF-II PDAC cells treated with IAG933, MRTX1133, or both, for 48 h (mean n = 3 biological replicates) shows IAG933 abrogation of MRTX1133-induced TEAD activity. Mean ± SD. One-way ANOVA test results are shown for the comparison vs. DMSO control values, p values are indicated on the graph. Source data

References

    1. Currey, L., Thor, S. & Piper, M. TEAD family transcription factors in development and disease. Development148, dev196675 (2021). - PubMed
    1. Johnson, R. & Halder, G. The two faces of Hippo: targeting the Hippo pathway for regenerative medicine and cancer treatment. Nat. Rev. Drug Discov.13, 63–79 (2014). - PMC - PubMed
    1. Cao, L., Yao, M., Sasano, H., Sun, P. L. & Gao, H. YAP increases response to trastuzumab in HER2-positive breast cancer by enhancing P73-induced apoptosis. J. Cancer11, 6748–6759 (2020). - PMC - PubMed
    1. Cunningham, R. & Hansen, C. G. The Hippo pathway in cancer: YAP/TAZ and TEAD as therapeutic targets in cancer. Clin. Sci.136, 197–222 (2022). - PMC - PubMed
    1. Kapoor, A. et al. YAP1 activation enables bypass of oncogenic KRAS addiction in pancreatic cancer. Cell158, 185–197 (2014). - PMC - PubMed

MeSH terms

LinkOut - more resources