. 2024 May;6(5):861-879.
doi: 10.1038/s42255-024-01025-8. Epub 2024 Apr 2.

A spatiotemporal proteomic map of human adipogenesis

Affiliations

A spatiotemporal proteomic map of human adipogenesis

Felix Klingelhuber et al. Nat Metab. 2024 May.

Abstract

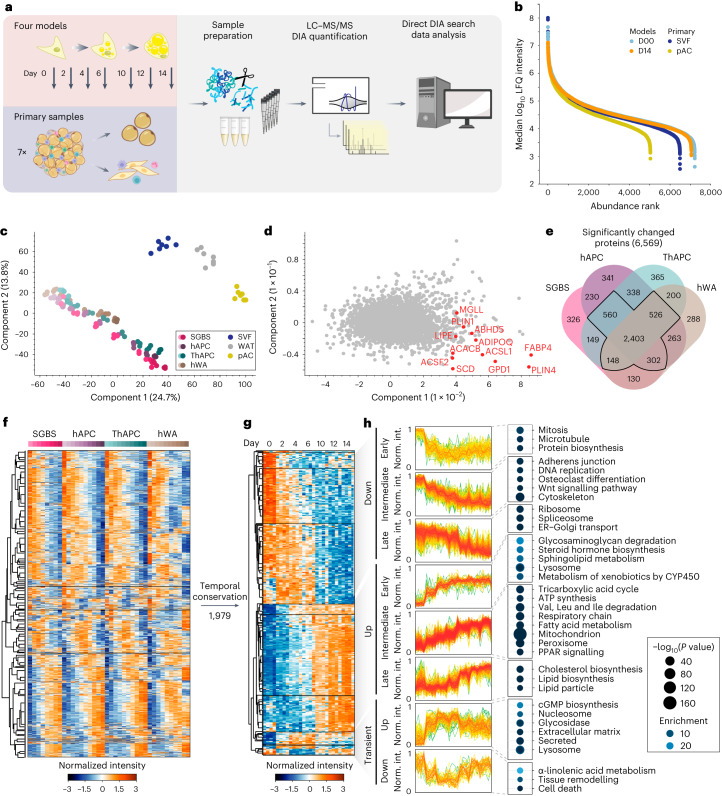
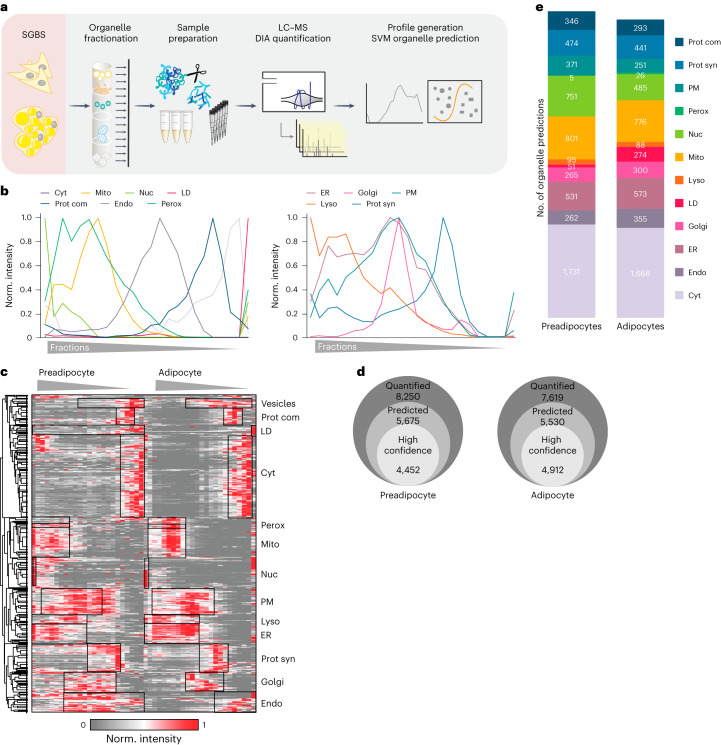
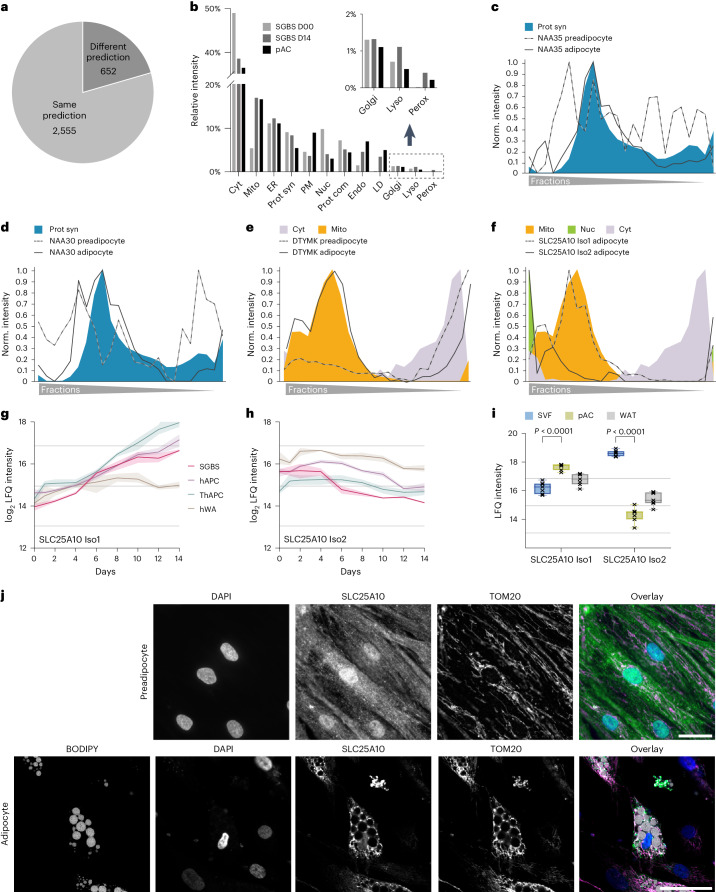
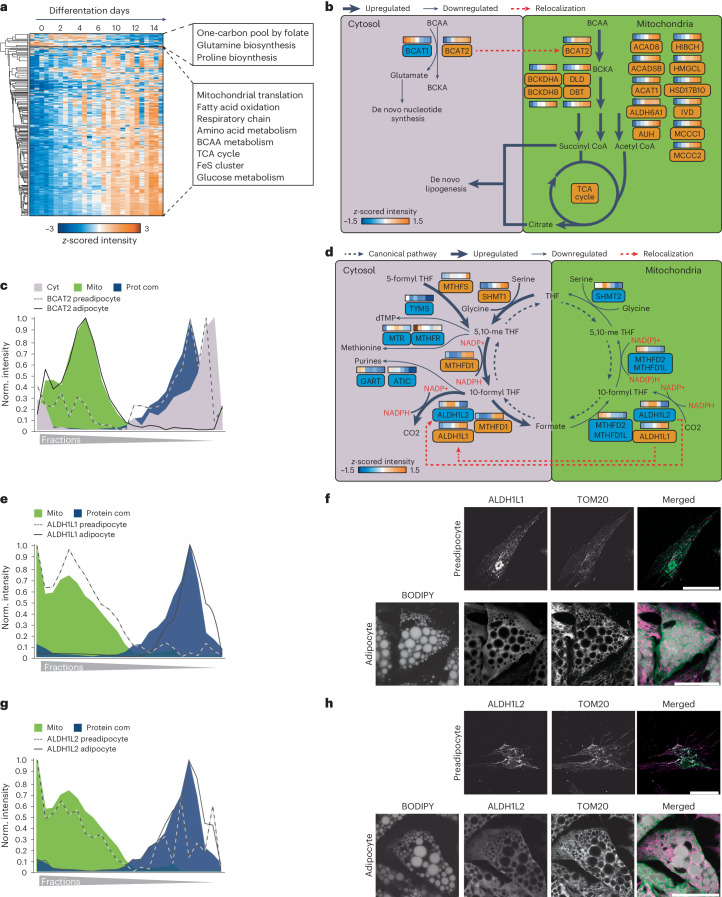
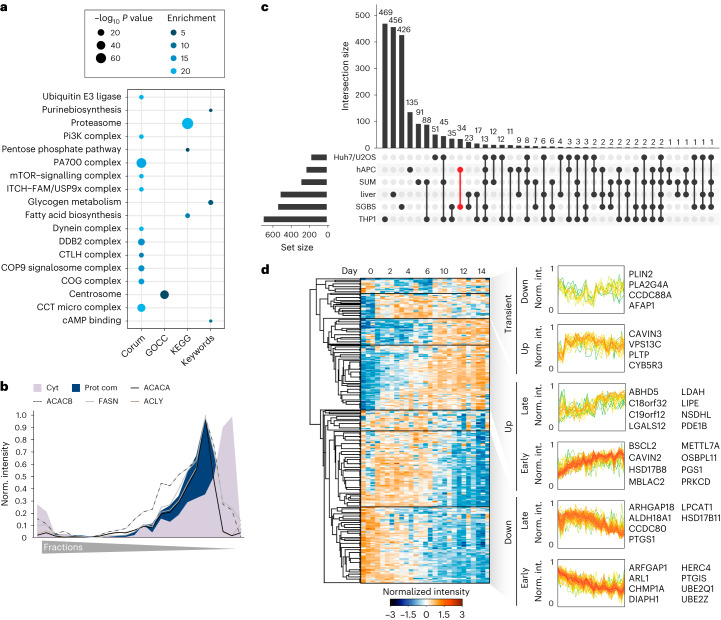
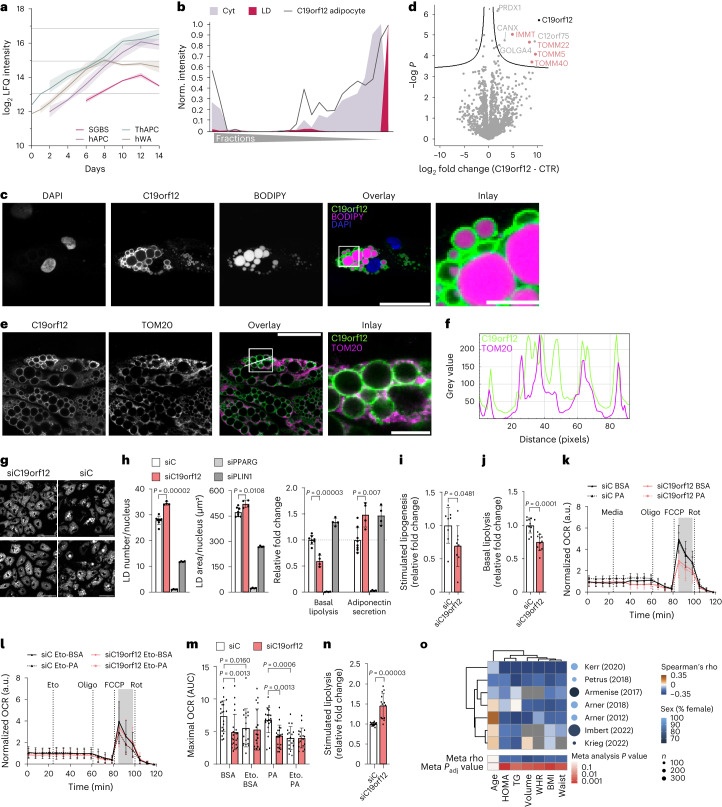
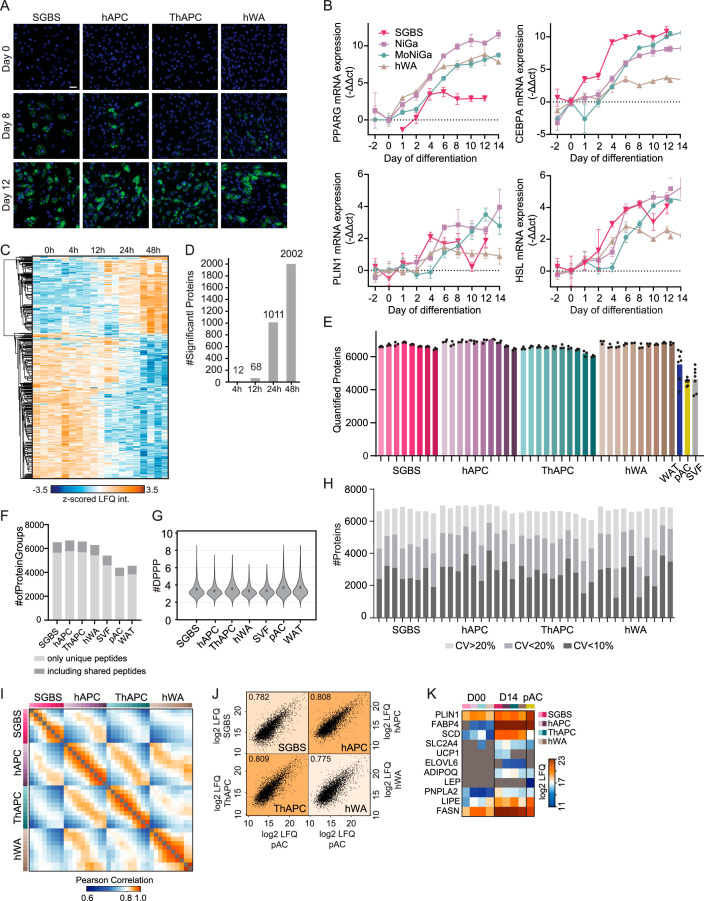
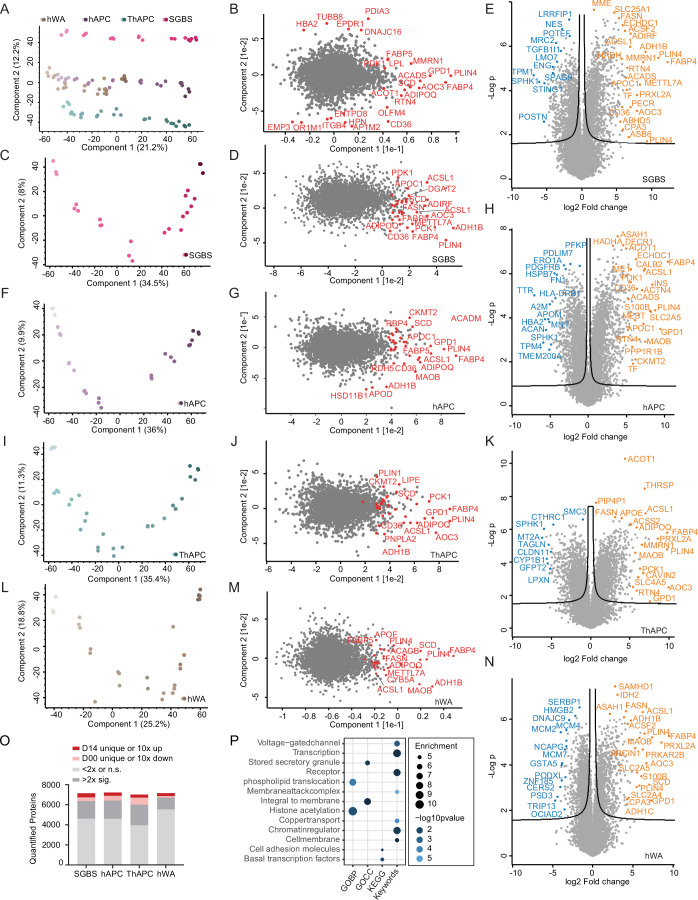
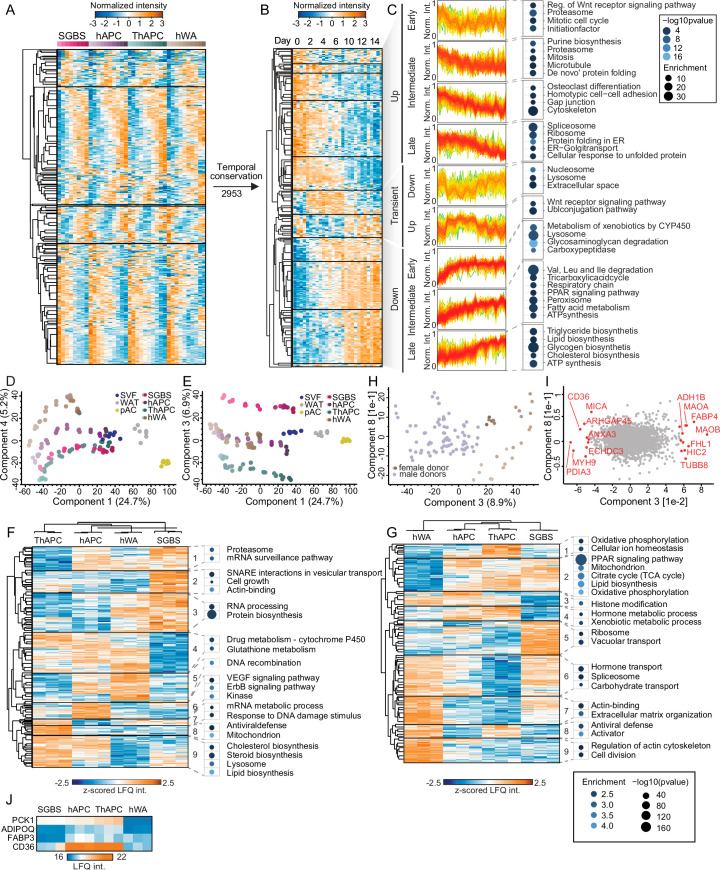
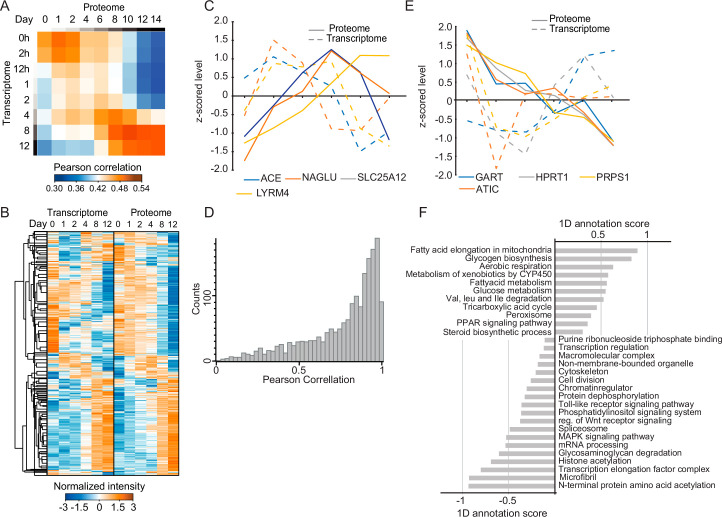
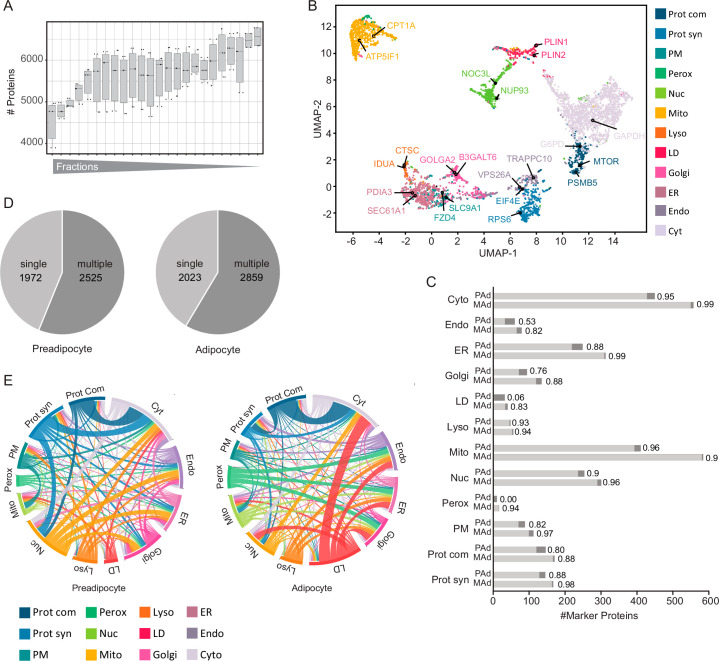
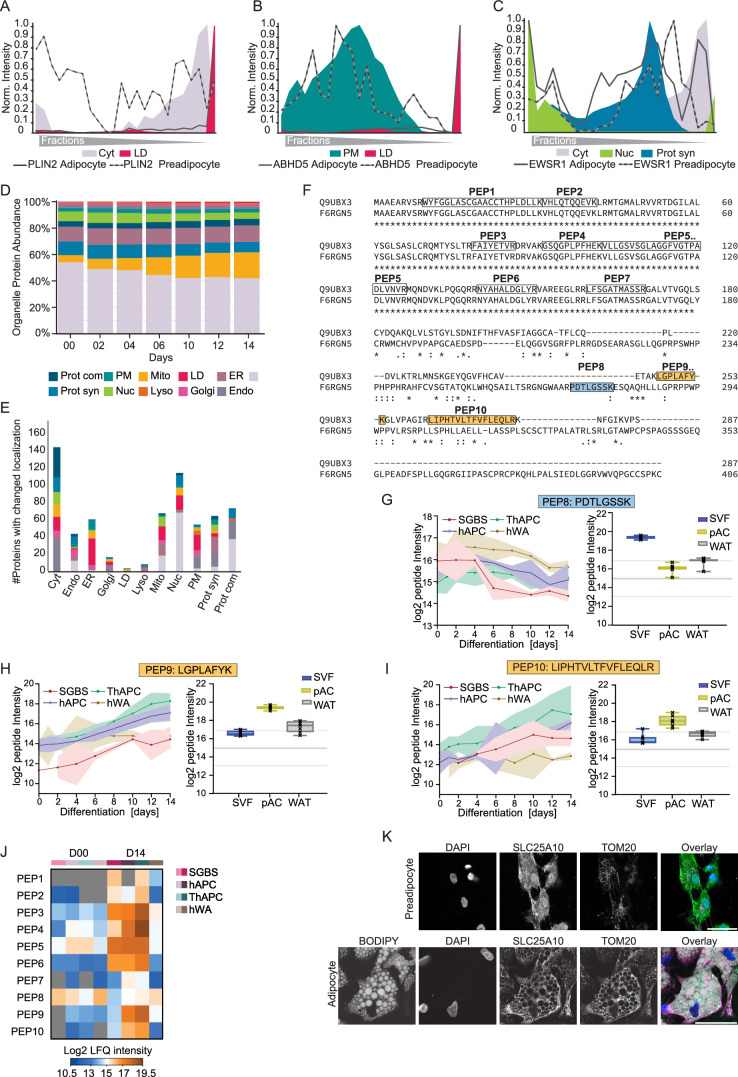
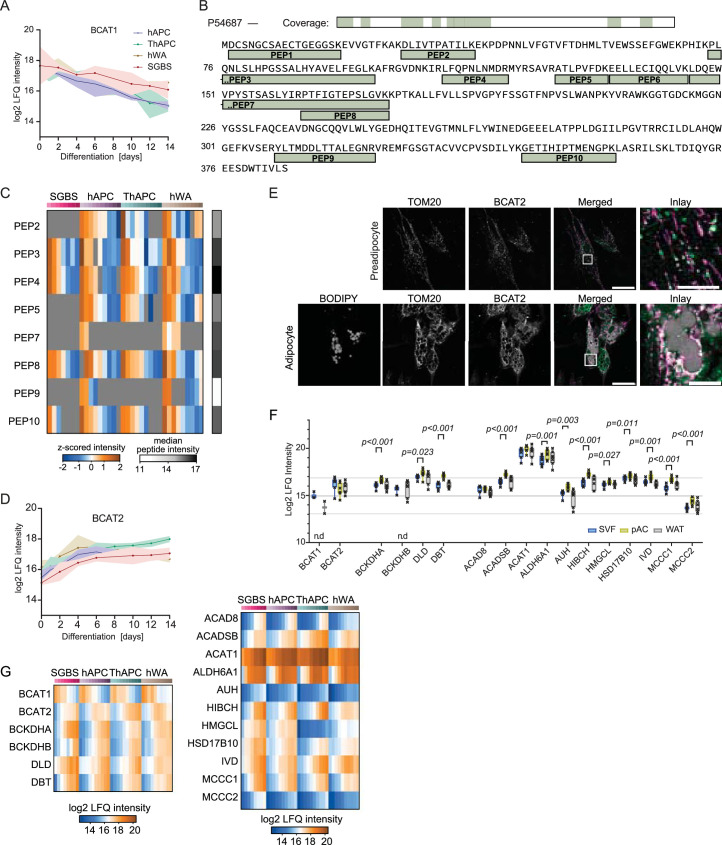
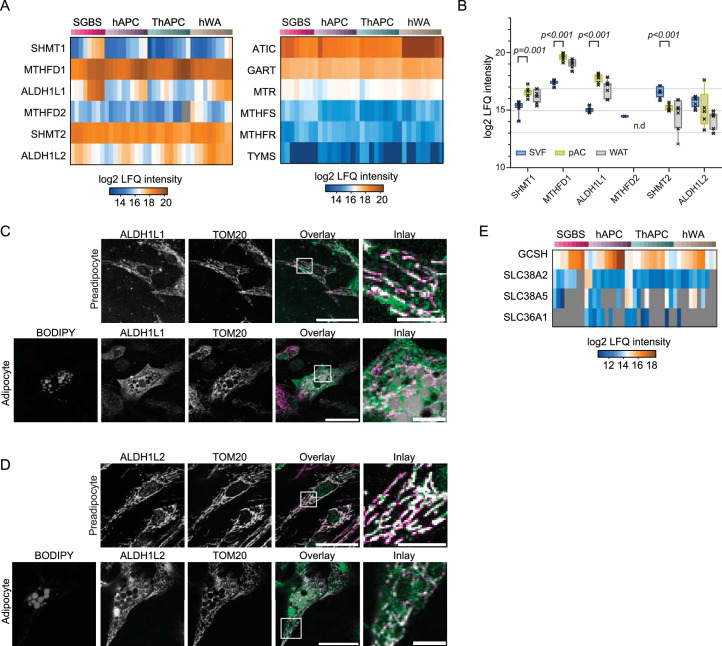
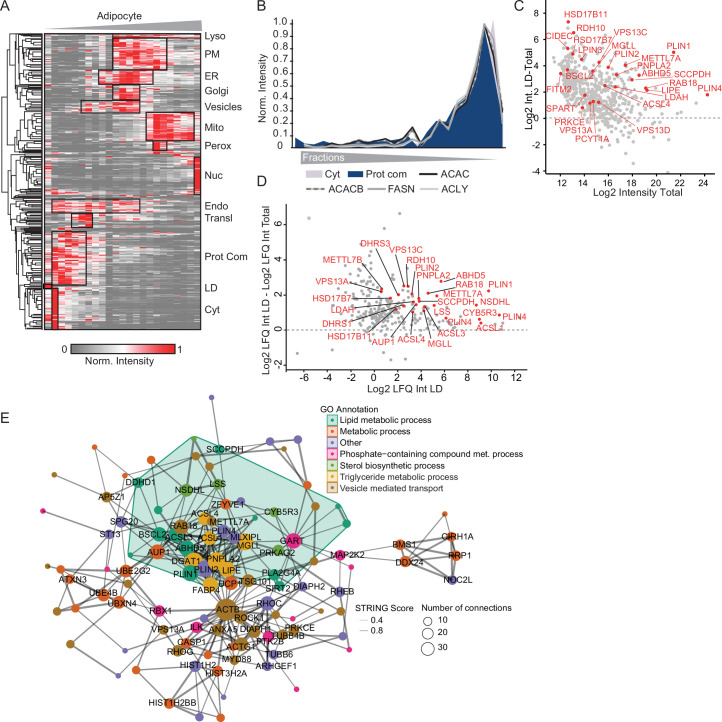
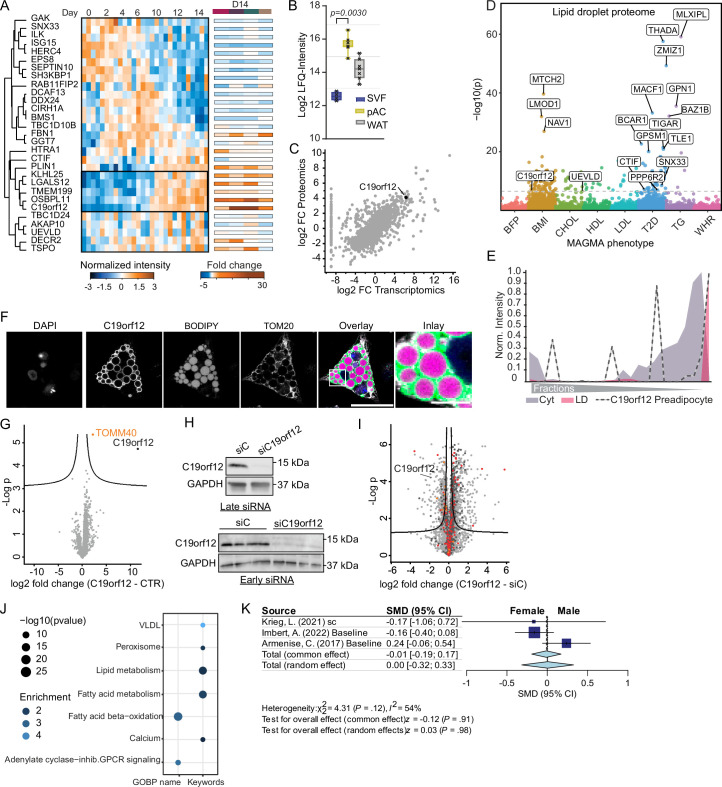
White adipocytes function as major energy reservoirs in humans by storing substantial amounts of triglycerides, and their dysfunction is associated with metabolic disorders; however, the mechanisms underlying cellular specialization during adipogenesis remain unknown. Here, we generate a spatiotemporal proteomic atlas of human adipogenesis, which elucidates cellular remodelling as well as the spatial reorganization of metabolic pathways to optimize cells for lipid accumulation and highlights the coordinated regulation of protein localization and abundance during adipocyte formation. We identify compartment-specific regulation of protein levels and localization changes of metabolic enzymes to reprogramme branched-chain amino acids and one-carbon metabolism to provide building blocks and reduction equivalents. Additionally, we identify C19orf12 as a differentiation-induced adipocyte lipid droplet protein that interacts with the translocase of the outer membrane complex of lipid droplet-associated mitochondria and regulates adipocyte lipid storage by determining the capacity of mitochondria to metabolize fatty acids. Overall, our study provides a comprehensive resource for understanding human adipogenesis and for future discoveries in the field.


Conflict of interest statement

T.D.M. receives research funding from Novo Nordisk and has received speaking fees from Eli Lilly, AstraZeneca and Novo Nordisk. The other authors declare no competing interests.

Figures

Fig. 1
Fig. 1. Mapping the temporally resolved core proteome of human adipogenesis.
a, LC–MS-based proteomics workflow for mapping the core proteome of human adipogenesis. Proteomic signatures of four human adipogenesis models at multiple time points (n = 3) were compared with proteomes from human WAT, pACs and SVFs from seven patients. Image was partially created with BioRender.com. b, Dynamic range of cell models and primary cell proteomes. c, PCA of primary samples and the differentiation stages of the cell lines (depicted as light to dark). Protein filtered for at least two valid values in all cell models and primary samples. d, PCA loadings with major driver proteins involved in lipid metabolism shown in red. e, Overlap of proteins significantly changed during differentiation in each of the models (individual ANOVA tests for each model, FDR < 10−2). f, Supervised hierarchical clustering of the z-scored temporal profiles of the 3,934 significantly changed proteins in at least three of the four models, as outlined in e. g, Supervised hierarchical clustering of z-scored temporal profiles of all cell models of a subset of f with conserved temporal profiles (Pearson correlations of inter-cell model comparison for each protein’s temporal profiles >0). The protein levels of all four models are shown next to each other at the indicated time points. h, Profiles of individual clusters and a selection of enriched annotations (one-sided Fisher’s exact test, enrichment score >2, Benjamini–Hochberg FDR < 0.1). Enrichment values and P values are depicted as bubble size and colour code, respectively. Source data
Fig. 2
Fig. 2. Generation of a cellular map of human adipogenesis.
a, Generation of a human adipocyte organellar map by PCP. Either undifferentiated or fully differentiated SGBS cells were lysed and the organelles were separated. Organelle fractions were analysed by DIA-LC–MS. Protein profiles were generated and SVM-machine learning was used to predict protein localizations. b, Median profiles from biological triplicates for indicated organelles in mature adipocytes based on all proteins assigned to an organelle with a single localization. c, Supervised hierarchical clustering of protein profiles (median of triplicates) from preadipocytes and adipocytes filtered for inter-replicate Pearson correlations >0. GO terms for organelles enriched in the marked clusters are highlighted (one-sided Fisher’s exact test, enrichment score >2, Benjamini–Hochberg FDR < 0.1). Cyt, cytosol; Perox, peroxisome; Mito, mitochondrion; Nuc, nucleus; PM, plasma membrane; Lyso, lysosome; Prot syn, protein synthesis; Endo, endosome. d, Numbers of quantified and predicted proteins in preadipocytes and in adipocytes. e, Numbers of proteins assigned to organelles as first association by SVM-based learning on concatenated protein profiles (n = 3 for preadipocytes, n = 4 for adipocytes). Source data
Fig. 3
Fig. 3. Changes in protein localization during adipogenesis.
a, The number of proteins assigned with high confidence to the same or different compartments in SGBS preadipocytes and adipocytes. b, Percentage of organelles in the total proteome of preadipocytes (SGBS day 0), mature adipocytes (SGBS day 14) and pACs based on integration of the first organelle assignments and summed protein-LFQ intensities in the total proteome analysis. c,d, Profiles of subunits of the NATC complex in preadipocytes and adipocytes overlaid with the respective organelle marker profiles. e, DTYMK profile of preadipocytes and adipocytes overlaid with the respective organelle marker profiles. f, Profiles of the two detected isoforms of SLC25A10 in adipocytes overlaid with the mitochondrial, cytosolic and nuclear marker profiles. g,h, Temporal profile of LFQ intensities of SLC25A10 isoforms from four cell models during adipogenesis (lines represent mean and light areas the whole range). i, SLC25A10 isoform levels in SVFs, pACs and WAT (two-sided, paired Student’s t-tests, FDR < 0.05, error bars spread from min to max, box extends from 25th to 75th percentile, line represents median, n = 7). j, Representative immunofluorescence of SLC25A10 in hAPC preadipocytes and adipocytes. DAPI is shown in blue, BODIPY in grey, SLC25A10 in green and TOM20 in magenta. Scale bar, 50 µm. Representative images from three conducted experiments for both hAPC preadipocytes and adipocytes. Source data
Fig. 4
Fig. 4. Integration of spatial proteomics with protein levels to characterize organelle metabolic reprogramming.
a, Hierarchical clustering of significantly changed z-score protein profiles in the total proteome over the differentiation time course, for all proteins predicted to be mitochondrial. The values from the four cell models were sorted next to each other at the same time point. GO terms enriched in the clusters compared with the total mitochondrial proteome are highlighted. b, Scheme of BCAA metabolism and its changes during adipogenesis. Upregulated and downregulated proteins are marked in orange and blue, respectively. The colour codes in the boxes display the median protein levels during adipogenesis across all cell models. Thin arrows indicate downregulated reactions and thick pathways indicate upregulated reactions during adipogenesis. The change in the protein localization of BCAT2 during adipogenesis is indicated by a red arrow. Figure were created with BioRender.com. c, Protein profile of BCAT2 and indicated organelle marker profiles. d, Scheme of one-carbon metabolism remodelling during adipogenesis. Upregulated and downregulated proteins are marked in orange and blue, respectively. The colour code in the boxes displays the median protein levels during adipogenesis across all cell models. The direction of the canonical pathway in proliferating preadipocytes is indicated by the grey arrow. Protein translocations of ALDH1L1 and ALDH1L2 are indicated by red arrows. The predicted flux change and reversal based on protein levels and localization are indicated by the arrows. The downregulated mitochondrial part of the cycle is indicated by a thin arrow and the potentially reversed and upregulated cytosolic part of the cycle is indicated by a thick arrow. The figure was created with BioRender.com. e,g, Protein profiles of ALDH1L1 and ALDH1L2 and indicated organelle marker profiles. f,h, Representative immunofluorescence staining for ALDH1L1 and ALDH1L2 in SGBS preadipocytes and adipocytes, respectively. In the overlay, BODIPY is shown in grey, ALDH1L1 and ALDH1A2 are in green and TOM20 is in magenta. Scale bar, 50 µm. Representative images from three experiments are shown. Source data
Fig. 5
Fig. 5. Spatial organization of lipid metabolism in adipocytes.
a, KEGG, Keywords, CORUM and GO-term enrichment analyses of proteins identified in the protein complex cluster of PCP in adipocytes (one-sided Fisher’s exact test, enrichment score > 2, Benjamini–Hochberg FDR < 0.15). b, Profiles of enzymes involved in de novo fatty acid synthesis from citrate overlaid with a median profile of cytosolic and protein complex-associated proteins. c, Upset plot showing overlay of LD proteomes from SGBS and hAPC cells with LD proteomes from different cell lines and the liver from the LDKP. Set sizes of proteins are indicated in the bottom left bar graph and numbers of proteins for the indicated combinations are indicated in the top bar graph. The combination of adipocyte-specific LD proteins is indicated in red. d, Supervised hierarchical clustering of temporal profiles of significantly altered LD proteins during adipogenesis. Clusters with distinct temporal responses are indicated and examples of proteins found in these clusters are shown. (Proteins filtered for significantly changed proteins in at least three of the four models, FDR < 10−2). Source data
Fig. 6
Fig. 6. C19orf12 regulates adipocyte lipid turnover.
a, Temporal regulation of C19orf12 levels during adipogenesis (lines represent mean and light areas entire range, n = 3). b, Protein profile of C19orf12 in SGBS cells overlaid with the indicated organelle marker profiles. c, Representative immunofluorescence of C19orf12 in SGBS adipocytes. Scale bars, 50 μm and 10 μm in the inlay. The experiment was repeated three times. d, Volcano plot of the interactome of C19orf12-GFP versus GFP control in SGBS preadipocytes overexpressing the GFP-tagged protein. The components of the mitochondrial protein import machinery are indicated in pink (n = 4, FDR < 0.05). e, Representative immunofluorescence of C19orf12 in SGBS adipocytes. Scale bars, 50 μm and 10 μm in the inlay. The experiment was repeated four times. f, Intensity plot of the fluorescence signals for C19orf21 and TOM20 on the line indicated in e. g, Two representative images of BODIPY staining in hAPCs on day 12 of differentiation after C19orf12 and control siRNA treatments 1 day before differentiation (n = 4, experiment was repeated twice). Scale bar, 80 μm. h, LD number, LD area, basal lipolysis and adiponectin secretion for hAPCs treated as in g (n = 8 siControl; n = 4 target siRNA, experiment was repeated twice, plot shows mean ± s.d., independent unpaired two-tailed t-test). i, Stimulated lipogenesis measurements in hAPCs on day 13 of differentiation after siRNA treatment on day 8 (n = 8, experiment repeated twice, plot shows mean ± s.d., independent unpaired two-tailed t-test). j,n, Basal and stimulated lipolysis in hAPCs on day 12 of differentiation after siRNA treatment on day 8 (n = 11 replicates, repeated twice for j, n = 13 replicates, repeated three times for n, plot shows mean ± s.d., independent unpaired two-tailed t-test). km, OCR measurement on day 12 of differentiation and its quantification in hAPCs treated with siRNA on day 8 in the presence of either BSA or palmitate and treated with etomoxir (n = 21 replicates, repeated three times for k; n = 18 replicates, repeated twice for etomoxir (Eto) in l, mean ± s.d., Kruskal–Wallis with uncorrected Dunn’s). a.u., arbitrary units; AUC, area under the curve. o, Association between C19orf12 expression and clinical parameters. BMI, body mass index; HOMA, homoeostatic model assessment of insulin sensitivity; TG, triglyceride; WHR, waist–hip ratio. Spearman rank correlation test was performed for the transcriptome analysis of WAT. Source data
Extended Data Fig. 1
Extended Data Fig. 1. Characterization of human adipogenesis models and comparison with primary cell proteomes.
(a) Fluorescence microscopy of cell models at early (day 0), middle (day 8), and late stages (days 12–14) of adipogenesis. Experiment repeated twice. LDs stained with BODIPY are shown in green, nuclei stained with DAPI are shown in blue, scale bar = 100µm (n = 3, experiment performed once). (b) qPCR of adipogenic marker genes at indicated time points. Values were normalized to the first detected time point. (n = 4, mean ± SD). (c) Hierarchical clustering of significantly altered proteins across initial stages of SGBS cell differentiation (n = 4, ANOVA, FDR < 10^(−2)). (d) Number of significantly altered proteins in the first 48 h of differentiation (n = 4, two-sided Student′s t-test, FDR < 10^(−2)). (e) Number of quantified protein groups during the differentiation of cell models and primary samples (n = 3 for cell models and n = 7 for primary samples, mean ± SD). (f) Number of proteins groups identified based only on unique peptides - analysis based on canonical not additional FASTA. (g) Violin plot of data points over the peak for each identified peptide in different cell models, average is indicated. (h) Number of proteins with the indicated CV values at each time point in each cell model. (i) Pearson correlations between samples. (j) Pearson correlations of the median protein intensities between each differentiated model and primary adipocytes (minimum two valid per condition, missing values imputed with 0). (k) Log2 LFQ intensities of adipogenesis markers in cell models. Source data
Extended Data Fig. 2
Extended Data Fig. 2. Remodelling of cell model proteomes during adipogenesis.
(a) PCA of the adipogenic differentiation stages of the cell lines (depicted from light to dark) (filtering for a minimum of 5% valid values across all models, time points, and missing values imputed based on a normal distribution). (b) PCA loadings with the major driver proteins involved in lipid metabolism are shown in red. (c), (F), (I), and (L) PCAs of adipogenic differentiation stages of each cell model. (d), (G), (J), and (M) PCA loadings with the major driver proteins involved in lipid metabolism are shown in red for each cell model. (e), (H), (K), and (N) volcano plots for each cell model comparing the proteomes of preadipocytes and adipocytes from day 14 (n = 3, FDR < 10^(−2) and S0 = 0.1). The most strongly upregulated or downregulated proteins are indicated in orange and blue, respectively. (O) Number of proteins quantified during differentiation in each cell model (min. two detections in at least one time point), and the number of significantly regulated proteins or proteins exclusively quantified in either mature adipocytes or preadipocytes (two-sided Student’s t-test, FDR < 10^(−2)). (P) Enrichment analysis for GO-terms, keywords, and KEGG pathways among proteins of the stable proteome during adipogenesis (one-sided Fisher’s exact test, enrichment score >2, Benjamini-Hochberg FDR < 0,1). Source data
Extended Data Fig. 3
Extended Data Fig. 3. Changes in protein copy number and differences between the cell models.
(a) Supervised hierarchical clustering of the z-scored temporal profiles of ranked copy numbers of significantly changed proteins in at least three of the four models (n = 3, ANOVA conducted on copy numbers, FDR < 10^(−2)). (b) Supervised hierarchical clustering of z-scored temporal profiles of all cell models of a subset of (A) with conserved temporal profiles (Pearson correlation of z-scored temporal profiles in all inter-cell model comparisons >0). The copy numbers of all the four models are shown next to each other at each indicated time point. (c) Representative GO-annotations, KEGG pathways, and Keywords enriched in the indicated clusters are shown. Enrichment values and p values are depicted as bubble size and colour code, respectively (one-sided Fisher’s exact test, enrichment score >2, Benjamini-Hochberg FDR < 0,1). (d) and (e) PCAs of the adipogenic differentiation stages of the cell lines (depicted from light to dark) showing components 3 and 4. (f) and (g) Unsupervised hierarchical clustering of z-scored protein levels of significantly different proteins between preadipocytes and adipocytes on days 0 and 14 across the four cell models, respectively (n = 3, ANOVA, FDR < 0.01). Representative GO-annotations, KEGG pathways, and Keywords enriched in the indicated clusters are shown (one-sided Fisher’s exact test, enrichment score >2, Benjamini-Hochberg FDR < 0,1). P values and enrichment scores are indicated by bubble colour and size (h) PCA showing Components 3 and 7, separating cell models of male and female donors. (i) PCA loading showing the major driver proteins of Component 3 in red. (j) Heatmap of LFQ intensities of PPARγ targets on day 14 (n = 3). Source data
Extended Data Fig. 4
Extended Data Fig. 4. Temporal changes in the proteome and transcriptome during adipogenesis.
(a) Pearson correlation coefficients between protein and mRNA levels at each indicated time point of differentiation in hAPCs. The datasets were filtered for the temporally conserved core proteome from (1H). (b) Supervised hierarchical clustering of z-scored profiles at protein and mRNA levels. (c) Z-scored protein and mRNA profiles of indicated proteins. (d) Histogram of Pearson correlation values between the temporal protein and mRNA profiles of proteins, including all time points present in both datasets. (e) Z-scored protein and mRNA profiles of indicated proteins. (f) 1D annotation scores of representative GO-terms, keywords, and KEGG pathways enriched among pathways with high and low temporal mRNA and protein correlations (two-sided 1D annotation enrichment, Benjamini-Hochberg FDR < 0.1). Source data
Extended Data Fig. 5
Extended Data Fig. 5. A cellular map of human preadipocytes and adipocytes.
(a) Boxplot showing the number of quantified proteins per organelle fraction in adipocytes and preadipocytes (n = 7, error bars spread from min to max, box extends from the 25th to 75th percentile, line represents the median). (b) UMAP visualization of adipocyte PCP dataset. Proteins are coloured according to their organelles. Names of canonical markers are indicated. (c) The number of organelle markers per compartment and prediction accuracy of these markers by SVMs for preadipocytes (pAd) and mature adipocytes (mAd). (d) Number of proteins with single- and dual-protein predictions in the preadipocytes and adipocytes. (e) Circular plots of the first and second organelle predictions for preadipocyte and adipocyte organelle maps. Each Circos plot depicts the location of the first organelle in the outer ring and the second organelle in the inner ring. The second organelle is indicated in colour. Each connection line displays a combination of dual localizations, as revealed by the organelle map. The colour of the connection line corresponds to the first organelle assignment. Source data
Extended Data Fig. 6
Extended Data Fig. 6. Organelle remodelling during adipogenesis.
(a)–(c) Examples of protein profiles previously reported to change localization during adipogenesis. The protein profiles of the preadipocytes and adipocytes were overlaid with the average organelle marker proteins of the indicated compartments. (d) Percentage of organelle intensities in the total proteomes during the time course of differentiation. Calculations were based on the first localization of the assigned proteins in either preadipocytes or adipocyte PCP under the respective conditions. For intermediate time points, quantification was based on proteins with the same localization under both conditions. (e) Frequency of changes in localization between preadipocytes and adipocytes in each organelle for proteins assigned with high confidence. Localization in the preadipocytes is displayed on the x-axis, and the number of localization changes is displayed on the y-axis. Target organelles are indicated by their respective colours. (f) Amino acid sequence alignment of the two SLC25A10 isoforms. Common and isoform-specific precursors are marked. (g), (h), and (i) Temporal profiles of the intensities of the indicated precursors in the cell models (n = 3, mean ± 95% confidence interval) and their LFQ intensities in the primary cells (n = 7, error bars from boxplot spread from min to max, box extends from the 25th to 75th percentile, line represents median). (j) Heatmap of z-scored profiles of the indicated precursors in the preadipocytes, adipocytes, and primary cells. (k) Immunofluorescence of SLC25A10 in SGBS preadipocytes and adipocytes. DAPI is shown in blue, BODIPY in grey, SLC25A10 in green, and TOM20 in magenta. Scale bar = 50µm. Representative images of two experiments in preadipocyte and three in adipocytes. Source data
Extended Data Fig. 7
Extended Data Fig. 7. BCAA catabolism reprogramming during adipogenesis.
(a) Log2 LFQ intensities of BCAT1 in four adipogenesis models during differentiation (n = 3, lines represent mean and light areas the entire range). (b) Amino acid sequence of BCAT1. Quantified peptides are shown. (c) Temporal profiles of BCAT1 peptides (n = 3, mean ± 95% confidence interval). (d) Log2 LFQ intensities of BCAT2 in four adipogenesis models during differentiation (n = 3, lines represent mean and light areas the entire range). (e) Immunofluorescence of BCAT2 in hAPC preadipocytes and adipocytes. In the overlay, BODIPY is shown in grey, BCAT2 in green, and TOM20 in magenta. Scale bar = 50µm in overlay and 10µm in inlay. The experiment was repeated four times. (f) Log2 LFQ intensities of BCAA metabolism enzymes in primary samples (n = 7, two-sided paired Student’s t-tests, FDR < 0.05, error bars spread from min to max, box extends from the 25th to 75th percentile, line represents the median). (g) Heatmaps of log2 LFQ intensities of BCAA metabolic enzymes in all four models during differentiation (median, n = 3). Source data
Extended Data Fig. 8
Extended Data Fig. 8. Reprogramming of the one-carbon cycle during adipogenesis.
(a) Heatmap of log2 LFQ intensities of one-carbon cycle enzymes and 1C consuming enzymes for all four models during differentiation (median of n = 3). (b) Log2 LFQ intensities of one-carbon cycle enzymes in primary cells (n = 7, two-sided paired Student’s t-tests, FDR < 0.05; error bars in the box plot spread from min to max; box extends from the 25th to 75th percentile; line represents median). (c) and (d) Immunofluorescence microscopy of ALDH1L1 and ALDH1L2 in hAPC preadipocytes and adipocytes, respectively. In the overlay, BODIPY is shown in grey, ALDH1L1 and ALDH1A2 in green, and TOM20 in magenta. Scale bar = 50 µm in overlay and 10 µm in inlay. Representative images of three experiments are shown. (e) Heatmap of log2 LFQ intensities for glycine transporters and glycine-degrading enzymes (median of n = 3). Source data
Extended Data Fig. 9
Extended Data Fig. 9. The LD proteome of human white adipocytes.
(a) Supervised hierarchical clustering of temporal profiles of significantly altered LD proteins during adipogenesis. Hierarchical clustering of PCPs of hAPCs (n = 1). Enriched GO-terms in the clusters are indicated (Fisher’s test, FDR < 0.1). (b) Profiles of the indicated proteins involved in de novo lipogenesis in hAPCs overlaid with the marker profiles of cytosolic proteins and proteins from protein complexes. (c) and (d) Filtering of LD-assigned and LD-enriched proteins versus the total proteome. Protein levels of proteins determined as LD proteins as first or second assignments from SVMs based on PCP analysis in hAPCs in the LD fraction versus the total proteome from SGBS and hAPCs, respectively. (e) Functional clusters of LD proteins mapped in both adipocyte models were analysed using the STRING database, and those with at least two partners (physical and/or functional) are shown. High-confidence interactions with thicker connected lines. GO-enriched annotation terms (FDR < 5*10^(−2)) are coloured to highlight specific clusters. (Size = number of connections; line width = STRING combined score). Source data
Extended Data Fig. 10
Extended Data Fig. 10. C19orf12 is a regulator of adipocyte function.
(a) Supervised hierarchical clustering of z-scored temporal profiles of adipocyte LD proteins with altered levels. (b) C19orf12 levels in SVFs, pACs, and WAT (n = 7, two-sided paired Student’s t-tests, FDR < 0.05; error bars spread from min to max; box extends from the 25th to 75th percentile; line represents median). (c) Correlation of fold change at protein and mRNA levels between days 0 and 14. (d) Manhattan plot of metabolic associations (−log10 p values) in LD proteome. (e) Protein profile of C19orf12 in preadipocytes (f) Immunofluorescence of C19orf12 expression in hAPCs. BODIPY is shown in magenta, C19orf12 in green, TOM20 in grey, DAPI in blue. Scale bar = 50µm, 10µm in the inlay. Representative images of three experiments. (g) Volcano plot of C19orf12-GFP interactome in SGBS adipocytes. Mitochondrial protein import machinery indicated in pink (n = 4, two-sided Student’s t-test, FDR < 5*10(-2)). (h) Western blotting for C19orf12 in hAPCs treated with C19orf12 or control siRNA either 1 day before differentiation or at day 8 of differentiation (n = 1 for early knockdown, other replicates were subjected to proteomic analysis in (I)) and n = 1 in the late knockdown, n = 4). (i) Volcano plot of proteome analysis of early C19orf12 KD (n = 4, FDR < 0.05, S0 = 0.1). (j) Enrichment analysis for C19orf12 KD. Enrichment scores are indicated by bubble size and P values by colour code. (one-sided Fisher’s exact test, enrichment score >2, Benjamini-Hochberg FDR < 0,1) (k) Secondary meta-analysis for association between C19orf12 expression with clinical parameters (Fig. 6o) for sex specific effects. Forest plot indicating sex differences across cohorts were calculated as standardized mean difference (SMD), shown as blue squares, where the size correlates to the number of individuals in each cohor, lines represent 95% confidence interval. The total effect was calculated using either the common or random effects model depicted as light blue diamonds, width represents 95% confidence interval. No sex differences were observed (p = 0.91 and p = 0.98). Source data

References

    1. National Research Council (US) Committee on Diet and Health. Diet and Health: Implications for Reducing Chronic Disease Risk (National Academies Press,1989). - PubMed
    1. Spalding KL, et al. Dynamics of fat cell turnover in humans. Nature. 2008;453:783–787. doi: 10.1038/nature06902. - DOI - PubMed
    1. Sarvari AK, et al. Plasticity of epididymal adipose tissue in response to diet-induced obesity at single-nucleus resolution. Cell Metab. 2021;33:437–453. doi: 10.1016/j.cmet.2020.12.004. - DOI - PubMed
    1. Backdahl J, et al. Spatial mapping reveals human adipocyte subpopulations with distinct sensitivities to insulin. Cell Metab. 2021;33:1869–1882. doi: 10.1016/j.cmet.2021.07.018. - DOI - PubMed
    1. Daquinag AC, et al. Fatty acid mobilization from adipose tissue is mediated by CD36 posttranslational modifications and intracellular trafficking. JCI Insight. 2021;6:e147057. doi: 10.1172/jci.insight.147057. - DOI - PMC - PubMed