. 2024 Apr 2;22(1):212.
doi: 10.1186/s12964-024-01590-1.

Single cell analysis reveals the roles and regulatory mechanisms of type-I interferons in Parkinson's disease

Affiliations

Single cell analysis reveals the roles and regulatory mechanisms of type-I interferons in Parkinson's disease

Pusheng Quan et al. Cell Commun Signal. .

Abstract

The pathogenesis of Parkinson's disease (PD) is strongly associated with neuroinflammation, and type I interferons (IFN-I) play a crucial role in regulating immune and inflammatory responses. However, the specific features of IFN in different cell types and the underlying mechanisms of PD have yet to be fully described. In this study, we analyzed the GSE157783 dataset, which includes 39,024 single-cell RNA sequencing results for five PD patients and six healthy controls from the Gene Expression Omnibus database. After cell type annotation, we intersected differentially expressed genes in each cell subcluster with genes collected in The Interferome database to generate an IFN-I-stimulated gene set (ISGs). Based on this gene set, we used the R package AUCell to score each cell, representing the IFN-I activity. Additionally, we performed monocle trajectory analysis, and single-cell regulatory network inference and clustering (SCENIC) to uncover the underlying mechanisms. In silico gene perturbation and subsequent experiments confirm NFATc2 regulation of type I interferon response and neuroinflammation. Our analysis revealed that microglia, endothelial cells, and pericytes exhibited the highest activity of IFN-I. Furthermore, single-cell trajectory detection demonstrated that microglia in the midbrain of PD patients were in a pro-inflammatory activation state, which was validated in the 1-Methyl-4-phenyl-1,2,3,6-tetrahydropyridine (MPTP)-induced PD mouse model as well. We identified transcription factors NFATc2, which was significantly up-regulated and involved in the expression of ISGs and activation of microglia in PD. In the 1-Methyl-4-phenylpyridinium (MPP+)-induced BV2 cell model, the suppression of NFATc2 resulted in a reduction in IFN-β levels, impeding the phosphorylation of STAT1, and attenuating the activation of the NF-κB pathway. Furthermore, the downregulation of NFATc2 mitigated the detrimental effects on SH-SY5Y cells co-cultured in conditioned medium. Our study highlights the critical role of microglia in type I interferon responses in PD. Additionally, we identified transcription factors NFATc2 as key regulators of aberrant type I interferon responses and microglial pro-inflammatory activation in PD. These findings provide new insights into the pathogenesis of PD and may have implications for the development of novel therapeutic strategies.

Keywords: Immune; Parkinson’s disease; Single cell; Transcription factors; Type-I interferons.


Conflict of interest statement

The authors declare no competing interests.

Figures

Fig. 1
Fig. 1
The workflow of this study
Fig. 2
Fig. 2
Single-cell transcriptome analysis of PD midbrain cells. A The tSNE plot representing the 10 cell types in different groups. B Dotplot showing average scRNA-seq expression of marker genes in different subgroups. C Heatmap showing expression of the top 50 DEGs in each cell subset and GO enrichment analysis results. D Bar plots showing the proportion of cell types in different groups. E MiloR exhibited a significant distinction, primarily characterized by a higher relative abundance of microglia observed in patients with PD
Fig. 3
Fig. 3
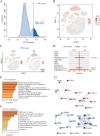
IFN-I scores for PD midbrain cell subsets. A An IFN-I score was calculated based on 469 screened ISGs. The threshold value was 0.273, and 3883 cells exceeded it. B The tSNE plot of each cell based on the IFN-I score. High-IFN-I-scoring cells are highlighted with red color. C The tSNE plot based on the IFN-I scores between different groups. D The bar plot showing the percent of High-IFN-I-scoring cells in each cell subset between groups. Of 2639 microglial cells in the PD group, 1352 showed high IFN-I activity, contrasting with 407 of 1165 cells in the control group. For endothelial cells, 649 of 717 in the PD group had high IFN-I activity versus 943 of 1008 in the control group. However, comparing pericytes—180 high IFN-I activity of 572 in the PD group against 209 of 651 in the control. E, F GO and KEGG enrichment analysis of DEGs in high-IFN-I-scoring cells. G PPI analysis (MCODE) of DEGs in high-IFN-I-scoring cells. *p < 0.05; ****p < 0.0001
Fig. 4
Fig. 4
Pseudotime and single cell trajectory analysis for microglia by Monocle. A Three stages of microglia differentiation. State 1 is the earliest stage of differentiation. B Differentiation of microglia between groups. C Timing differences in cell differentiation. Darker blue indicates an earlier stage of differentiation while lighter blue indicates a later stage. D Clusters of genes that were differentially expressed across pseudotime at branch_point 1. The represented biological pathways from GO analysis of each cluster are noted at left
Fig. 5
Fig. 5
Violin plots showing TLR family expression in each cell type. *p < 0.05; **p < 0.01; ***p < 0.001, ****p < 0.0001
Fig. 6
Fig. 6
Identification of combinatorial regulon modules and Cell-type-specific regulon activity analysis. A Combinatorial regulation modules are identified based on regulatory connection specificity index matrices, along with representative transcription factors, corresponding binding motifs, and associated cell types. B Rank for regulons in Microglia based on regulon specificity score (RSS). C The t-SNE map highlights microglia (red dots). D A t-SNE map with binarized regulon activity scores (RAS) for top regulon NFATc2 (dark green dots). E Seek co-expression results for top regulon NFATc2 target genes in different GEO datasets. Each dataset is represented by an x axis, and its co-expression significance is represented by each y axis. Microglia related datasets with significant correlation (p-value < 0.01) are highlighted by yellow dots. F, G Same as E, D but for RUNX2. H, I Same as D, E but for IRF5
Fig. 7
Fig. 7
GSVA analysis and gene expression compare. A-C GSVA analysis for genes in GSE7621, GSE49036, and GSE26927, respectively. Red font represents the pathways exhibiting significant changes in different groups (p < 0.05 & FDR < 0.25). D-F Expression of NFATc2, RUNX2, and IRF5 in GSE7621, GSE49036, and GSE26927, respectively. G The regulatory network of NFATc2 and RUNX2
Fig. 8
Fig. 8
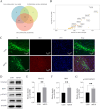
In silico gene perturbation and in vivo validation for NFATc2. A Venn diagram shows the overlap of transcription factors regulating the NF-κB, IFN-I response, and inflammatory response pathway. B The in silico gene perturbation results suggest key genes involved in the transition from high IFN-I microglial cells to low IFN-I microglial cells. C Iba1 show the increasing trend of microgliosis in MPTP-treated mice. D-G Western blot results for NFATc2 (E), IRF9 (F), and p-STAT1/ STAT1(G)
Fig. 9
Fig. 9
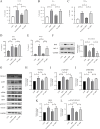
A-C ELISA results indicate that NFATc2 regulates the release of proinflammatory cytokines IL-1β (A), IL-6 (B), and TNF-α (C) in MPP+-induced BV-2 cells. D-E NFATc2 regulates the levels of IFN-β rather than IFN-α. F Knocking down NFATc2 can alleviate apoptosis in SH-SY5Y cells co-cultured in conditioned medium. G-L Western blot and the corresponding statistical analysis for NFATc2 (H), p-p65/ p65 (I), p-IκBα/IκBα(J), IRF9 (K), and p-STAT1/STAT1(L)
Fig. 10
Fig. 10
Hypothesis of possible IFN-I signaling pathway regulatory mechanism based on our findings in PD. Various toxic metabolites and proteins could increase NFATc2 expression may positively regulate expression of interferon-β and NF-κB, which in turn, enhance IFNs signaling, resulting in unexpected consequences (neuroinflammation, neuronal apoptosis, axonal degeneration, etc.). Images were drawn by Figdraw

Similar articles

Cited by

References

    1. Dorsey ER, Sherer T, Okun MS, Bloem BR. The emerging evidence of the Parkinson pandemic. J Parkinsons Dis. 2018;8(s1):S3–s8. doi: 10.3233/JPD-181474. - DOI - PMC - PubMed
    1. Global, regional, and national burden of neurological disorders, 1990-2016: a systematic analysis for the global burden of disease study 2016. Lancet Neurol. 2019;18(5):459–80. - PMC - PubMed
    1. Armstrong MJ, Okun MS. Diagnosis and treatment of Parkinson disease: A review. Jama. 2020;323(6):548–560. doi: 10.1001/jama.2019.22360. - DOI - PubMed
    1. Bloem BR, Okun MS, Klein C. Parkinson's disease. Lancet (London England). 2021;397(10291):2284–2303. doi: 10.1016/S0140-6736(21)00218-X. - DOI - PubMed
    1. Tansey MG, Wallings RL, Houser MC, Herrick MK, Keating CE, Joers V. Inflammation and immune dysfunction in Parkinson disease. Nat Rev Immunol. 2022;22(11):657–73. - PMC - PubMed

Publication types

Associated data