. 2024 Apr 2;12(1):50.
doi: 10.1186/s40478-024-01754-7.

Tumor associated microglia/macrophages utilize GPNMB to promote tumor growth and alter immune cell infiltration in glioma

Affiliations

Tumor associated microglia/macrophages utilize GPNMB to promote tumor growth and alter immune cell infiltration in glioma

Fatih Yalcin et al. Acta Neuropathol Commun. .

Abstract

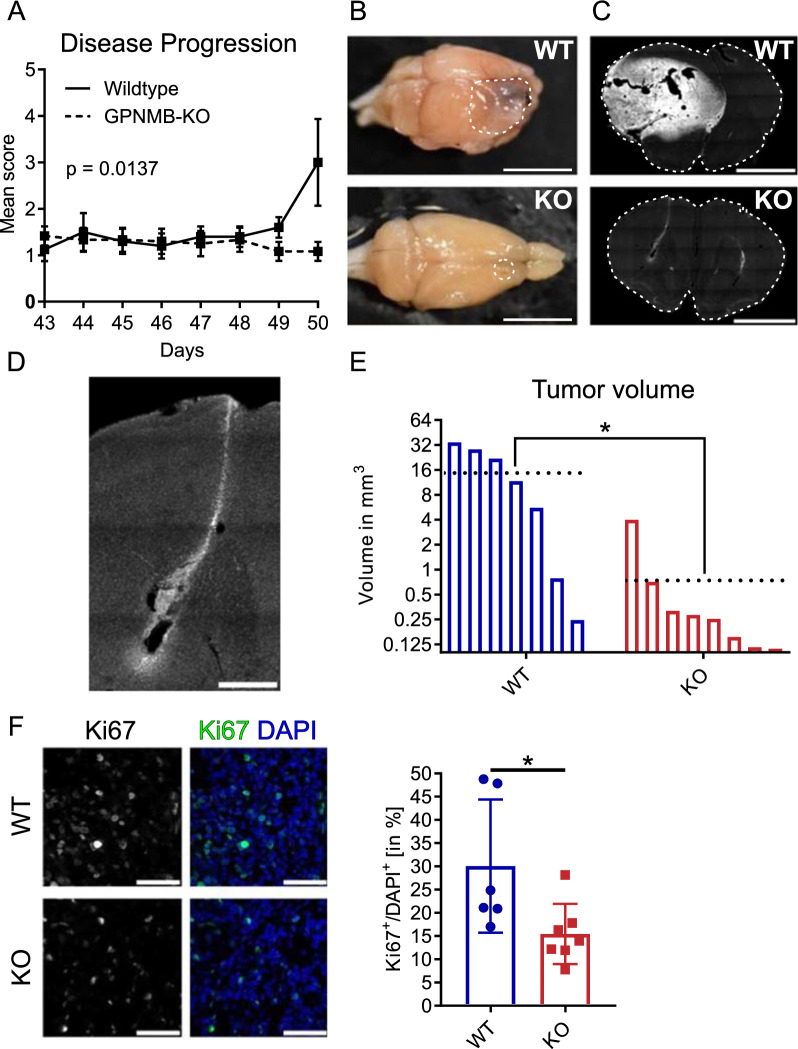
Tumor-associated microglia and blood-derived macrophages (TAMs) play a central role in modulating the immune suppressive microenvironment in glioma. Here, we show that GPNMB is predominantly expressed by TAMs in human glioblastoma multiforme and the murine RCAS-PDGFb high grade glioma model. Loss of GPNMB in the in vivo tumor microenvironment results in significantly smaller tumor volumes and generates a pro-inflammatory innate and adaptive immune cell microenvironment. The impact of host-derived GPNMB on tumor growth was confirmed in two distinct murine glioma cell lines in organotypic brain slices from GPNMB-KO and control mice. Using published data bases of human glioma, the elevated levels in TAMs could be confirmed and the GPNMB expression correlated with a poorer survival.

Keywords: CD44; Experimental glioma; GPNMB; Glioblastoma; Macrophage; Microglia; Mouse; RCAS.


Conflict of interest statement

No competing interests declared.

Figures

Fig. 1
Fig. 1
Depletion of host-derived GPNMB impairs glioma formation and proliferation in vivo. A Disease progression score of tumor-bearing WT and KO mice injected with PDGFb-driven RCAS-RFP glioma cells. Animals were sacrificed upon the first animal reaching disease score 3 (day 50). B Representative macroscopic image of a tumor-bearing brain from WT (top) and KO (bottom) mice. The white dotted line marks the tumor in WT and in KO. Scale bars represent 5 mm. C RFP+ fluorescence (grey scaled for visibility) labeling of glioma cells of a representative brain slice from a tumor-bearing WT (top) and KO (bottom) mice. The white dotted line marks the whole brain tissue. Scale bars represent 2 mm. D RFP+ fluorescence (grey scaled for visibility) of tumor cells at the injection site of a representative KO brain slice. Scale bar represents 500 µm. E Tumor volume of tumor-bearing WT (n = 7) and KO (n = 8) mice. Black dotted line represents the mean value of each group. Statistical analysis was performed using unpaired t-test. F Representative staining of Ki-67 (left) and merged with DAPI (right; Ki-67 = green, DAPI = blue) of brain slices from tumor-bearing WT (n = 6) and KO (n = 7). Scale bar represents 50 µm. Statistical analysis was performed using an unpaired t-test. Error bars represent SD. *p < 0.05
Fig. 2
Fig. 2
GPNMB is upregulated in the murine TME and is predominantly expressed by TAMs. A Representative FACS analysis of GPNMB+ populations in MG/TAMs (I), MonoLy6clow (II), MonoLy6chigh (III), neutrophils (IV) and lymphocytes (V) in naïve brain and spleen tissue (top row) and tumor-bearing brain tissue (bottom row). B Quantification of GPNMB expression in non-immune cells (CD45CD11b). Comparison of naïve brain (n = 4) against tumor-bearing (n = 5) brain tissue. GPNMB expression in microglia (MG)/macrophages (MPH)/TAMs (I; CD45+CD11b+Ly6GLy6c). Comparison between naïve brain (n = 4), naïve spleen (n = 4) and tumor brain (n = 5). GPNMB expression in monocytes with low Ly6c (II; CD45+CD11b+Ly6GLy6clow), monocytes with high Ly6c (III; CD45+CD11b+Ly6GLy6chigh), neutrophils (IV; CD45+CD11b+Ly6G+Ly6c+) and lymphocytes (V; CD45+CD11b). Comparison of naïve spleen (n = 4) against tumor-bearing (n = 5) brain tissue. Error bars represent SD. Statistical analysis in 3 groups was performed using Ordinary one-way ANOVA with Tukey’s multiple comparisons test and in 2 groups using unpaired t-test. *p < 0.05, **p  < 0.01, ***p < 0.001, ns, not significant. C Representative brain slices from tumor-bearing WT mice stained for IBA1 (top row), GPNMB (middle row) and merge with DAPI (bottom row; IBA1 = green, GPNMB = red, DAPI = blue). Left column: Lower magnifications of the invasive edge (white dotted line = invasive edge; left: brain tissue; right: tumor tissue). Scale bar represents 200 µm. Middle column: Higher magnifications of the invasive edge. Scale bar represents 50 µm. Right column: Representative GPNMB+/IBA1+ cells in the tumor core. Scale bar represents 20 µm
Fig. 3
Fig. 3
GPNMB-KO mice display a higher density and soma size of microglia and accumulate pro-inflammatory TAMs. A Representative staining of IBA1 (left) and merge with DAPI (right; IBA1 = green, DAPI = blue) of brain slices from naïve WT (n = 3) and KO (n = 3). Scale bar represents 100 µm. The inserts show an expanded magnification of an individual microglia. B IBA1+ cell density normalized to DAPI in % and C soma volume (in µm3) as obtained from slices as shown in A. Statistical analysis was respectively performed using unpaired t-test. D Representative stainings of IBA1 (left) and merge with DAPI (right; IBA1 = green, DAPI = blue) of brain slices from tumor-bearing WT (n = 7) and KO (n = 7) in three different brain regions. Ipsilateral: Outside of the tumor in the ipsilateral hemisphere. Invasive edge (IE): Border region from tumor to non-tumor brain tissue, defined by the RFP signal and DAPI density. Core: Core tumor tissue area. Scale bar represents 40 µm. The inserts show an expanded magnification of an individual microglia. The bar graph on the right summarizes the percentage of IBA1+ cells normalized to the DAPI+ cells for these three tissue regions. Statistical analysis was performed using 2-way ANOVA with Sidak´s multiple comparisons test. E Representative staining of MHCII (left), IBA1 (middle) and merge with DAPI (right; MHCII = green, IBA1 = red, DAPI = blue) of brain slices from tumor-bearing WT (n = 7) and KO (n = 6). Scale bar represents 50 µm. Statistical analysis was performed using an unpaired t-test. Error bars represent SD. *p < 0.05, **p < 0.01, ***p < 0.001, ****p < 0.0001
Fig. 4
Fig. 4
Loss of host-derived GPNMB promotes a pro-inflammatory tumor immune microenvironment in a murine glioma model. A Representative core region staining of CD3 (left), Ki-67 and merge with DAPI (right; CD3 = red, Ki-67 = green, DAPI = blue) of brain slices from tumor-bearing WT and KO. Scale bar represents 20 µm. The graphs (Top left, core, CD3+DAPI+: WT n = 7, KO n = 7; Top right, invasive edge (IE), CD3+DAPI+: WT n = 7, KO n = 7; Bottom left, core, CD3+Ki-67+DAPI+: WT n = 7, KO n = 7; Bottom right, IE, CD3+Ki-67+DAPI+: WT n = 7, KO n = 6) show the summary data from WT and KO mice. B Representative core region staining of CD8 (left) and merge with DAPI (right; CD8 = green, DAPI = blue) of brain slices from tumor-bearing WT and KO. Scale bar represents 40 µm. The graphs (left, core: WT n = 7, KO n = 7; right, IE: WT n = 7, KO n = 7) show the summary data from WT and KO mice. C Representative core region staining of Gzmb (left) and merge with DAPI (right; Gzmb = red, DAPI = blue) of brain slices from tumor-bearing WT and KO. Scale bar represents 40 µm. The graphs (left, core: WT n = 7, KO n = 7; right, IE: WT n = 7, KO n = 7) show the summary data from WT and KO mice. D Representative core region staining of Foxp3 (left) and merge with DAPI (right; Foxp3 = red, DAPI = blue) of brain slices from tumor-bearing WT and KO. Scale bar represents 40 µm. The graphs (left, core: WT n = 7, KO n = 7; right, IE: WT n = 7, KO n = 7) show the summary data from WT and KO mice. Statistical analysis was performed using an unpaired t-test. Error bars represent SD. *p < 0.05, **p < 0.01, ***p < 0.001, ****p < 0.0001
Fig. 5
Fig. 5
Loss of host-derived GPNMB impairs tumor growth in OBS cultures injected with glioma cells with low and high intrinsic expression of GPNMB. A RT-qPCR of GPNMB expression relative to cultured murine astrocytes (n = 3) in cultured RCAS-PDGFb cells (n = 3) and the GL261 glioma cell line (n = 3). Statistical analysis was performed using one-way ANOVA with Tukey’s multiple comparisons test. B Western Blot of total GPNMB protein isolated from cultured RCAS-PDGFb, GL261 glioma cells, cultured MG (neonatal) and MG (adult). GAPDH expression serves as a reference. Each column represents an individual batch of culture (n = 3). C OBS from WT and KO animals injected with cultured PDGFb-driven RCAS-RFP glioma cells. Images are shown on the left. Top row: Orthogonal view on RFP immunofluorescence based on z-stack and tile scanning. Bottom row: representative 3D-reconstruction in Imaris based on z-stack and tile scanning. The graph on the right summarizes the volumes (in mm3) of WT (n = 11) and KO (n = 9) tumors as determined from the scans. D OBS injected with cultured mCherry-GL261 glioma cells. Images are shown on the left. Top row: Orthogonal view on mCherry immunofluorescence based on z-stack and tile scanning. Bottom row: representative 3D-reconstruction in Imaris based on z-stack and tile scanning. The graph on the right summarizes the volumes (in mm3) of WT (n = 30) and KO (n = 42) tumors as determined from the scans. The scale bars represent 500 µm. Statistical analysis was performed using unpaired t-test. Error bars represent SD. ****p < 0.0001, ns, not significant
Fig. 6
Fig. 6
TAMs are the predominant source of GPNMB in resection tissue from GBM patients. A RT-qPCR of GPNMB expression in CD11b+ and CD11b cells separated from 9 patients with GBMs. Statistical analysis was performed using paired t-test. B Representative staining of patient-derived GBM and non-tumor slices stained for GPNMB (left), IBA1 (middle) and merge with DAPI (right; GPNMB = red, IBA1 = green, DAPI, blue). The image to the right shows a magnified view in the tumor slice. Scale bars, including the magnification, represent 20 µm. C Summary of the percentage of IBA1+/GPNMB+ cells of the samples from GBM (n = 9) and non-tumor (n = 3). Statistical analysis was performed using unpaired t-test. Error bars represent SD. D Pearson correlation of tumor-associated macrophage/microglia markers (y-axis) with GPNMB (x-axis). Top: CD204 (r = 0.84; p ≤ 0.0001), OPN (r = 0.81; p ≤ 0.0001) and CD68 (r = 0.79; p ≤ 0.0001). Middle: PTPRC/CD45 (r = 0.70; p ≤ 0.0001), CD163 (r = 0.70; p ≤ 0.0001) and CD204 (r = 0.59; p ≤ 0.0001). Bottom: HEXB (r = 0.64; p ≤ 0.0001), TMEM119 (r = 0.37; p ≤ 0.0001) and P2RY12 (r = 0.31; p ≤ 0.0001). Data derived from all primary GBM samples of the CGGA data set (n = 225). E GPNMB gene expression of non-immune cell population (CD45), microglia (MG), macrophages (MPH) and neutrophils in human glioma with IDH wildtype (IDHwt), IDH mutant (IDHmut) and brain metastasis (BrM) using the Brain Tumor Immune Micro Environment dataset [18]. Unlabeled statistical analysis were performed in comparison to the non-immune cell population with 2way ANOVA and Tukey's multiple comparisons test. Error bars represent min to max. *p < 0.05, **p < 0.01, ***p < 0.001, ****p < 0.0001. F The Rho value of correlation between uncommitted (M0, left), pro-inflammatory (M1, middle) and anti-inflammatory (M2, right) macrophage infiltration level (based on TIMER algorithm) and GPNMB gene expression
Fig. 7
Fig. 7
High GPNMB expression in GBM are negatively prognostic for the disease course and positively correlated for the expression of immune checkpoint markers. A Kaplan–Meier survival curves of GBM patients based on GPNMB expression in the CGGA data set. Left: Cutoff set by median GPNMB expression into GPNMBhigh (n = 188, events = 162) and GPNMBlow (n = 189, events = 152). Right: Cutoff by top/low 25% GPNMB expression set into GPNMBhigh (top 25%; n = 94, events = 81) and GPNMBlow (low 25%; n = 94, events = 73). B Kaplan–Meier survival estimates of GBM patients based on GPNMB expression in the TCGA data set. Left: Cutoff set by median GPNMB expression into GPNMBhigh (n = 258, events = 223) and GPNMBlow (n = 255, events = 212). Right: Cutoff by top/low 25% GPNMB expression set into GPNMBhigh (top 25%; n = 128, events = 114) and GPNMBlow (low 25%; n = 128, events = 106). Statistical analysis was performed using Log-rank (Mantel–Cox) test, Gehan-Breslow-Wilcoxon test and Hazard Ratio (Mantel–Haenszel). C Gene expression of immune checkpoint markers (Top: PD-L1, PD-1, CTLA4, TIM3 and BTLA; Bottom: ICOS, ICOSLG, GATA3, CD47 and SIRP-alpha) in GPNMBhigh (top 25%; n = 94) and GPNMBlow (low 25%; n = 94) primary GBM. Data from CGGA. D Representative core region staining of PD-1 (left), CD3 (middle) and merge with DAPI (right; PD-1 = yellow, CD3 = red, DAPI = blue) of brain slices from tumor-bearing WT and KO. Scale bar represents 20 µm. The graphs (left, core: WT n = 6, KO n = 7; right, IE: WT n = 6, KO n = 7) show the summary data from WT and KO mice. Statistical analysis was performed using unpaired t-test. Error bars represent SD. *p < 0.05, **p < 0.01, ***p < 0.001, ****p < 0.0001
Fig. 8
Fig. 8
Tissue expression of CD44 is affected by GPNMB in the RCAS-PDGFb model and associated with GPNMB expression in human GBM. A Representative staining of CD44 (left) and merge with DAPI (right; CD44 = red, DAPI = blue) of brain slices from tumor-bearing WT and KO. Scale bar represents 50 µm. The graph on the right shows the summary data of the area of CD44 staining (in % of total area) from WT (n = 7) and KO (n = 6) mice. B Left: Gene expression of CD44 (Cutoff: median) in GPNMBhigh (n = 111) and GPNMBlow (n = 111) primary GBM. Data from CGGA. Right: Gene expression of CD44 (Cutoff: median) in GPNMBhigh (n = 262) and GPNMBlow (n = 263) primary GBM. Data from TCGA. C Left: Gene expression of CD44 in GPNMBhigh (top 25%; n = 55) and GPNMBlow (low 25%; n = 54) primary GBM. Data from CGGA. Right: Gene expression of CD44 in GPNMBhigh (top 25%; n = 130) and GPNMBlow (low 25%; n = 131) primary GBM. Data from TCGA. Statistical analysis was performed using unpaired t-test. Error bars represent SD. D Kaplan–Meier survival curves of GBM patients based on GPNMB expression in the CGGA (left) and TCGA (right) data set. Cutoff set by median of CD44 and GPNMB expression into GPNMBhighCD44high (CGGA: n = 87, events = 77; TCGA: n = 169, events = 149) and GPNMBlowCD44low (CGGA: n = 86, events = 66; TCGA: n = 170, events = 137). *p < 0.05, **p < 0.01, ***p < 0.001, ****p < 0.0001

References

    1. Louis DN, et al. The 2021 WHO classification of tumors of the central nervous system: a summary. Neuro Oncol. 2021;23:1231–1251. doi: 10.1093/neuonc/noab106. - DOI - PMC - PubMed
    1. Alexander BM, Cloughesy TF. Adult glioblastoma. JCO. 2017;35:2402–2409. doi: 10.1200/JCO.2017.73.0119. - DOI - PubMed
    1. Lim M, Xia Y, Bettegowda C, Weller M. Current state of immunotherapy for glioblastoma. Nat Rev Clin Oncol. 2018;15:422–442. doi: 10.1038/s41571-018-0003-5. - DOI - PubMed
    1. Quail DF, Joyce JA. The Microenvironmental landscape of brain tumors. Cancer Cell. 2017;31:326–341. doi: 10.1016/j.ccell.2017.02.009. - DOI - PMC - PubMed
    1. Gutmann DH, Kettenmann H. Microglia/brain macrophages as central drivers of brain tumor pathobiology. Neuron. 2019;104:442–449. doi: 10.1016/j.neuron.2019.08.028. - DOI - PMC - PubMed

Publication types