

Dietary quality and dietary greenhouse gas emissions in the USA: a comparison of the planetary health diet index, healthy eating index-2015, and dietary approaches to stop hypertension
- PMID: 38566176
- PMCID: PMC10988877
- DOI: 10.1186/s12966-024-01581-y
Dietary quality and dietary greenhouse gas emissions in the USA: a comparison of the planetary health diet index, healthy eating index-2015, and dietary approaches to stop hypertension
Abstract
Background: The Planetary Health Diet Index (PHDI) measures adherence to the dietary pattern presented by the EAT-Lancet Commission, which aligns health and sustainability targets. There is a need to understand how PHDI scores correlate with dietary greenhouse gas emissions (GHGE) and how this differs from the carbon footprints of scores on established dietary recommendations. The objectives of this study were to compare how the PHDI, Healthy Eating Index-2015 (HEI-2015) and Dietary Approaches to Stop Hypertension (DASH) relate to (a) dietary GHGE and (b) to examine the influence of PHDI food components on dietary GHGE.
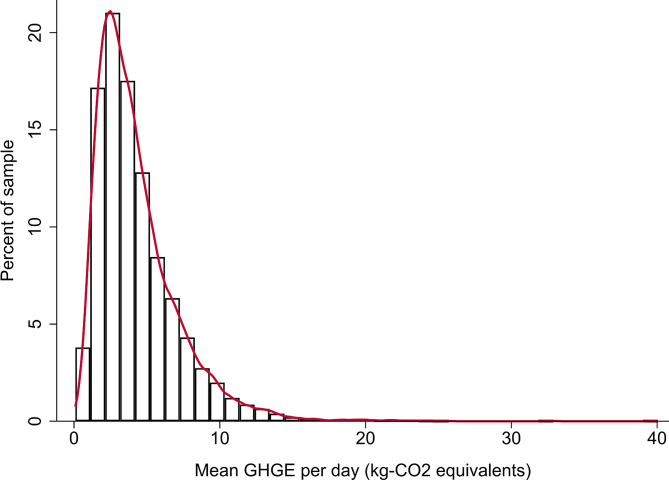
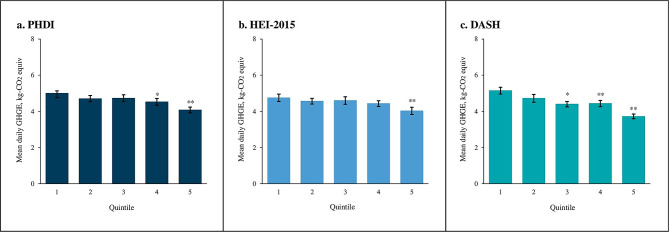
Methods: We used life cycle assessment data from the Database of Food Recall Impacts on the Environment for Nutrition and Dietary Studies to calculate the mean dietary GHGE of 8,128 adult participants in the 2015-2016 and 2017-2018 cycles of the National Health and Nutrition Examination Survey (NHANES). Poisson regression was used to estimate the association of (a) quintiles of diet score and (b) standardized dietary index Z-scores with dietary GHGE for PHDI, HEI-2015, and DASH scores. In secondary analyses, we used Poisson regression to assess the influence of individual PHDI component scores on dietary GHGE.
Results: We found that higher dietary quality on all three indices was correlated with lower dietary GHGE. The magnitude of the dietary quality-dietary GHGE relationship was larger for PHDI [-0.4, 95% CI (-0.5, -0.3) kg CO2 equivalents per one standard deviation change] and for DASH [-0.5, (-0.4, -0.6) kg CO2-equivalents] than for HEI-2015 [-0.2, (-0.2, -0.3) kg CO2-equivalents]. When examining PHDI component scores, we found that diet-related GHGE were driven largely by red and processed meat intake.
Conclusions: Improved dietary quality has the potential to lower the emissions impacts of US diets. Future efforts to promote healthy, sustainable diets could apply the recommendations of the established DASH guidelines as well as the new guidance provided by the PHDI to increase their environmental benefits.
Keywords: 24-hour recalls; Dietary approaches to stop hypertension; Dietary greenhouse gas emissions; Dietary patterns; EAT-Lancet Commission; Healthy eating index; NHANES; Planetary Health Diet.
© 2024. The Author(s).
Conflict of interest statement
The authors declare that they have no competing interests.
Figures
References
-
- Caro D, Davis SJ, Bastianoni S, Caldeira K. Greenhouse gas emissions due to meat production in the last fifty years. Quantification of climate variability, adaptation and mitigation for agricultural sustainability. 2017:27–37.
-
- Anastasiou K, Baker P, Hadjikakou M, Hendrie G, Lawrence M. A conceptual framework for understanding the environmental impacts of ultra-processed foods and implications for sustainable food systems. J Clean Prod. 2022:133155.
MeSH terms
Substances
Grants and funding
LinkOut - more resources
Full Text Sources
Medical
