. 2024 Apr 2;16(1):49.
doi: 10.1186/s13073-024-01320-9.

Single-cell profiling of response to neoadjuvant chemo-immunotherapy in surgically resectable esophageal squamous cell carcinoma

Affiliations

Single-cell profiling of response to neoadjuvant chemo-immunotherapy in surgically resectable esophageal squamous cell carcinoma

Gang Ji et al. Genome Med. .

Abstract

Background: The efficacy of neoadjuvant chemo-immunotherapy (NAT) in esophageal squamous cell carcinoma (ESCC) is challenged by the intricate interplay within the tumor microenvironment (TME). Unveiling the immune landscape of ESCC in the context of NAT could shed light on heterogeneity and optimize therapeutic strategies for patients.

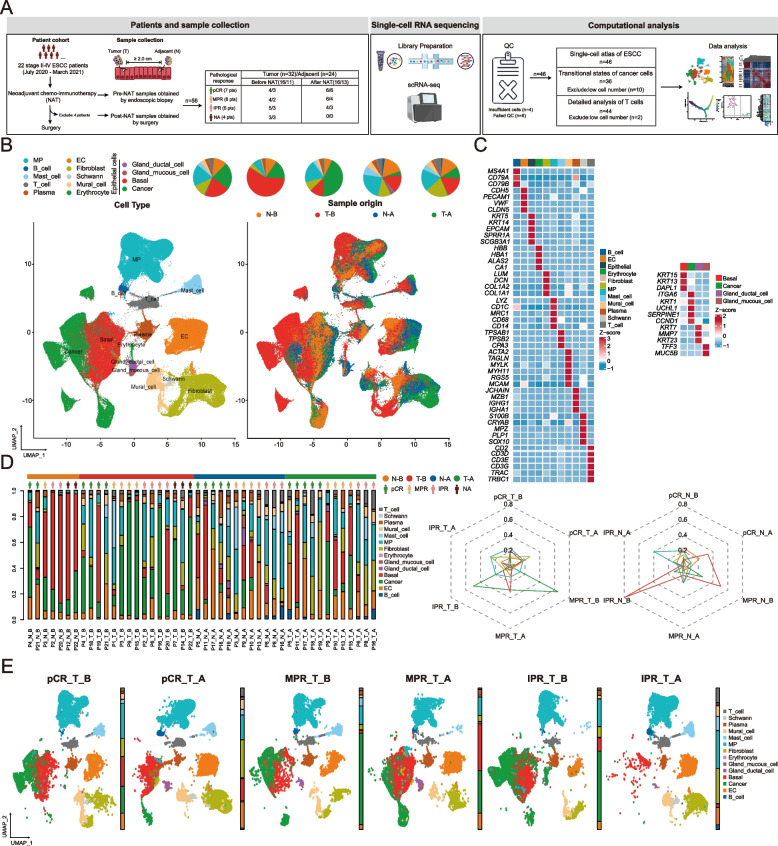
Methods: We analyzed single cells from 22 baseline and 24 post-NAT treatment samples of stage II/III ESCC patients to explore the association between the immune landscape and pathological response to neoadjuvant anti-PD-1 combination therapy, including pathological complete response (pCR), major pathological response (MPR), and incomplete pathological response (IPR).

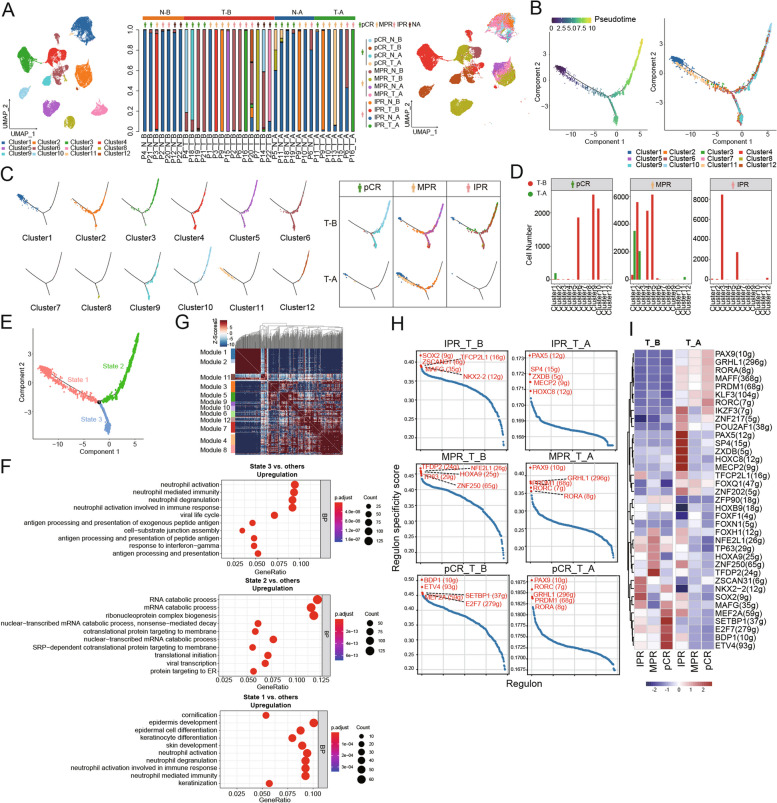
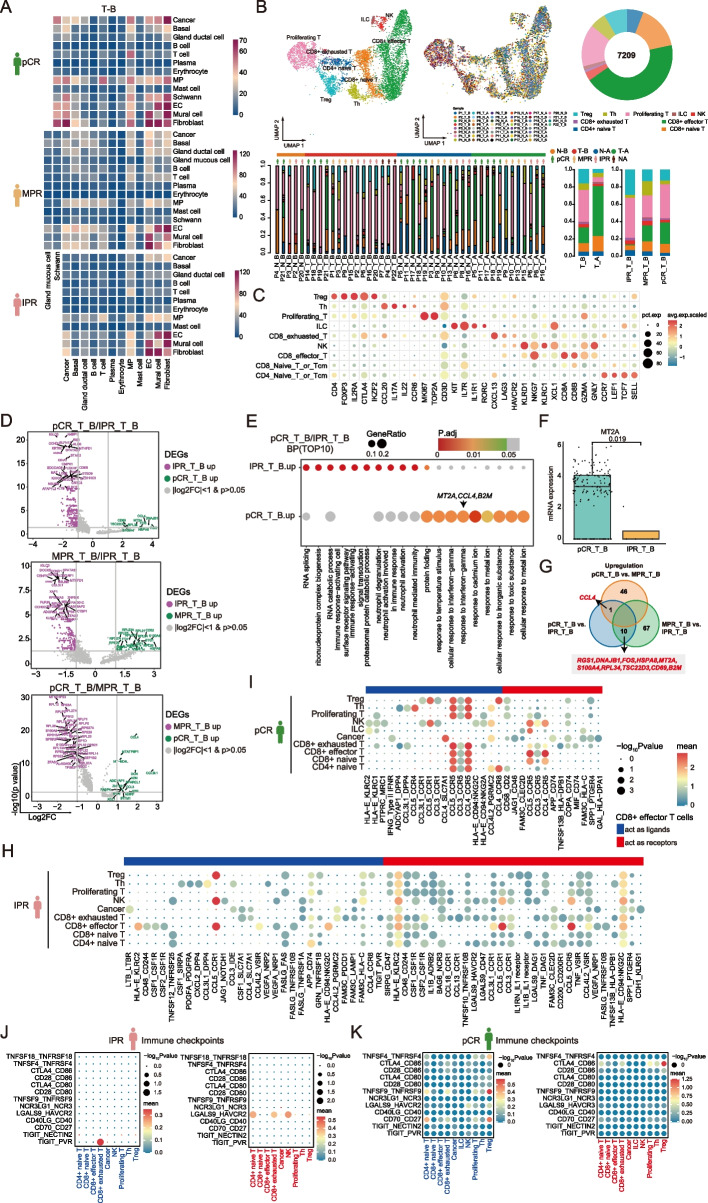
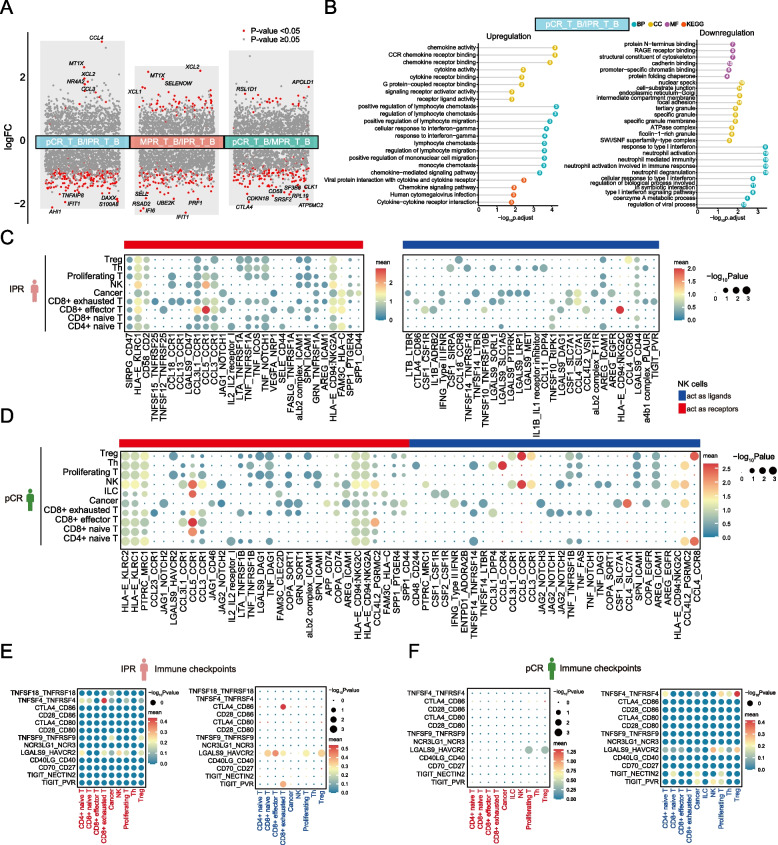
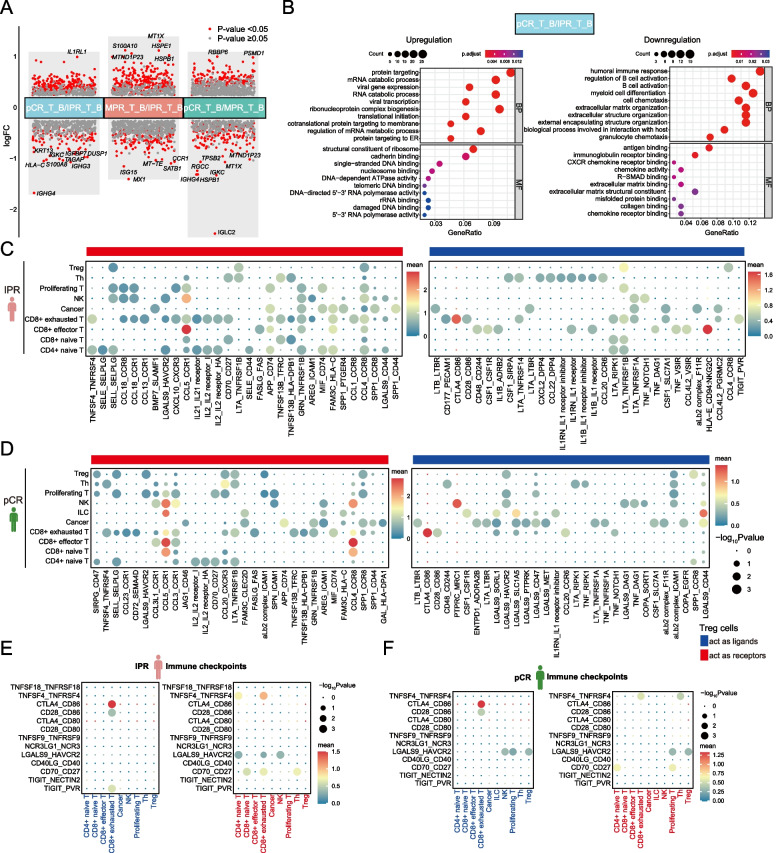
Results: Single-cell profiling identified 14 major cell subsets of cancer, immune, and stromal cells. Trajectory analysis unveiled an interesting link between cancer cell differentiation and pathological response to NAT. ESCC tumors enriched with less differentiated cancer cells exhibited a potentially favorable pathological response to NAT, while tumors enriched with clusters of more differentiated cancer cells may resist treatment. Deconvolution of transcriptomes in pre-treatment tumors identified gene signatures in response to NAT contributed by specific immune cell populations. Upregulated genes associated with better pathological responses in CD8 + effector T cells primarily involved interferon-gamma (IFNγ) signaling, neutrophil degranulation, and negative regulation of the T cell apoptotic process, whereas downregulated genes were dominated by those in the immune response-activating cell surface receptor signaling pathway. Natural killer cells in pre-treatment tumors from pCR patients showed a similar upregulation of gene expression in response to IFNγ but a downregulation of genes in the neutrophil-mediated immunity pathways. A decreased cellular contexture of regulatory T cells in ESCC TME indicated a potentially favorable pathological response to NAT. Cell-cell communication analysis revealed extensive interactions between CCL5 and its receptor CCR5 in various immune cells of baseline pCR tumors. Immune checkpoint interaction pairs, including CTLA4-CD86, TIGIT-PVR, LGALS9-HAVCR2, and TNFSF4-TNFRSF4, might serve as additional therapeutic targets for ICI therapy in ESCC.

Conclusions: This pioneering study unveiled an intriguing association between cancer cell differentiation and pathological response in esophageal cancer patients, revealing distinct subgroups of tumors for which neoadjuvant chemo-immunotherapy might be effective. We also delineated the immune landscape of ESCC tumors in the context of clinical response to NAT, which provides clinical insights for better understanding how patients respond to the treatment and further identifying novel therapeutic targets for ESCC patients in the future.

Keywords: Esophageal squamous cell carcinoma; Neoadjuvant therapy; Pathological response; Single-cell sequencing.


Conflict of interest statement

SW and QXO are employees of Nanjing Geneseeq Technology Inc. The other authors declare that they have no competing interests.

Figures

Fig.1
Fig.1
Single-cell atlas of ESCC. A Schematic demonstration of the experimental workflow for single-cell RNA sequencing and computational analysis. B UMAP embedding overlaid with unsupervised cluster cell type annotations (left), and sample origin annotations (right). Pie charts (top) demonstrate the proportion of each cell cluster based on the cell type or sample origin classifications. C Average expression profile of canonical marker genes to separate cell populations across 46 samples collected from 22 ESCC patients. D The proportion of cell subsets across 46 samples (left) and the proportion change of cells across 12 sample groups (right). E UMAP profiles delineating cell subsets collected from ESCC tumors, categorized based on treatment status and pathological response to neoadjuvant chemo-immunotherapy. pCR, pathological complete response; MPR, major pathological response; IPR, incomplete pathological response; T, tumor; N, normal tissue; B, pre-treatment; A, post-treatment
Fig. 2
Fig. 2
Transitional states of cancer cells revealed by trajectory mapping. A UMAP embedding of cancer cells overlaid with unsupervised cluster cell type annotations (left), proportional sample contributions to each cell type cluster (middle), and sample label (right). B Pseudotime trajectory of ESCC cancer cells in a two-dimensional state space inferred by the “Monocle 2” method. C Cancer cells mapped to the branched structure in the trajectories (left) and the distribution of cancer clusters in ESCC tumors stratified by treatment and pathological response (right). D Cell number count in cancer clusters identified in ESCC tumors of patients before (T_B) and after (T_A) neoadjuvant chemo-immunotherapy. E Pseudotime trajectory of ESCC cancer cells showing three differentiation states. F Investigation of biological processes (BP) through Gene Ontology (GO) pathway enrichment analysis in cancer cells across three differentiation states. G Heatmap shows the top 500 genes with significant autocorrelation grouped into 12 gene modules based on pairwise correlations of gene expression in cancer cells. H The scatter plots show the expression of the top five highly expressed regulons in each of the six cell subsets. I Heatmap of the area under the curve (AUC) scores of expression regulation by transcription factors in ESCC tumors stratified by treatment and pathological response, estimated by SCENIC
Fig. 3
Fig. 3
Characterization of CD8 + effector T cells within the ESCC TME. A The CellPhoneDB-generated heatmap shows the count of cell–cell interactions in baseline tumors obtained from pCR, MPR, and IPR patients. B UMAP embedding of T cells overlaid with cluster cell type annotations (left), sample label (middle), and proportional sample contributions to each cell type cluster (right). C Dot plots of canonical T cell marker gene expression in each T cell lineage. Dot size and color indicate the fraction of expressing cells and normalized expression levels, respectively. D Volcano plots show the differentially expressed genes (DEGs) in subgroup analysis. E Gene Ontology (GO) pathway enrichment analysis of the top 10 enriched biological processes (BP) for baseline ESCC tumor in pCR patients compared to IPR patients. F Box plots show the mRNA expression of MT2A in baseline ESCC tumors of pCR and IPR patients at the single-cell level. G The Venn diagram shows the intersections of three gene sets. Gene sets were based on DEG analysis comparing baseline tumors of patients with different pathological responses to neoadjuvant chemo-immunotherapy. H, I Dot plots show the top 30 (based on the expression level) ligand-receptor interactions from CD8 + effector T cells obtained from baseline ESCC tumors of IPR (H) and pCR patients (I). The size of the circle represents the P values, and the color of the circle indicates the average expression level of interacting pairs. The cell clusters labeled in blue and red on the x-axis indicate that CD8 + effector T cells act as ligands and receptors in the interaction pairs, respectively. J, K Dot plots illustrate a range of immune checkpoint interaction pairs involving CD8 + effector T cells and various other cell types obtained from pre-treatment ESCC tumors of IPR (J) and pCR patients (K)
Fig. 4
Fig. 4
Transcriptional analysis of NK cells in baseline tumors of pCR and IPR patients. A Differentially expressed genes (DEGs) in subgroup analysis. Significant P values were labeled in red, and the y-axis represents the log2 fold change. B GO and KEGG pathway enrichment analysis for baseline ESCC tumor in pCR patients compared to IPR patients. The length and color of the bars represent enrichment significance and classifications. The number inside the spheres represents the number of related mRNAs enriched in the specific pathway. C, D Dot plots show the top 30 ligand-receptor interactions from NK cells obtained from baseline ESCC tumors of IPR (C) and pCR patients (D). The size of the circle represents the P values, and the color of the circle indicates the average expression level of interacting pairs. The cell clusters labeled in blue and red on the x-axis indicate that NK cells act as ligands and receptors in the interaction pairs, respectively. E, F Dot plots show the immune checkpoint ligand-receptor interactions from NK cells obtained from baseline ESCC tumors of IPR (E) and pCR patients (F)
Fig. 5
Fig. 5
Regulatory T cells play an immunosuppressive role in TME. A Differentially expressed genes (DEGs) in subgroup analysis. Significant P values were labeled in red, and the y-axis represents the log2 fold change. The top 10 DEGs were denoted. B GO pathway enrichment analysis for baseline ESCC tumor in pCR patients compared to IPR patients. The x-axis represents the ratio of mRNAs enriched in GO terms. The y-axis represents the enriched pathway. The color and size of each bubble represent enrichment significance and the number of related mRNAs enriched in the pathway, respectively. C, D Dot plots illustrate the top 30 ligand-receptor interactions from Treg cells obtained from baseline ESCC tumors of IPR (C) and pCR patients (D). The size of the circle represents the P values, and the color of the circle indicates the average expression level of interacting pairs. The cell clusters labeled in blue and red on the x-axis indicate that Treg cells act as ligands and receptors in the interaction pairs, respectively. E, F Dot plots show the immune checkpoint ligand-receptor interactions from Treg cells obtained from baseline ESCC tumors of IPR (E) and pCR patients (F)

References

    1. Uhlenhopp DJ, Then EO, Sunkara T, Gaduputi V. Epidemiology of esophageal cancer: update in global trends, etiology and risk factors. Clin J Gastroenterol. 2020;13(6):1010–1021. doi: 10.1007/s12328-020-01237-x. - DOI - PubMed
    1. Sung H, Ferlay J, Siegel RL, Laversanne M, Soerjomataram I, Jemal A, Bray F. Global Cancer Statistics 2020: GLOBOCAN Estimates of Incidence and Mortality Worldwide for 36 Cancers in 185 Countries. CA Cancer J Clin. 2021;71(3):209–249. doi: 10.3322/caac.21660. - DOI - PubMed
    1. Napier KJ, Scheerer M, Misra S. Esophageal cancer: A Review of epidemiology, pathogenesis, staging workup and treatment modalities. World J Gastrointest Oncol. 2014;6(5):112–120. doi: 10.4251/wjgo.v6.i5.112. - DOI - PMC - PubMed
    1. van Hagen P, Hulshof MC, van Lanschot JJ, Steyerberg EW, van Berge HMI, Wijnhoven BP, et al. Preoperative chemoradiotherapy for esophageal or junctional cancer. N Engl J Med. 2012;366(22):2074–2084. doi: 10.1056/NEJMoa1112088. - DOI - PubMed
    1. Yang H, Liu H, Chen Y, Zhu C, Fang W, Yu Z, et al. Neoadjuvant Chemoradiotherapy Followed by Surgery Versus Surgery Alone for Locally Advanced Squamous Cell Carcinoma of the Esophagus (NEOCRTEC5010): A Phase III Multicenter, Randomized. Open-Label Clinical Trial J Clin Oncol. 2018;36(27):2796–2803. - PMC - PubMed

Publication types