. 2024 Apr 2;22(1):145.
doi: 10.1186/s12951-024-02438-z.

MiR26a reverses enzalutamide resistance in a bone-tumor targeted system with an enhanced effect on bone metastatic CRPC

Affiliations

MiR26a reverses enzalutamide resistance in a bone-tumor targeted system with an enhanced effect on bone metastatic CRPC

Yuanyuan Wang et al. J Nanobiotechnology. .

Abstract

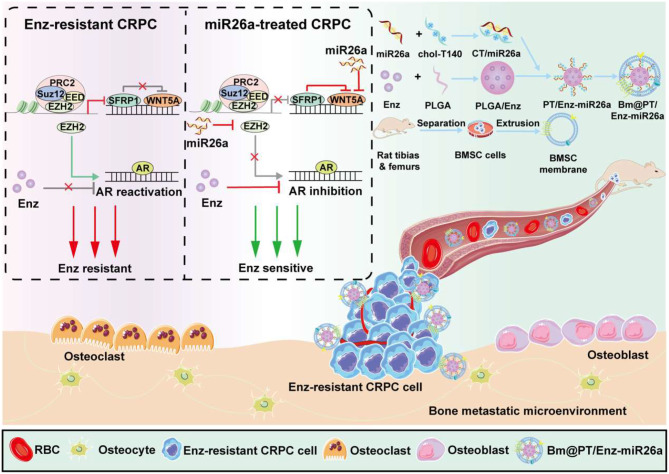
Resistance to androgen receptor (AR) inhibitors, including enzalutamide (Enz), as well as bone metastasis, are major challenges for castration-resistant prostate cancer (CRPC) treatment. In this study, we identified that miR26a can restore Enz sensitivity and inhibit bone metastatic CRPC. To achieve the highest combination effect of miR26a and Enz, we developed a cancer-targeted nano-system (Bm@PT/Enz-miR26a) using bone marrow mesenchymal stem cell (BMSC) membrane and T140 peptide to co-deliver Enz and miR26a. The in vitro/in vivo results demonstrated that miR26a can reverse Enz resistance and synergistically shrink tumor growth, invasion, and metastasis (especially secondary metastasis) in both subcutaneous and bone metastatic CRPC mouse models. We also found that the EZH2/SFRP1/WNT5A axis may be involved in this role. These findings open new avenues for treating bone metastatic and Enz-resistant CRPC.

Keywords: Bone metastatic CRPC; Castration-resistant prostate cancer (CRPC); Drug resistance; Enzalutamide; Nanoparticles.


Conflict of interest statement

The authors declare no conflict of interest.

The authors declare no competing interests.

Figures

Scheme 1
Scheme 1
Schematic illustrations of the construction and mechanism of action of Bm@PT/Enz-miR26a in Bone-tumor microenvironment
Fig. 1
Fig. 1
The mechanism of regulatory relationships among EZH2, SFRP1, and WNT5A. (A) The miR26a level in C4-2B and C4-2B EnzR cells. n = 3, mean ± SD, ***p < 0.001, one-way ANOVA. (B) Statistical analysis of each group. n = 5, mean ± SD, *p < 0.05, ****p < 0.0001, one-way ANOVA. (C) In vitro cell migration and invasion assays. Microscope images of anti-migration and anti-invasion effects in each group (visualized with 0.1% crystal violet, scale bar: 100 μm). C4-2B EnzR cells were incubated with miR26a mimic and miR26a inhibitor, respectively (miR26a mimic/inhibitor: 1 µg·mL− 1). (D) Dual luciferase reporter assays were used to verify the direct targeting of miR26a on EZH2 and WNT5A, h-EZH2-3’UTR/h-WNT5A-3’UTR: 0.16 µg, hsa-miR-26a-5p/NC: 5 pmol. n = 3, mean ± SD, ****p < 0.0001, one-way ANOVA. (E) Protein expressions of EZH2, WNT5A, H3K27me3, and SFRP1 were detected via western blotting in siEZH2, siSFRP1, and their negative control groups (siNC1: EZH2 negative control, siNC2: SFRP1 negative control). (F) Statistical difference of the ratio of gray values. (G) Protein expressions of WNT5A were detected via western blotting in siEZH2 + siSFRP1 and siEZH2 + siNC1 groups. (H) Statistical difference of the ratio of gray values. n = 3, mean ± SD, **p < 0.01, ***p < 0.001, ****p < 0.0001, one-way ANOVA
Fig. 2
Fig. 2
Synthesis and characterization of Bm@PT/Enz-miR26a. (A) The agarose gel electrophoresis results of different N/P ratios of CT/pEGFP. (B) Microscope images of transfection ability of PEI and CT in HeK-293T cells at different N/P ratios. Scale bar: 100 μm. (C) Statistical analysis of the number of EGFP-positive cells. n = 3, mean ± SD, ****p < 0.0001, one-way ANOVA. (D) Optimum ratio of PLGA to CT. (E) Optimum ratio of nanoparticles to BMSC membrane. (F) TEM images of PT, Bm@PT, and Bm@PT/Enz-miR26a. Scale bar: 50 nm. (G) High-Content Analysis System images of intracellular distribution. Nile/miFAM: 20 ng·mL− 1. Scale bar: 100 μm. (H–I) Cellular uptake of nanoparticles by flow cytometry. Nile/miFAM: 20 ng·mL− 1, n = 3, mean ± SD, *p < 0.05, **p < 0.01, ***p < 0.001, one-way ANOVA. (J) High-Content Analysis System images of lysosome escape. C6: 20 ng·mL− 1, Lysotracker red: 50 ng·mL− 1. Scale bar: 100 μm
Fig. 3
Fig. 3
In vitro efficacy of Bm@PT/Enz-miR26a. (A–D) MiR26a and Enz synergistically inhibited CRPC cell proliferation. Significant decrease in cell viability when C4-2B and C4-2B EnzR cells were treated with Bm@PT/Enz-miR26a for 48 h compared with other groups (Enz: 0 ∼ 200 µg·mL− 1, miR26a: 0 ∼ 2 µg·mL− 1). n = 3, mean ± SD. (E) The representative results of apoptosis of C4-2B EnzR cells treated with each group for 48 h. (Enz: 30 µg·mL− 1, miR26a: 0.25 µg·mL− 1). (F) Statistical results of cell apoptosis in each group. n = 3, mean ± SD, ***p < 0.001, ****p < 0.0001, one-way ANOVA. (G) Combination therapy with miR26a and Enz induced G0/G1 cell cycle arrest (Enz: 25 µg·mL− 1, miR26a: 0.2 µg·mL− 1). (H–I) Microscope images of anti-migration effects and anti-invasion effects in each group (visualized with 0.1% crystal violet, scale bar: 50 μm). C4-2B EnzR cells were co-incubated with each group for 24 h (anti-migration assay) and 48 h (anti-invasion assay), respectively (Enz: 50 µg·mL− 1, miR26a: 0.5 µg·mL− 1)
Fig. 4
Fig. 4
The penetration and antitumor efficacy in 3D tumor models and in vivo biodistribution. (A) 3D tumor spheroid model. Blue fluorescence: DAPI, green fluorescence: DiO, red fluorescence: DiD, Scale bar: 100 μm. (B) The images of in vitro tumor spheroids penetration of each group were acquired by CLSM at 10× objective magnification using Z-stack imaging from the bottom of the spheroids at 20 μm intervals. DiO-stained C4-2B EnzR cells and DiD-stained MG-63 cells were seeded in the 96-well plates at the ratio of 1:1. (DiR: 20 µg·mL− 1, miFAM: 0.5 µg·mL− 1). Scale bar: 100 μm. (C) The tumor spheroids with a diameter of about 400 μm were co-incubated with different formulations for 48 h (Enz: 50 µg·mL− 1, miR26a: 1 µg·mL− 1) and images were acquired by CLSM. Scale bar: 100 μm. Representative small animal living images of the biodistribution of each group in (D) subcutaneous CRPC and (E) BmCRPC mouse models at 0–24 h. Free DiR and DiR-loaded Bm/PT nanoparticles were injected at a concentration of 10 mg·kg− 1. (F) Distribution in major organs of each group in subcutaneous CRPC and (G) BmCRPC mouse models. Quantified distribution in major organs of each group in (H) subcutaneous CRPC and I. BmCRPC mouse models. n = 3, mean ± SD, *p < 0.05, **p < 0.01, one-way ANOVA
Fig. 5
Fig. 5
In vivo therapeutic effects of Bm@PT/Enz-miR26a in two models. (A–B) Tumor volume growth in subcutaneous CRPC and BmCRPC mouse models over 12 days. n = 5, mean ± SD, **p < 0.01, ***p < 0.001, ****p < 0.0001, one-way ANOVA. (C–D) Tumor weight growth in subcutaneous CRPC and BmCRPC mouse models. n = 5, mean ± SD, ****p < 0.0001, one-way ANOVA. (E–F) Body weight growth in subcutaneous CRPC and BmCRPC mouse models over 12 days. n = 5, mean ± SD. (G–H) Survival time of tumor-bearing mice in subcutaneous CRPC and BmCRPC mouse models. n = 5, mean ± SD, ****p < 0.0001, one-way ANOVA. (I–J) TUNEL assay was performed to evaluate the apoptosis of tumor cells in subcutaneous CRPC and BmCRPC mouse models. TUNEL: green, Scale bar: 50 μm
Fig. 6
Fig. 6
In vivo safety and bone protection of Bm@PT/Enz-miR26a in two models. (A–B) The H&E images of heart, liver, spleen, lung, kidney, tumor, and bone (left hind limb tibia) of each group in (A) subcutaneous CRPC and (B) BmCRPC mouse models. Scale bar: 100 μm. Red arrow: tumor metastatic sites. (C–D). The biochemical analysis of mouse blood samples in (C) subcutaneous CRPC and (D) BmCRPC mouse models. n = 3, mean ± SD. (E) Metastasis in the heart and lungs of tumor-bearing mice in BmCRPC model. Yellow circle: tumor. (F) The micro-CT images of each group in the BmCRPC mouse model. n = 5, red arrows: bone damaged sites. (G–H) The miR26a level of each group in (G) subcutaneous CRPC and (H) BmCRPC mouse models. n = 3, mean ± SD, ****p < 0.0001, one-way ANOVA. (I–J) Related protein expressions of each group in (I) subcutaneous CRPC and (J) BmCRPC mouse models. (K) Immunofluorescence results of each group in subcutaneous CRPC model. Scale bar: 20 μm. (L) Immunofluorescence results of each group in the BmCRPC mouse model. Scale bar: 20 μm. (M) Mean fluorescence intensity in subcutaneous CRPC model. n = 3, mean ± SD, ****p < 0.0001, one-way ANOVA. (N) Mean fluorescence intensity in BmCRPC mouse model. n = 3, mean ± SD, ****p < 0.0001, one-way ANOVA

References

    1. Zong Y, Goldstein AS. Adaptation or selection–mechanisms of castration-resistant prostate cancer. Nat Rev Urol. 2013;10:90–8. doi: 10.1038/nrurol.2012.237. - DOI - PubMed
    1. Howard N, Clementino M, Kim D, Wang L, Verma A, Shi X, Zhang Z, DiPaola RS. New developments in mechanisms of prostate cancer progression. Semin Cancer Biol. 2019;57:111–6. doi: 10.1016/j.semcancer.2018.09.003. - DOI - PubMed
    1. Logothetis C, Morris MJ, Den R, Coleman RE. Current perspectives on bone metastases in castrate-resistant prostate cancer. Cancer Metastasis Rev. 2018;37:189–96. doi: 10.1007/s10555-017-9719-4. - DOI - PMC - PubMed
    1. Gartrell BA, Saad F. Managing bone metastases and reducing skeletal related events in prostate cancer. Nat Rev Clin Oncol. 2014;11:335–45. doi: 10.1038/nrclinonc.2014.70. - DOI - PubMed
    1. Chen WS, Aggarwal R, Zhang L, Zhao SG, Thomas GV, Beer TM, Quigley DA, Foye A, Playdle D, Huang J, Lloyd P, Lu E, Sun D, Guan X, Rettig M, Gleave M, Evans CP, Youngren J, True L, Lara P, Kothari V, Xia Z, Chi KN, Reiter RE, Maher CA, Feng FY, Small EJ, Alumkal JJ. West coast prostate Cancer Dream, genomic drivers of poor prognosis and Enzalutamide Resistance in Metastatic Castration-resistant prostate Cancer. Eur Urol. 2019;76:562–71. doi: 10.1016/j.eururo.2019.03.020. - DOI - PMC - PubMed