

Association between stress hyperglycemia ratio and diabetes mellitus mortality in American adults: a retrospective cohort study and predictive model establishment based on machine learning algorithms (NHANES 2009-2018)
- PMID: 38566220
- PMCID: PMC10986058
- DOI: 10.1186/s13098-024-01324-w
Association between stress hyperglycemia ratio and diabetes mellitus mortality in American adults: a retrospective cohort study and predictive model establishment based on machine learning algorithms (NHANES 2009-2018)
Abstract
Background: Stress hyperglycemia is a physiological response of the body under stress to make adaptive adjustments in response to changes in the internal environment. The stress hyperglycemia ratio (SHR) is a new indicator after adjusting the basal blood glucose level of the population. Previous studies have shown that SHR is associated with poor prognosis in many diseases, such as cardiovascular and cerebrovascular diseases and delirium in elderly patients. However, there are currently no studies on the correlation between SHR and the general U.S.
Population: The purpose of this study was to examine the association between SHR and adverse outcomes among adults in the United States in general.
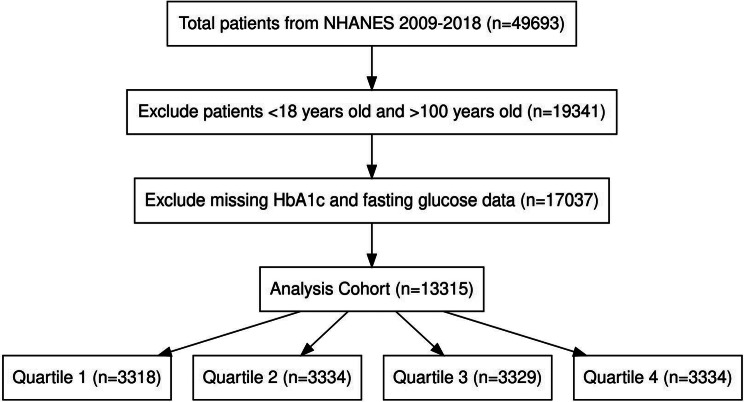
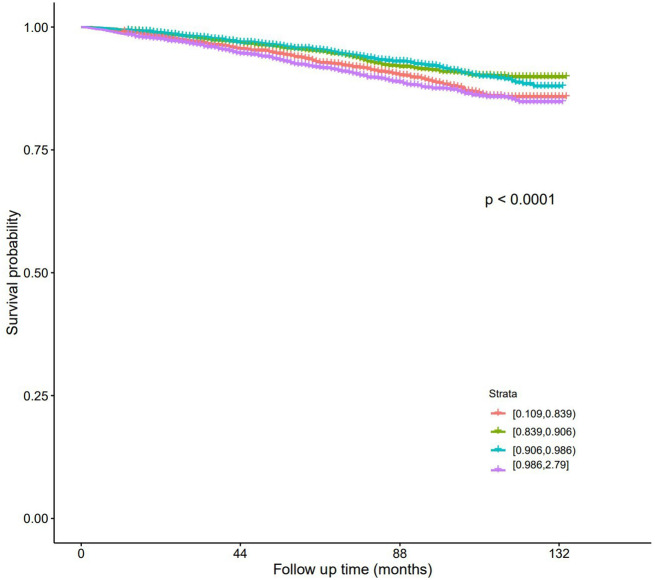
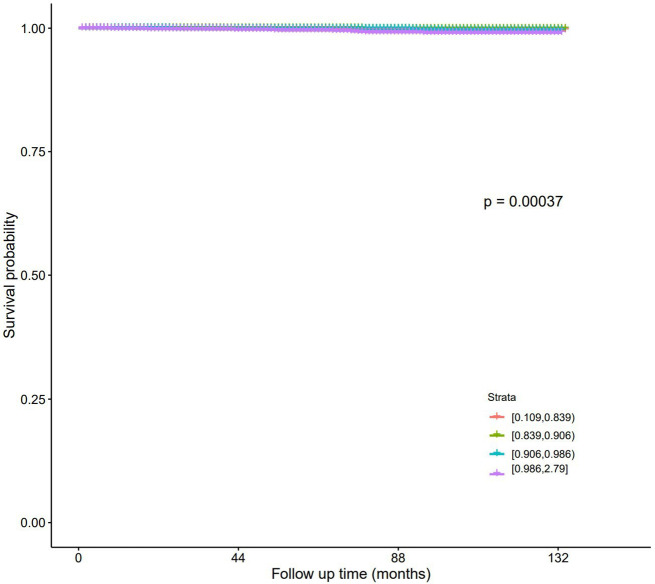
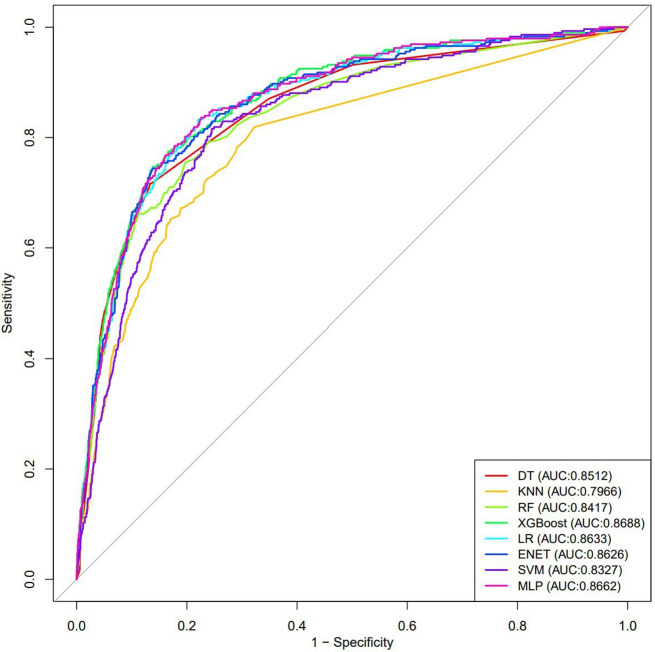
Methods: Data on 13,315 follow-up cohorts were extracted from NHANES. The study population was divided into four groups according to quartiles of SHR. The primary outcomes were all-cause mortality and diabetes mellitus mortality. The relationship between SHR and outcomes was explored using restricted cubic splines, COX proportional hazards regression, Kaplan-Meier curves, and mediation effects. SHR is incorporated into eight machine learning algorithms to establish a prediction model and verify the prediction performance.
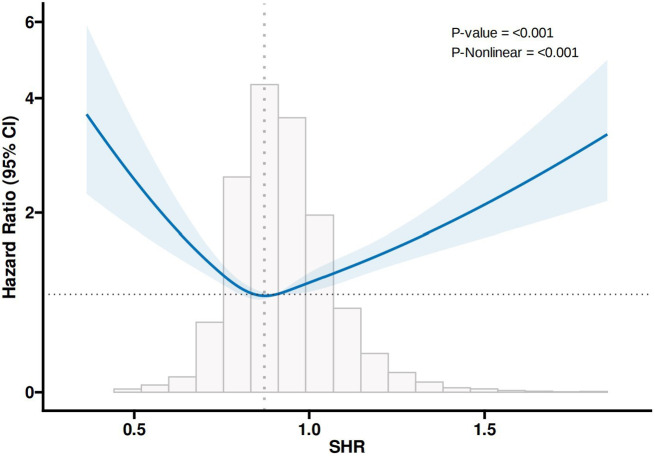
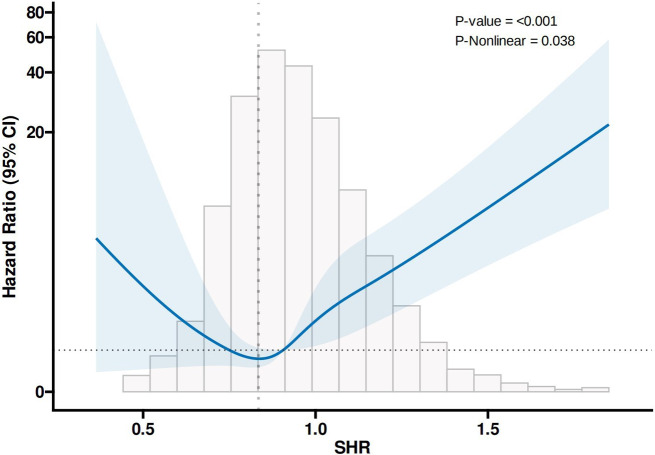
Results: A total of 13,315 individual data were included in this study. Restricted cubic splines demonstrated a "U-shaped" association between SHR and all-cause mortality and diabetes mellitus mortality, indicating that increasing SHR is associated with an increased risk of adverse events. Compared with lower SHR, higher SHR was significantly associated with an increased risk of all cause mortality and diabetes mellitus mortality (HR > 1, P < 0.05). The mediating effect results showed that the positively mediated variables were segmented neutrophils and aspartate aminotransferase, and the negatively mediated variables were hemoglobin, red blood cell count, albumin, and alanine aminotransferase. The ROC of the eight machine learning algorithm models are XGBoost (0.8688), DT (0.8512), KNN (0.7966), RF (0.8417), Logistic regression (0.8633), ENET (0.8626), SVM (0.8327) and MLP (0.8662).
Conclusion: SHR can be used as a predictor of all cause mortality and diabetes mellitus mortality in the general adult population in the United States. Higher SHR is significantly associated with an increased risk of poor prognosis, especially in those aged < 65 years and in women.
Keywords: Machine learning algorithm; Mediating effect; NHANES; Retrospective cohort; Stress hyperglycemia ratio.
© 2024. The Author(s).
Conflict of interest statement
The authors declare that the research was conducted in the absence of any commercial or financial relationships that could be construed as a potential conflict of interest.
Figures
References
Grants and funding
LinkOut - more resources
Full Text Sources
