. 2024 Aug;20(8):1854-1867.
doi: 10.1080/15548627.2024.2338577. Epub 2024 Apr 9.

ATF6 supports lysosomal function in tumor cells to enable ER stress-activated macroautophagy and CMA: impact on mutant TP53 expression

Affiliations

ATF6 supports lysosomal function in tumor cells to enable ER stress-activated macroautophagy and CMA: impact on mutant TP53 expression

Rossella Benedetti et al. Autophagy. 2024 Aug.

Abstract

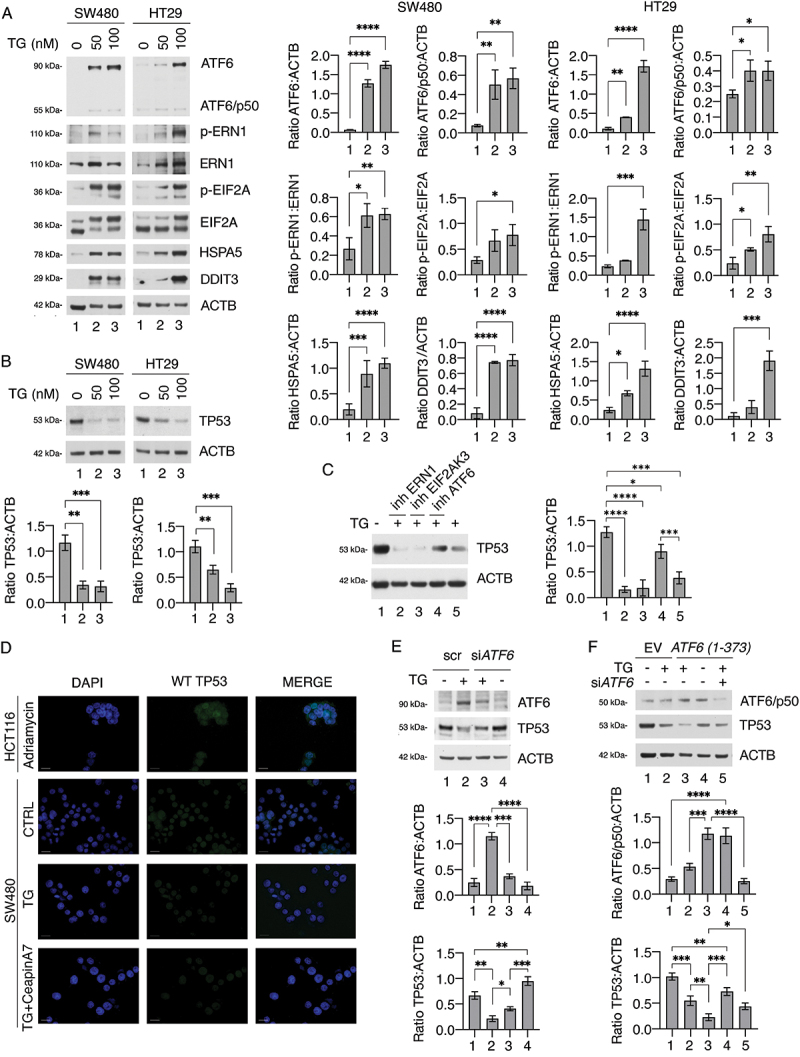
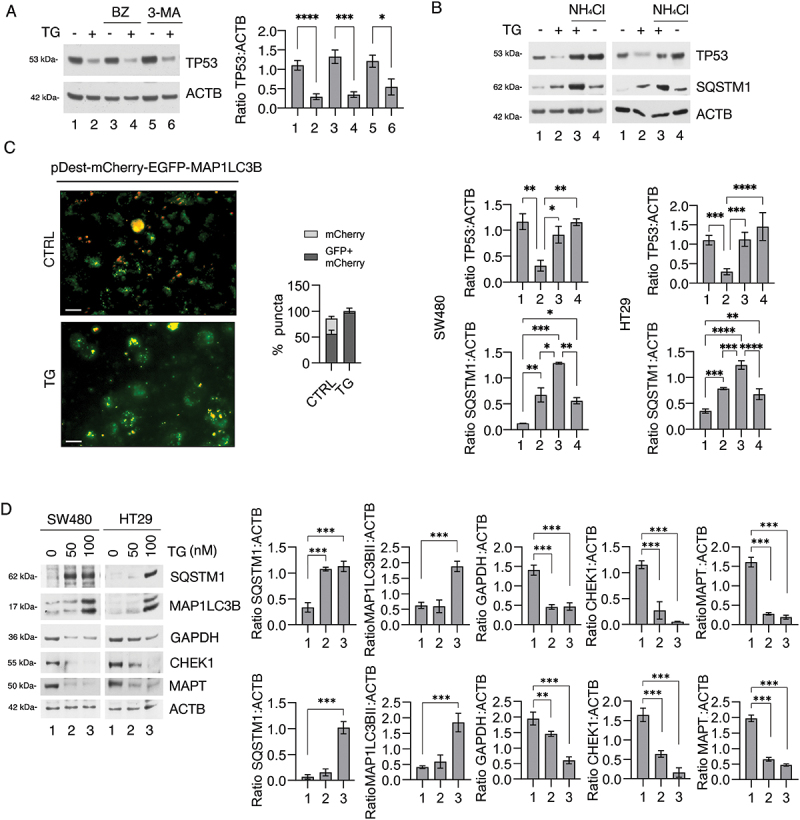
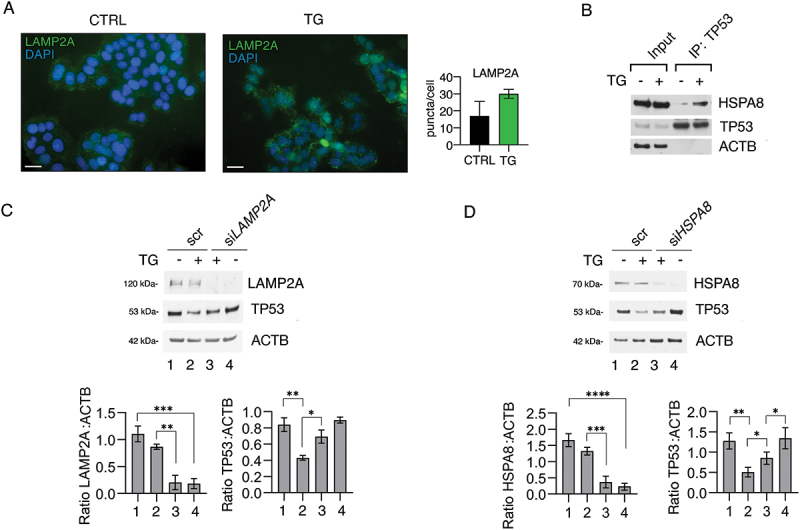
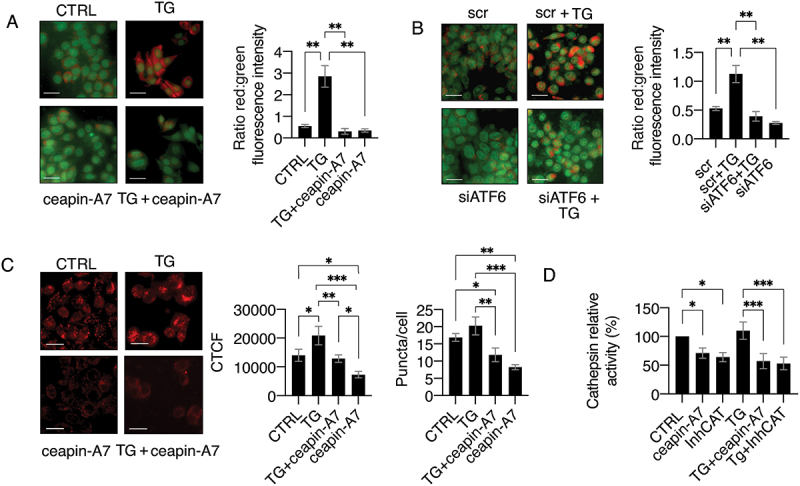
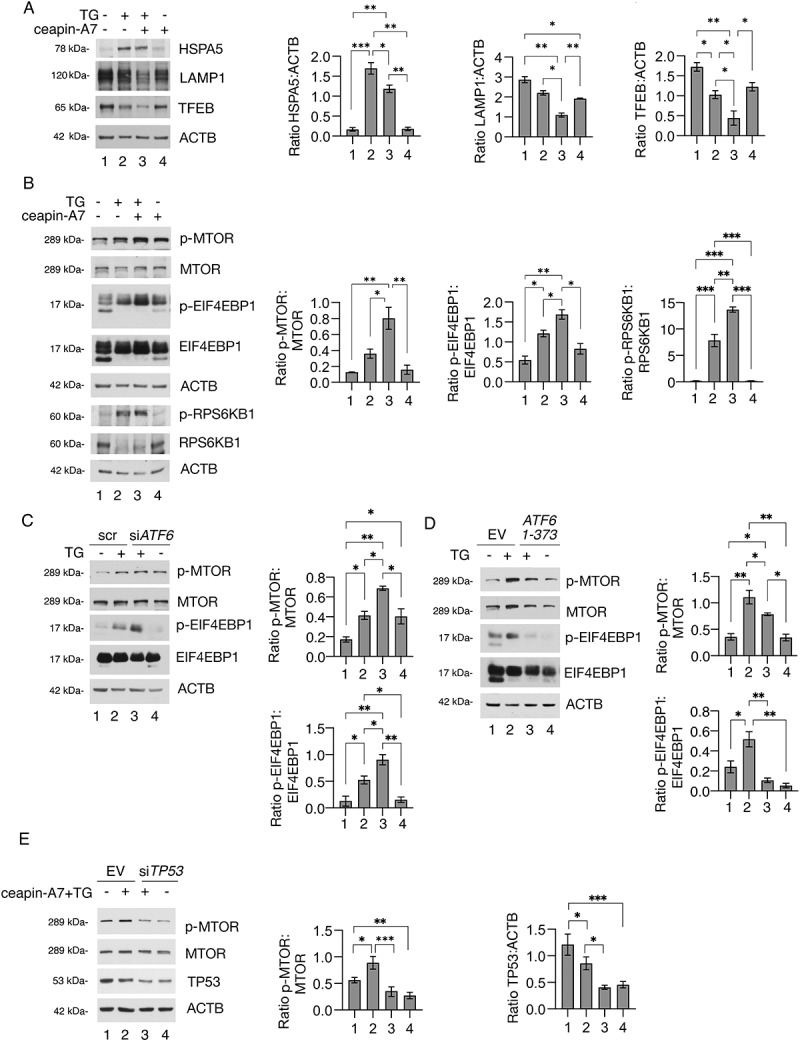
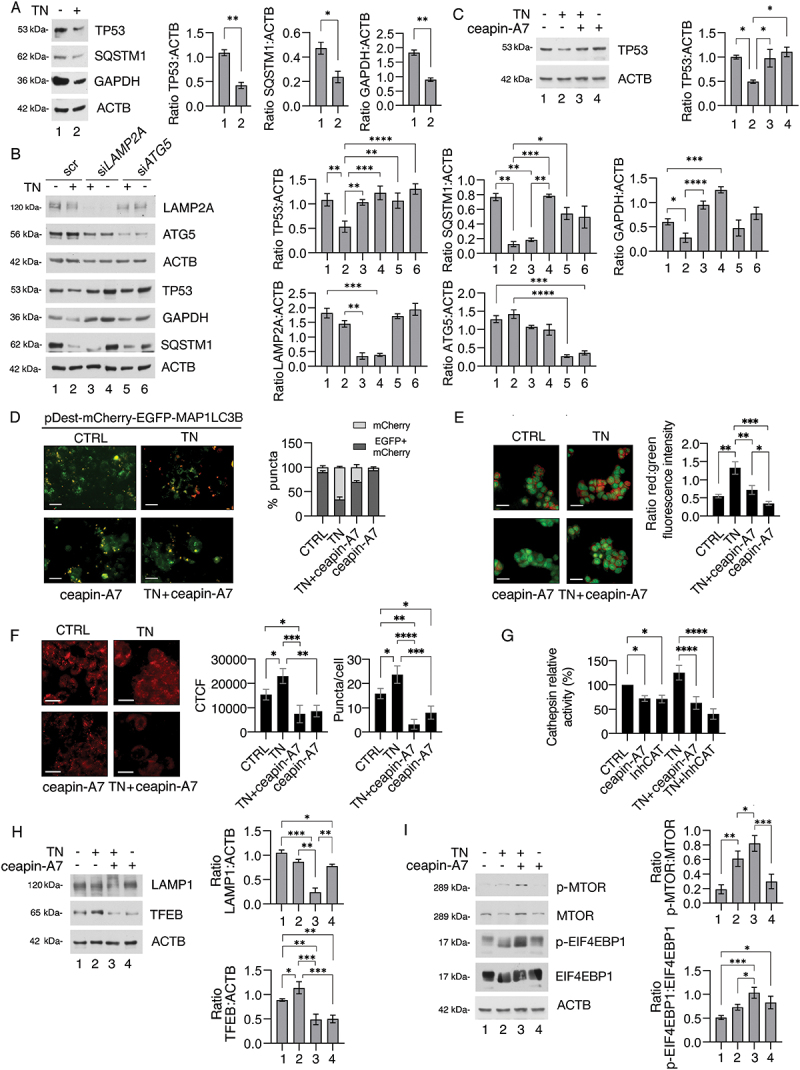
The inhibition of the unfolded protein response (UPR), which usually protects cancer cells from stress, may be exploited to potentiate the cytotoxic effect of drugs inducing ER stress. However, in this study, we found that ER stress and UPR activation by thapsigargin or tunicamycin promoted the lysosomal degradation of mutant (MUT) TP53 and that the inhibition of the UPR sensor ATF6, but not of ERN1/IRE1 or EIF2AK3/PERK, counteracted such an effect. ATF6 activation was indeed required to sustain the function of lysosomes, enabling the execution of chaperone-mediated autophagy (CMA) as well as of macroautophagy, processes involved in the degradation of MUT TP53 in stressed cancer cells. At the molecular level, by pharmacological and genetic approaches, we demonstrated that the inhibition of ATF6 correlated with the activation of MTOR and with TFEB and LAMP1 downregulation in thapsigargin-treated MUT TP53 carrying cells. We hypothesize that the rescue of MUT TP53 expression by ATF6 inhibition, could further activate MTOR and maintain lysosomal dysfunction, further inhibiting MUT TP53 degradation, in a vicious circle. The findings of this study suggest that the presence of MUT TP53, which often exerts oncogenic properties, should be considered before approaching treatments combining ER stressors with ATF6 inhibitors against cancer cells, while it could represent a promising strategy against cancer cells that harbor WT TP53.

Keywords: ATF6; CMA; UPR; cathepsins; mutant TP53; thapsigargin.


Conflict of interest statement

No potential conflict of interest was reported by the author(s).

Figures

Figure 1.
Figure 1.
ATF6 inhibition counteracts mutant TP53 downregulation induced by TG in colon cancer cells. SW480 and HT29 cells were treated with thapsigargin (TG; 50–100 nM) for 36 h. (A, B) Protein expression level of full-length and cleaved ATF6 (ATF6/p50), p-ERN1, ERN1, p-EIF2A, EIF2A, HSPA5, DDIT3 and TP53 as evaluated by western blot analysis. ACTB was used as a loading control and one representative experiment is shown. The histograms represent the densitometric analysis of the ratio of specific protein and the appropriate control. The data are represented as the mean ± S.D. from three different experiments. (C) Protein expression level of MUT TP53 in SW480 cells treated with ERN1/IRE1 inhibitor (4μ8C), EIF2AK3/PERK inhibitor (GSK2606414), and ATF6 inhibitor (ceapin-A7) before treatment with TG. ACTB was used as a loading control and one representative experiment is shown. The histograms represent the densitometric analysis of the ratio of MUT TP53:ACTB. The data are represented as the mean ± S.D. from three different experiments. (D) Immunofluorescence for WT TP53 (Clone PAb1620) in WT TP53 HCT116 cells treated with adriamycin and SW480 cells untreated (CTRL) and pre-treated or not with ceapin-A7 and exposed to TG. Blue: DAPI staining. Scale bars: 20 μm. (E) Protein expression level of ATF6 and MUT TP53 in scramble (scr)-treated and ATF6-silenced (siATF6) SW480 cells treated or not with TG, as evaluated by western blot analysis. ACTB was used as a loading control and one representative experiment is shown. Histograms represent the densitometric analysis of the ratio of specific protein:ACTB. The data are represented as the mean ± S.D. from three different experiments. (F) Protein expression level of ATF6 cleaved (ATF6/p50) and MUT TP53 in empty vector (EV)- or ATF6 cleaved form (1–373)-transfected HT29 cells, treated or not with TG and silenced for ATF6 (siATF6). ACTB was used as a loading control and one representative experiment is shown. Histograms represent the densitometric analysis of the ratio of specific protein:ACTB. The data are represented as the mean ± S.D. from three different experiments. p value * < 0.05, ** < 0.01, *** < 0.001, **** <0.0001. If densitometry was not statistically different among the treatments and molecules the significance was not shown.
Figure 2.
Figure 2.
TG induces the lysosomal degradation of TP53 independently on macroautophagy. Western blot analysis showing the expression levels of MUT TP53 and SQSTM1 in HT29 or SW480 cells treated with TG in combination with (A) bortezomib (BZ), 3-methyladenine (3-MA) or (B) ammonium chloride (NH4Cl). ACTB was used as a loading control and one representative experiment is shown. The histograms represent the densitometric analysis of the ratio of specific protein:ACTB. The data are represented as the mean ± S.D. from three different experiments. (C) HT29 cells transfected with the pDest-mCherry-EGFP-MAP1LC3B plasmid and treated with TG were analyzed by immunofluorescence. The yellow puncta indicate autophagosomes, while the red puncta indicate autolysosomes. The histograms represent the percentage of yellow (mCherry+egfp) and red (mCherry) puncta out of total puncta plus S.D. Scale bars: 20 μm. (D) Protein expression levels of SQSTM1, MAP1LC3B, GAPDH, CHEK1 and MAPT in HT29 and SW480 cells treated with TG, as evaluated by western blot analysis. ACTB was used as loading control and one representative experiment is shown. The histograms represent the densitometric analysis of the ratio of specific protein:ACTB. The data are represented as the mean ± S.D. from three different experiments.
Figure 3.
Figure 3.
TG promotes CMA-dependent MUT TP53 degradation. (A) Immunofluorescence for LAMP2A (green) in SW480 cells treated or not with TG. Blue: DAPI staining. The histograms represent the average number of fluorescent puncta in cells from three independent experiments. Scale bars: 20 μm (B) Protein expression levels of HSPA8 as evaluated by western blot analysis after immunoprecipitation with anti-TP53 antibody or crude lysate (Input) in SW480 cells treated or not with TG for 24 h. (C,D) Protein expression levels of LAMP2A or HSPA8 and MUT TP53 in scramble (scr)-treated and LAMP2A-silenced (siLAMP2A) or HSPA8-silenced (siHSPA8) in HT29 cells treated or not with TG as evaluated by western blot analysis. ACTB was used as a loading control and one representative experiment is shown. The histograms represent the densitometric analysis of the ratio of specific protein:ACTB. The data are represented as the mean ± S.D. from three different experiments. p value * < 0.05, ** < 0.01, *** < 0.001, **** <0.0001. If densitometry was not statistically different among the treatments and molecules the significance was not shown.
Figure 4.
Figure 4.
ATF6 inhibition impairs lysosome function. Lysosomal pH changes in SW480 cells treated with ceapin-A7 (A) or ATF6-silenced (siATF6) (B) before treatment with TG were evaluated by immunofluorescence by staining with acridine orange. The histograms represent the mean ± S.D. of the ratio between red and green fluorescence intensity. Scale bars: 20 μm. (C) Fluorescence analysis of SW480 cells stained with DQ-BSA to evaluate the proteolytic activity of cathepsins. The histograms represent the mean ± S.D. of the Corrected Total Cell Fluorescence (CTCF) or the average number of DQ-Red BSA puncta/cell. Bars: 20 μm. (D) Cathepsin activity as evaluated by fluorescence emission induced by Z-FR-AMC substrate proteolysis in SW480 cells pre-treated or nor with ceapin-A7 or cathepsin inhibitors pepstatin a and cathepsin inhibitor I, and then exposed or not with TG. The histograms represent. The histograms represent the mean ± S.D. of the background-corrected relative fluorescence units (RFU) as a percent of untreated control cells of three different experiments. p value * < 0.05, ** < 0.01, *** < 0.001, **** <0.0001. If densitometry was not statistically different among the treatments and molecules the significance was not shown.
Figure 5.
Figure 5.
ATF6 inhibition induces LAMP1 and TFEB downregulation and MTOR pathway activation. (A) Protein expression level of HSPA5, used as readout of ATF6 inhibition, LAMP1 and (B) TFEB, p-MTOR, MTOR, p-EIF4EBP1, EIF4EBP1, p-RPS6KB1 and RPS6KB1 in HT29 cells pre-treated or nor with ceapin-A7 and then exposed or not to TG, as evaluated by western blot analysis. The histograms represent the densitometric analysis of the ratio of specific protein:ACTB. The data are represented as the mean ± S.D. from three different experiments. (C) Protein expression levels of p-MTOR, MTOR, p-EIF4EBP1, EIF4EBP1 in scramble (scr)-treated and ATF6-silenced (siATF6) or (D) empty vector (EV)- or ATF6 cleaved form (1–373)-transfected HT29 cells treated or not with TG, as evaluated by western blot analysis. ACTB was used as a loading control and one representative experiment is shown. The histograms represent the densitometric analysis of the ratio of specific protein and the appropriate control. The data are represented as the mean ± S.D. from three different experiments. (E) Protein expression levels of p-MTOR, MTOR and MUT TP53 in SW480 transfected with pSUPER-p53 (siTP53) or empty vector (EV) before treatment or not with TG+ceapin-A7 combination, as evaluated by western blot analysis. ACTB was used as a loading control and one representative experiment is shown. The histograms represent the densitometric analysis of the ratio of specific protein and the appropriate control. The data are represented as the mean ± S.D. from three different experiments p value * < 0.05, ** < 0.01, *** < 0.001. If densitometry was not statistically different among the treatments and molecules the significance was not shown.
Figure 6.
Figure 6.
ATF6 induces MUT TP53 degradation induced by tunicamycin via CMA and macroautophagy. (A) Protein expression levels of MUT TP53, SQSTM1, and GAPDH in HT29 cells treated with tunicamycin (TN) as evaluated by western blot analysis. ACTB was used as a loading control and one representative experiment is shown. The histograms represent the densitometric analysis of the ratio of specific protein:ACTB. The data are represented as the mean ± S.D. from three different experiments. (B) Protein expression levels of LAMP2A, ATG5, MUT TP53, SQSTM1, and GAPDH in HT29 scramble (scr)-treated, LAMP2A-silenced (siLAMP2A), and ATG5-silenced (siATG5) treated or not with TN. Histograms represent the densitometric analysis of the ratio of specific protein:ACTB. The data are represented as the mean ± S.D. from three different experiments. HT29 cells were pre-treated or not with ceapin-A7 and then treated with TN for 36 h. (C) Protein expression level of MUT TP53 as evaluated by western blot analysis. Histograms represent the densitometric analysis of the ratio of specific protein:ACTB. The data are represented as the mean ± S.D. (D) HT29 cells transfected with the pDest-mCherry-EGFP-MAP1LC3B plasmid and treated with TN in combination or not with ceapin-A7 were analyzed by immunofluorescence. The yellow puncta indicate autophagosomes, while the red puncta indicate autolysosomes. The histograms represent the mean plus S.D. of the percentage of yellow (mCherry+egfp) and red (mCherry) puncta out of total puncta. Scale bars: 20 μm. (E) Lysosomal pH changes in HT29 treated cells were evaluated by immunofluorescence after staining with acridine orange. The histograms represent the mean ± S.D. of the ratio between red and green fluorescence intensity. Scale bars: 20 μm. (F) Fluorescence analysis of HT29 cells stained with DQ-BSA to evaluate proteolytic activity. The histograms represent the mean ± S.D. of the Corrected Total Cell Fluorescence (CTCF) or the average number of DQ-Red BSA puncta/cell. Scale bars: 20 μm. (G) Cathepsin activity as evaluated by fluorescence emission induced by Z-FR-AMC substrate proteolysis in HT29 cells pre-treated or nor with ceapin-A7 or cathepsin inhibitors pepstatinA and cathepsin inhibitor I, and then exposed or not with TN. The histograms represent the mean ± S.D. of the background-corrected relative fluorescence units (RFU) as a percent of untreated control cells of three different experiments. (H, I) Protein expression levels of LAMP1, TFEB, p-MTOR, MTOR, p-EIF4EBP1, and EIF4EBP1 in HT29 as evaluated by western blot analysis. ACTB was used as a loading control and one representative experiment is shown. The histograms represent the densitometric analysis of the ratio of specific protein and the appropriate control. The data are represented as the mean ± S.D. from three different experiments. p value * < 0.05, ** < 0.01, *** < 0.001, **** < 0.0001. If densitometry was not statistically different among the treatments and molecules the significance was not shown.

Similar articles

Cited by

References

    1. Rawla P, Sunkara T, Barsouk A.. Epidemiology of colorectal cancer: incidence, mortality, survival, and risk factors. Prz Gastroenterol. 2019;14(2):89–103. doi: 10.5114/pg.2018.81072 - DOI - PMC - PubMed
    1. Ye J, Lin M, Zhang C, et al. Tissue gene mutation profiles in patients with colorectal cancer and their clinical implications. Biomed Rep. 2020;13(1):43–48. doi: 10.3892/br.2020.1303 - DOI - PMC - PubMed
    1. Nakayama M, Oshima M. Mutant p53 in colon cancer. J Mol Cell Biol. 2019;11:267–276. doi: 10.1093/jmcb/mjy075 - DOI - PMC - PubMed
    1. Zhu G, Pan C, Bei JX, et al. Mutant p53 in Cancer Progression and Targeted Therapies. Front Oncol. 2020;10:595187. doi: 10.3389/fonc.2020.595187 - DOI - PMC - PubMed
    1. Tsvetkov P, Reuven N, Shaul Y. Ubiquitin-independent p53 proteasomal degradation. Cell Death Differ. 2010;17(1):103–108. doi: 10.1038/cdd.2009.67 - DOI - PubMed

Publication types

MeSH terms