. 2024 Aug;20(8):1825-1836.
doi: 10.1080/15548627.2024.2338573. Epub 2024 Apr 7.

LC3B conjugation machinery promotes autophagy-independent HIV-1 entry in CD4+ T lymphocytes

Affiliations

LC3B conjugation machinery promotes autophagy-independent HIV-1 entry in CD4+ T lymphocytes

Baptiste Pradel et al. Autophagy. 2024 Aug.

Abstract

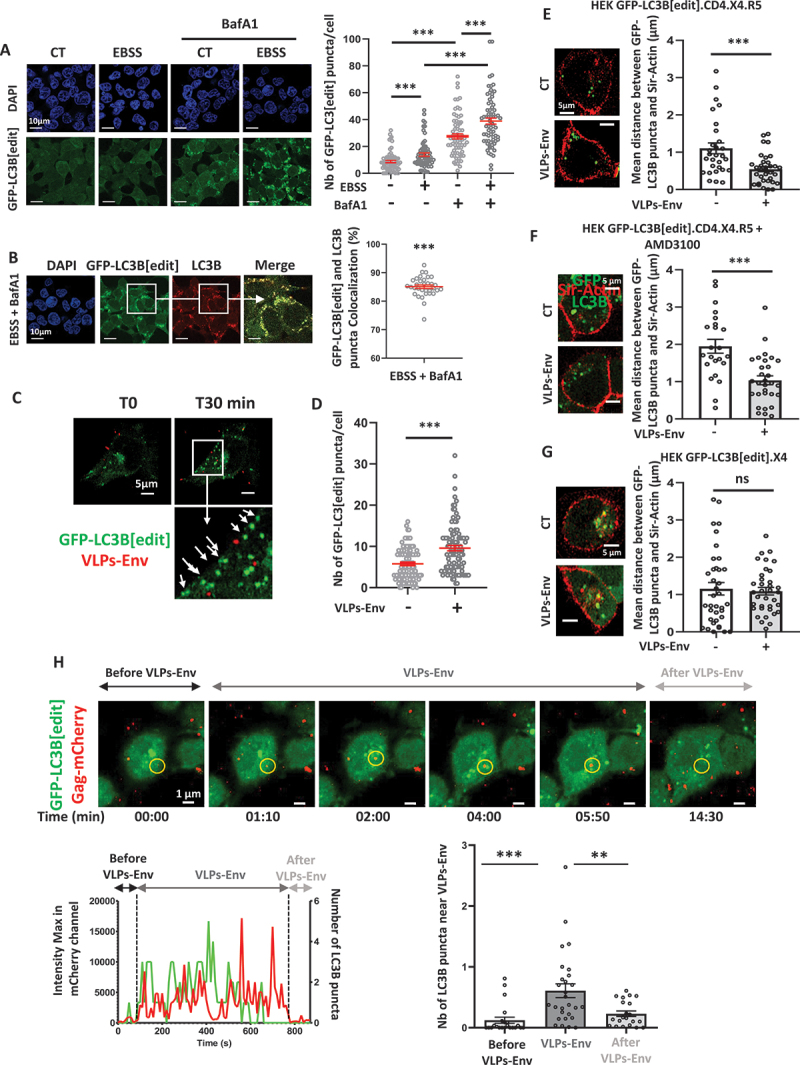
HIV-1 entry into CD4+ T lymphocytes relies on the viral and cellular membranes' fusion, leading to viral capsid delivery in the target cell cytoplasm. Atg8/LC3B conjugation to lipids, process named Atg8ylation mainly studied in the context of macroautophagy/autophagy, occurs transiently in the early stages of HIV-1 replication in CD4+ T lymphocytes. Despite numerous studies investigating the HIV-1-autophagy interplays, the Atg8ylation impact in these early stages of infection remains unknown. Here we found that HIV-1 exposure leads to the rapid LC3B enrichment toward the target cell plasma membrane, in close proximity with the incoming viral particles. Furthermore, we demonstrated that Atg8ylation is a key event facilitating HIV-1 entry in target CD4+ T cells. Interestingly, this effect is independent of canonical autophagy as ATG13 silencing does not prevent HIV-1 entry. Together, our results provide an unconventional role of LC3B conjugation subverted by HIV-1 to achieve a critical step of its replication cycle.Abbreviations: BafA1: bafilomycin A1; BlaM: beta-lactamase; CD4+ TL: CD4+ T lymphocytes; PtdIns3K-BECN1 complex: BECN1-containing class III phosphatidylinositol 3-kinase complex; Env: HIV-1 envelope glycoproteins; HIV-1: type 1 human immunodeficiency virus; PM: plasma membrane; PtdIns3P: phosphatidylinositol-3-phosphate; VLP: virus-like particle.

Keywords: Atg8ylation; CD4+ T lymphocyte; HIV-1; LC3B; virus entry.


Conflict of interest statement

No potential conflict of interest was reported by the author(s).

Figures

Figure 1.
Figure 1.
PtdIns3K inhibition decreases HIV-1 infection in CD4+ T lymphocytes. (A) HuT 78 cells or primary CD4+ TL were pre-treated with 20 μM PIK-III for 3 h before addition of HIV-1 (NL4.3 strain) at M.O.I. 1 during 1 h at 4°C. HIV-1-exposed cells were then extensively washed to remove the unbound viruses and the drug before being cultured for 16 h at 37°C. p24 levels were quantified by ELISA on cell lysates and supernatants. The p24 levels in cell lysates was normalized to the total level of protein extract. Statistical analyzes were performed using the unpaired t test with Graph Pad Prism software version 8. (B) HuT 78 cells or primary CD4+ TL were pre-treated with 20 µM PIK-III for 3 h before extensive washings to remove the drug. Cells were then infected with Dnase I-treated HIV-1 (NL4.3 strain) at M.O.I. of 1 for 16 h at 37°C. Early and late RT DNA intermediates were quantified by qPCR and normalized on PBGD levels. Analysis was performed using the 2-ΔΔCt+. Statistical analyzes were performed using the unpaired t test with Graph Pad Prism software version 8.
Figure 2.
Figure 2.
LC3B puncta are enriched toward the target cell PM, near the incoming viruses, upon HIV-1-like particles exposure in a CD4-dependent manner. (A) HEK GFP-LC3B[edit].CD4.X4.R5 cells were treated with EBSS in combination, or not, with 50 nM BafA1 for 4 h. The total volume of the cells was acquired using a confocal microscope and the number of GFP-LC3B[edit] dots were analyzed using the Plug in « Analyze particles » of the Fiji software in each condition. The data are representative of 3 independent experiments. Statistical analyzes were performed using the unpaired t test with Graph Pad Prism software version 8. (B) EBSS-treated edited cells, in combination with BafA1 treatment, were stained with an anti-LC3B antibody for immunofluorescence. The percentage of colocalization between GFP-LC3B[edit] puncta and LC3B puncta detected by immunofluorescence was analyzed (Manders’ coefficient of the green fluorescence in the red fluorescence). At least 30 cells from 3 independent experiments were analyzed. The statistical analysis was done using the “one sample t and wilconxon test” on Prism 8 software. (C) HEK GFP-LC3B[edit].CD4.X4.R5 cells were incubated with mCherry-VLPs-Env and live-imaged using a Spinning Disk Dragonfly microscope. A snapshot after 30 min of mCherry-VLPs-Env (Red) exposure is presented. The white arrows point to the GFP-LC3B[edit] (green) puncta that appeared toward the cell surface. (D) HEK GFP-LC3B[edit].CD4.X4.R5 cells were incubated, or not, with mCherry-VLPs-Env during 90 min and acquired using a confocal microscope. The number of GFP-LC3B[edit] puncta were analyzed in the total volume of the cells using the « Analyze particles » plugin of the Fiji software in each conditions. The data are representative of 3 independent experiments. Statistical analyzes were performed using the unpaired t test with Graph Pad Prism software version 8. (E) HEK GFP-LC3B[edit].CD4.X4.R5 cells were stained with 0.5 µM SirActin and, then, infected with mCherry-VLPs-Env. After 20 min of virus exposure, the total volume of the cells was imaged with a spinning disk confocal microscope. Red: SirActin staining; Green: GFP-LC3B[edit]. The graph represents the average distance between GFP-LC3B[edit] puncta and the SirActin staining per cell. Analysis was performed with the IMARIS software, using the “Surface” function to identify the cell border and using the “Spots” function to identify individual GFP-LC3B[edit] puncta. The average distance between GFP-LC3B[edit] puncta and the SirActin staining was quantified in at least 20 cells from at least 3 independent experiments. One single representative z is presented for each condition. Statistical analyzes were performed using the unpaired t test with Graph Pad Prism software version 8. (F) the same experiment as in (C) was done in HEK GFP-LC3B[edit].CD4.X4.R5 cells pretreated during 90 min with 1 µg:ml AMD3100. Data are representative of at least 20 cells from 3 independent experiments. (G) the same experiment as in C was done using the HEK GFP-LC3B[edit].X4 cells that do not express CD4. Data are representative of at least 20 cells from 3 independent experiments. (H) HEK GFP-LC3B[edit].CD4.X4.R5 were exposed to mCherry-VLPs-Env during 30 min at 16°C. Then, viruses-exposed cells were incubated at 37°C and three-dimensional images were acquired every 10 s during 30 min using a spinning disk confocal microscope. Images were captured with a focus on the top of the cell. Viruses were tracked at the surface of the target cells based on the SirActin staining. A sphere of 1.5 μm of diameter was drawn around each virus (yellow circle) and the number of LC3B puncta found in this volume was evaluated using the “FiJi” software at each time point. The quantification was done in three conditions: (i) at the surface of the target cell in the zone where the virus will arrive (before virus), (ii) in the sphere volume along the presence of the virus at the PM (virus) and (iii) in the sphere after the virus entry (after virus). Snapshots of a representative individual tracked viral particle over time is shown for each condition. The left graphs represent the correlation between the Gag.MCherry intensity in the sphere (red) and the number of LC3B puncta (green) in the same volume. The right bar graphs summarize the mean value of the LC3B puncta number in the sphere for at least 10 viruses in at least 3 independent experiments. Data are representative of at least 20 cells from 3 independent experiments.
Figure 3.
Figure 3.
LC3B conjugation machinery favors HIV-1 entry by fusion in CD4+ T lymphocytes in an autophagy-independent manner. (A) Activated primary CD4+ TL were pre-treated with either 0.1% DMSO or 20 µM PIK-III for 3 h then washed intensively to remove drugs. Pre-treated cells were infected with HIV-1.Blam-Vpr (M.O.I. 1) for 3 h at 37°C. After washing, cells were loaded with CCF2 for 1.5 h at RT before being washed and incubated overnight at RT to allow Blam enzymatic reaction. Flow cytometry was used to quantify the percentage of cells displaying an increased blue fluorescence representative of viral entry. Data are representative of at least 3 independent experiments. Statistical analyses were performed using the unpaired t test with Graph Pad Prism software version 8. (B) Activated primary CD4+ TL were transduced with shRNA targeting BECN1 or ATG7 for at least 3 days. Transduced cells were directly lysed in 2× Laemmli loading buffer to analyze the expression level of BECN1 and ATG7 by western blot. α-Tubulin (TUBA) was used to control sample loading. Transduced cells were infected with HIV-1-Blam-Vpr as previously and the viral entry was analyzed as in A. Data are representative of at least 3 independent experiments. Statistical analyses were performed using the unpaired t test with Graph Pad Prism software version 8. (C) HuT 78 cells were transduced for 3 days with lentiviruses allowing the expression of either GFP, GFP-LC3B or GFP-LC3BG120A before being infected with HIV-1-Blam Vpr using the same protocol of infection as a and B. for this experiment, as compensation was required and varied depending on the transduction levels. The entry level was monitored using the value of relative staining (rStain) of cleaved-CCF2 in infected conditions using the following formula: rStain = (MFI CCF2-cleaved infected-MFI CCF2-cleaved uninfected):(rSD MFI CCF2-cleaved uninfected). Data are representative of at least 3 independent experiments. Statistical analyses were performed using the unpaired t test with Graph Pad Prism software version 8. (D) Activated primary CD4+ TL were pre-treated with either 0.1% DMSO or Antiproteases (AP = Pepstatin a + E64d, 10 μM each) for 3 h, then washed to remove drugs. Then cells were infected with HIV-1 NL4.3 Blam-Vpr using the same protocol of infection and analysis as in A. Data are representative of at least 3 independent experiments. Statistical analyses were performed using the unpaired t test with Graph Pad Prism software version 8. (E) Activated primary CD4+ TL were transduced with shRNA targeting ATG13 for 3 days before being directly lyzed in 2× Laemmli loading buffer to analyze the expression level of ATG13 by western blot. TUBA was used to control sample loading. Transduced cells were infected with HIV-1-Blam-Vpr using the same protocol of infection and analysis as in A. Data are representative of at least 3 independent experiments. Statistical analyses were performed using the unpaired t test with Graph Pad Prism software version 8.

References

    1. Padilla‐Parra S. Time‐resolved single virus tracking and spectral imaging to understand HIV‐1 entry and fusion. Biol Cell. 2023;115(3):2200082. doi: 10.1111/boc.202200082 - DOI - PubMed
    1. Chen B. Molecular mechanism of HIV-1 entry. Trends Microbiol. 2019;27(10):878–891. doi: 10.1016/j.tim.2019.06.002 - DOI - PMC - PubMed
    1. Fernandez J, Machado AK, Lyonnais S, et al. Transportin-1 binds to the HIV-1 capsid via a nuclear localization signal and triggers uncoating. Nat Microbiol. 2019;4(11):1840–1850. doi: 10.1038/s41564-019-0575-6 - DOI - PubMed
    1. Zila V, Margiotta E, Turoňová B, et al. Cone-shaped HIV-1 capsids are transported through intact nuclear pores. Cell. 2021;184(4):1032–1046.e18. doi: 10.1016/j.cell.2021.01.025 - DOI - PMC - PubMed
    1. Li C, Burdick RC, Nagashima K, et al. (2021). HIV-1 cores retain their integrity until minutes before uncoating in the nucleus. Proc Natl Acad Sci USA, 118:e2019467118. doi: 10.1073/pnas.2019467118 - DOI - PMC - PubMed

Publication types

MeSH terms

Substances

LinkOut - more resources