. 2024 Dec;51(12):1665-1676.
doi: 10.1111/jcpe.13982. Epub 2024 Apr 2.

Single-cell analysis reveals a unique microenvironment in peri-implantitis

Affiliations

Single-cell analysis reveals a unique microenvironment in peri-implantitis

J Li et al. J Clin Periodontol. 2024 Dec.

Abstract

Aim: This study aimed to reveal the unique microenvironment of peri-implantitis through single-cell analysis.

Materials and methods: Herein, we performed single-cell RNA sequencing (scRNA-seq) of biopsies from patients with peri-implantitis (PI) and compared the results with healthy individuals (H) and patients with periodontitis (PD).

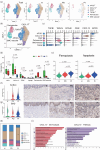
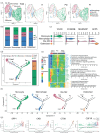
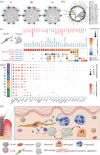
Results: Decreased numbers of stromal cells and increased immune cells were found in the PI group, which implies a severe inflammatory infiltration. The fibroblasts were found to be heterogeneous and the specific pro-inflammatory CXCL13+ sub-cluster was more represented in the PI group, in contrast to the PD and H groups. Furthermore, more neutrophil infiltration was detected in the PI group than in the PD group, and cell-cell communication and ligand-receptor pairs revealed most neutrophils were recruited by CXCL13+ fibroblasts through CXCL8/CXCL6-CXCR2/CXCR1. Notably, our study demonstrated that the unique microenvironment of the PI group promoted the differentiation of monocyte/macrophage lineage cells into osteoclasts, which might explain the faster and more severe bone resorption in the progression of PI than PD.

Conclusions: Collectively, this study suggests a unique immune microenvironment of PI, which may explain the differences between PI and PD in the clinic. These outcomes will aid in finding new specific and effective treatments for PI.

Keywords: immune microenvironment; periodontitis; peri‐implantitis; single‐cell RNA‐seq.


Conflict of interest statement

The authors declare no conflicts of interest.

Figures
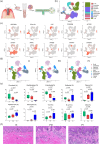
FIGURE 1
FIGURE 1
Overview of single cells from the immune microenvironment of peri‐implantitis (PI), periodontitis (PD) and healthy individuals (H). (a) Schematic overview of the study. (b) Uniform manifold approximation and projection (UMAP) representation of 10 cell types in the PI group identified by single‐cell RNA sequencing (n = 5, 39,297 cells) and the percentages of the different cell types. (c) UMAPs as in (b) but coloured by expression of key marker genes for specific cell types. (d) UMAP showing the representation of cell types in H group (n = 5, 38,382 cells), PD group (n = 5, 31,300 cells) and PI group (n = 5, 39,297 cells). (e). Box plots showing the percentage of cells for each of 10 clusters as in (d) from H, PD and PI samples with plot centre, box, whiskers and point corresponding to the median, interquartile range (IQR), 1.5 × IQR and >1.5 × IQR respectively. (f) HE staining of biopsies in the H, PD and PI groups. Scale bar: 100 μm.
FIGURE 2
FIGURE 2
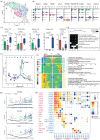
The heterogeneity of fibroblasts and the pro‐inflammatory CXCL13+ sub‐cluster in peri‐implantitis. (a) Uniform manifold approximation and projection (UMAP) of all fibroblasts in the different groups in a total of 15 samples. (b) UMAP of fibroblasts (six sub‐clusters), annotated and coloured by clustering. (c) Violin plots showing distinct expressions of the selected marker genes (row) in each sub‐cluster. (d) Percentage of each subpopulation of fibroblasts in the peri‐implantitis (PI), periodontitis (PD) and healthy individuals (H) groups. (e) Violin plots showing the analysis of ferroptosis and apoptosis in the different groups. (f) Left panel: violin plots showing differences in the expression of the ferroptosis‐related gene ACSL4 in different groups; right panel: relative expression of the ACSL4 protein in each group. (g) Left panel: violin plots showing differences in the expression of the apoptosis‐related gene BAD in different groups; right panel: the relative expression of BAD protein in each group. (h) Proportion of the subpopulations of fibroblasts in the PI, PD and H groups. *p < .05, PI versus H; **p < .01, PI versus H; (i) Enriched terms of CXCL13+ sub‐clusters were identified by GO and pathway analyses.
FIGURE 3
FIGURE 3
More neutrophil infiltration was observed in the immune microenvironment of peri‐implantitis. (a) Uniform manifold approximation and projection (UMAP) of five clusters of neutrophils. (b) The violin plots show markers of every cluster of neutrophils and the expression of functional proteins in each cluster. (c) The box plots showing the percentage of cells for each of the five clusters from healthy individuals (H), periodontitis (PD) and peri‐implantitis (PI) group, with plot centre, box, whiskers and points corresponding to the median, interquartile range (IQR), 1.5 × IQR and >1.5× IQR, respectively. Statistical analysis was performed using unpaired two‐tailed t‐tests. (d) QuSAGE analysis of different sub‐clusters in different groups. (e) Pseudotime analysis revealing the progression of five clusters of neutrophils. Trajectory reconstruction of all single cells revealing three branches: Pre‐branch, Fate 1 and Fate 2. (f) Heatmap showing the scaled expression of differentially expressed genes in three branches as in (e), catalogued into three major gene clusters (blue, green and yellow) that vary as a function of pseudotime, highlighting specific representative genes in each gene cluster along the right margin. (g) The expression dynamics of selected genes (related to NFkB pathway) bifurcate into two branches with respect to pseudotime coordinates. All single cells in the three sub‐clusters are coloured based on (a) and ordered based on pseudotime. (h) Visualization of the selected fibroblast–neutrophil crosstalk pathway. Red signals are ligands sent from fibroblasts and blue signal are receptors expressed on neutrophils.
FIGURE 4
FIGURE 4
The multiple‐colour immunofluorescence staining of tissues in different groups. Rose red shows the signal of S100A4 staining (fibroblast marker); red shows the signal of CXCL13 staining; green shows the signal of myeloperoxidase (MPO) staining (neutrophil marker); and blue shows DAPI staining. The left panel showed the images of isotype control. Scale bar: 20 μm.
FIGURE 5
FIGURE 5
Monocyte differentiation in the immune microenvironment of peri‐implantitis. (a) Uniform manifold approximation and projection of myeloid clusters, annotated and coloured by the sample type of origin (healthy individuals [H], periodontitis [PD] and peri‐implantitis [PI]) and clustering. (b) The proportion showing H, PD and PI among monocyte, macrophage, Ma‐M2 and osteoclasts (c) The violin plots showed key cell‐type markers to define each cluster of myeloid cells. (d) Pseudotime analysis revealing the progression of major groups: monocyte, macrophage, Ma‐M2 and osteoclast. Trajectory reconstruction of all single cells revealing three branches: Pre‐branch, Fate 1 and Fate 2. The percentage of each branch of all cells is indicated in the bar chart. The arrows indicate the developmental trajectory of the cells. (e) Heatmap showing the scaled expression of differentially expressed genes in three branches as in (d), catalogued into three major gene clusters (blue, green and yellow) that vary as a function of pseudotime, highlighting specific representative genes in each gene cluster along the right margin. (f) Distribution of macrophages, Ma‐M2, monocytes and osteoclasts on the pseudotime trajectory. (g) The expression dynamics of selected genes (related to osteoclast differentiation) bifurcate into two branches with respect to pseudotime coordinates.
FIGURE 6
FIGURE 6
Cell–cell communication in the immune microenvironment of peri‐implantitis, periodontitis and healthy individuals. (a) A circo plot showing the potential cell interactions among 10 major cell types, as depicted in Figure 1d predicted by CellPhone. The node size represents the number of interactions. The width of the edge represents the number of significant ligand–receptor pairs between the two cell types. (b) Dot plot generated by CellPhone showing potential ligand–receptor pairs associated with monocytes and the other cell types in the peri‐implantitis (PI) group. (c) Visualization of the fibroblast–monocyte crosstalk pathway. Red signals are ligands sent from fibroblasts and blue signals are receptors expressed on monocytes. Coloured dots indicate expression of ligand–receptor pairs between two clusters. (d) The expression of chemokines in fibroblasts in the healthy individuals (H), periodontitis (PD) and PI groups. Expression values are normalized and scaled averages. (e) Predicted regulatory network centred on the immune microenvironment of peri‐implantitis.

References

    1. Berglundh, T. , Armitage, G. , Araujo, M. G. , Avila‐Ortiz, G. , Blanco, J. , Camargo, P. M. , Chen, S. , Cochran, D. , Derks, J. , Figuero, E. , & Hämmerle, C. H. (2018). Peri‐implant diseases and conditions: Consensus report of workgroup 4 of the 2017 World Workshop on the Classification of Periodontal and Peri‐Implant Diseases and Conditions. Journal of Periodontology, 89(Suppl 1), S313–s318. - PubMed
    1. Berglundh, T. , Zitzmann, N. U. , & Donati, M. (2011). Are peri‐implantitis lesions different from periodontitis lesions? Journal of Clinical Periodontology, 38(Suppl 11), 188–202. - PubMed
    1. Carcuac, O. , Abrahamsson, I. , Albouy, J. P. , Linder, E. , Larsson, L. , & Berglundh, T. (2013). Experimental periodontitis and peri‐implantitis in dogs. Clinical Oral Implants Research, 24, 363–371. - PubMed
    1. Carcuac, O. , & Berglundh, T. (2014). Composition of human peri‐implantitis and periodontitis lesions. Journal of Dental Research, 93, 1083–1088. - PMC - PubMed
    1. Chen, Y. , Wang, H. , Yang, Q. , Zhao, W. , Chen, Y. , Ni, Q. , Li, W. , Shi, J. , Zhang, W. , Li, L. , Xu, Y. , Zhang, H. , Miao, D. , Xing, L. , & Sun, W. (2022). Single‐cell RNA landscape of the osteoimmunology microenvironment in periodontitis. Theranostics, 12, 1074–1096. - PMC - PubMed

Publication types

Substances