

Phospholipids Differentially Regulate Ca2+ Binding to Synaptotagmin-1
- PMID: 38566504
- PMCID: PMC11040605
- DOI: 10.1021/acschembio.3c00772
Phospholipids Differentially Regulate Ca2+ Binding to Synaptotagmin-1
Abstract
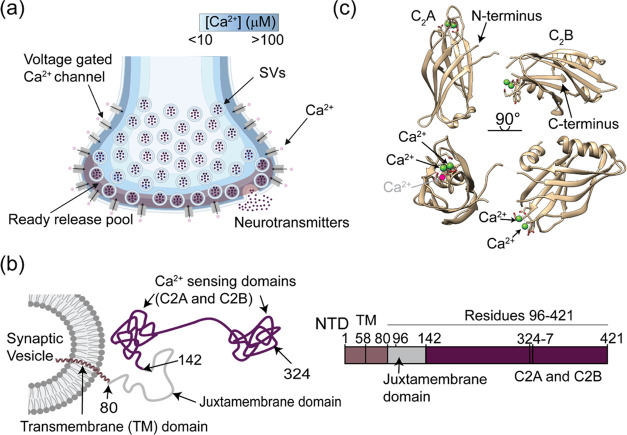
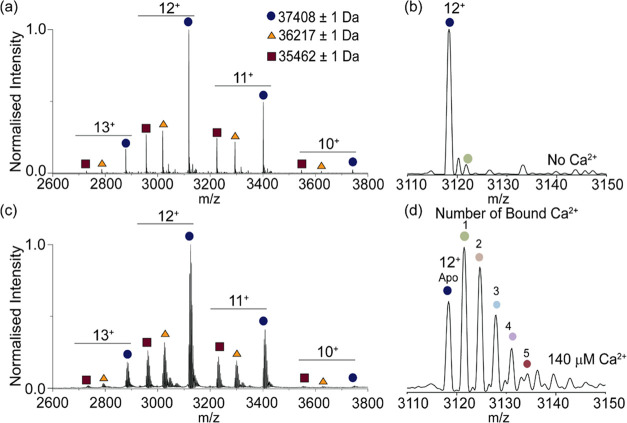
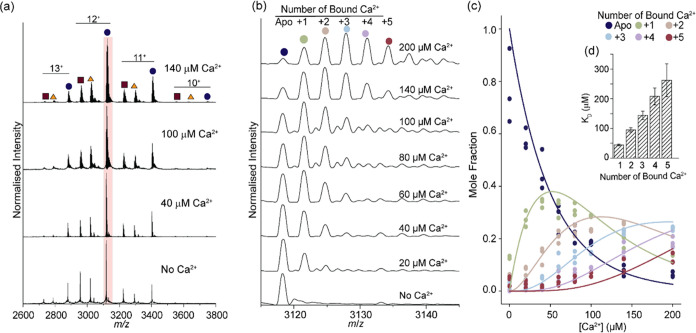
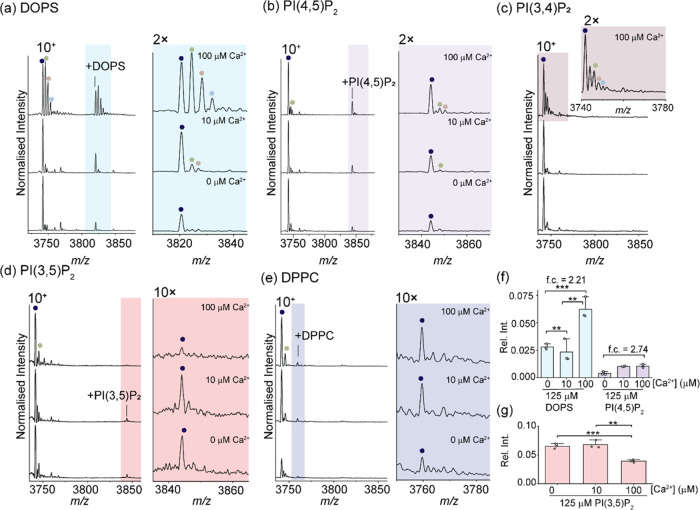
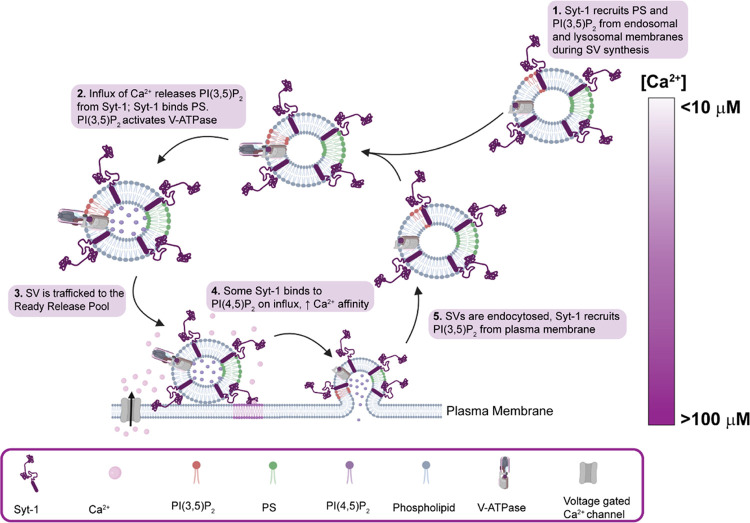
Synaptotagmin-1 (Syt-1) is a calcium sensing protein that is resident in synaptic vesicles. It is well established that Syt-1 is essential for fast and synchronous neurotransmitter release. However, the role of Ca2+ and phospholipid binding in the function of Syt-1, and ultimately in neurotransmitter release, is unclear. Here, we investigate the binding of Ca2+ to Syt-1, first in the absence of lipids, using native mass spectrometry to evaluate individual binding affinities. Syt-1 binds to one Ca2+ with a KD ∼ 45 μM. Each subsequent binding affinity (n ≥ 2) is successively unfavorable. Given that Syt-1 has been reported to bind anionic phospholipids to modulate the Ca2+ binding affinity, we explored the extent that Ca2+ binding was mediated by selected anionic phospholipid binding. We found that phosphatidylinositol 4,5-bisphosphate (PI(4,5)P2) and dioleoylphosphatidylserine (DOPS) positively modulated Ca2+ binding. However, the extent of Syt-1 binding to phosphatidylinositol 3,5-bisphosphate (PI(3,5)P2) was reduced with increasing [Ca2+]. Overall, we find that specific lipids differentially modulate Ca2+ binding. Given that these lipids are enriched in different subcellular compartments and therefore may interact with Syt-1 at different stages of the synaptic vesicle cycle, we propose a regulatory mechanism involving Syt-1, Ca2+, and anionic phospholipids that may also control some aspects of vesicular exocytosis.
Conflict of interest statement
The authors declare no competing financial interest.
Figures
Similar articles
-
Allosteric stabilization of calcium and phosphoinositide dual binding engages several synaptotagmins in fast exocytosis.Elife. 2022 Aug 5;11:e74810. doi: 10.7554/eLife.74810. Elife. 2022. PMID: 35929728 Free PMC article.
-
Phosphatidylinositol 4,5-bisphosphate drives Ca2+-independent membrane penetration by the tandem C2 domain proteins synaptotagmin-1 and Doc2β.J Biol Chem. 2019 Jul 12;294(28):10942-10953. doi: 10.1074/jbc.RA119.007929. Epub 2019 May 30. J Biol Chem. 2019. PMID: 31147445 Free PMC article.
-
Differential regulation of synchronous versus asynchronous neurotransmitter release by the C2 domains of synaptotagmin 1.Proc Natl Acad Sci U S A. 2010 Aug 17;107(33):14869-74. doi: 10.1073/pnas.1000606107. Epub 2010 Aug 2. Proc Natl Acad Sci U S A. 2010. PMID: 20679236 Free PMC article.
-
Function of Drosophila Synaptotagmins in membrane trafficking at synapses.Cell Mol Life Sci. 2021 May;78(9):4335-4364. doi: 10.1007/s00018-021-03788-9. Epub 2021 Feb 22. Cell Mol Life Sci. 2021. PMID: 33619613 Free PMC article. Review.
-
Exocytosis and synaptic vesicle function.Compr Physiol. 2014 Jan;4(1):149-75. doi: 10.1002/cphy.c130021. Compr Physiol. 2014. PMID: 24692137 Review.
Cited by
-
Dynamic Formation of the Protein-Lipid Pre-fusion Complex.bioRxiv [Preprint]. 2024 May 11:2024.04.17.589983. doi: 10.1101/2024.04.17.589983. bioRxiv. 2024. Update in: Biophys J. 2024 Oct 15;123(20):3569-3586. doi: 10.1016/j.bpj.2024.09.009. PMID: 38659925 Free PMC article. Updated. Preprint.
-
Dynamic formation of the protein-lipid prefusion complex.Biophys J. 2024 Oct 15;123(20):3569-3586. doi: 10.1016/j.bpj.2024.09.009. Epub 2024 Sep 10. Biophys J. 2024. PMID: 39257001
References
Publication types
MeSH terms
Substances
Grants and funding
LinkOut - more resources
Full Text Sources
Research Materials
Miscellaneous
