. 2024 Mar 19:15:1342180.
doi: 10.3389/fmicb.2024.1342180. eCollection 2024.

Cultivable microbial diversity, peptide profiles, and bio-functional properties in Parmigiano Reggiano cheese

Affiliations

Cultivable microbial diversity, peptide profiles, and bio-functional properties in Parmigiano Reggiano cheese

Serena Martini et al. Front Microbiol. .

Abstract

Introduction: Lactic acid bacteria (LAB) communities shape the sensorial and functional properties of artisanal hard-cooked and long-ripened cheeses made with raw bovine milk like Parmigiano Reggiano (PR) cheese. While patterns of microbial evolution have been well studied in PR cheese, there is a lack of information about how this microbial diversity affects the metabolic and functional properties of PR cheese.

Methods: To fill this information gap, we characterized the cultivable fraction of natural whey starter (NWS) and PR cheeses at different ripening times, both at the species and strain level, and investigated the possible correlation between microbial composition and the evolution of peptide profiles over cheese ripening.

Results and discussion: The results showed that NWS was a complex community of several biotypes belonging to a few species, namely, Streptococcus thermophilus, Lactobacillus helveticus, and Lactobacillus delbrueckii subsp. lactis. A new species-specific PCR assay was successful in discriminating the cheese-associated species Lacticaseibacillus casei, Lacticaseibacillus paracasei, Lacticaseibacillus rhamnosus, and Lacticaseibacillus zeae. Based on the resolved patterns of species and biotype distribution, Lcb. paracasei and Lcb. zeae were most frequently isolated after 24 and 30 months of ripening, while the number of biotypes was inversely related to the ripening time. Peptidomics analysis revealed more than 520 peptides in cheese samples. To the best of our knowledge, this is the most comprehensive survey of peptides in PR cheese. Most of them were from β-caseins, which represent the best substrate for LAB cell-envelope proteases. The abundance of peptides from β-casein 38-88 region continuously increased during ripening. Remarkably, this region contains precursors for the anti-hypertensive lactotripeptides VPP and IPP, as well as for β-casomorphins. We found that the ripening time strongly affects bioactive peptide profiles and that the occurrence of Lcb. zeae species is positively linked to the incidence of eight anti-hypertensive peptides. This result highlighted how the presence of specific LAB species is likely a pivotal factor in determining PR functional properties.

Keywords: Lacticaseibacillus; Parmigiano Reggiano cheese; bioactive peptides; natural whey starter; non-starter lactic acid bacteria; peptidomics; starter lactic acid bacteria.


Conflict of interest statement

VP was employed by Consorzio del Formaggio Parmigiano Reggiano. The remaining authors declare that the research was conducted in the absence of any commercial or financial relationships that could be construed as a potential conflict of interest. The author(s) declared that they were an editorial board member of Frontiers, at the time of submission. This had no impact on the peer review process and the final decision.

Figures
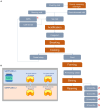
Figure 1
Figure 1
Flowchart depicting the PR cheese manufacturing process (A) and sampling strategy used in this study (B). In panel (A), numbers indicate sampling points. NWS, Natural whey starter.
Figure 2
Figure 2
Starter lactic acid bacteria (SLAB) plate counts from NWS samples. Data from dairies R (orange), C (green), and L (blue) are mean (n = 3) of Log10 CFU/mL values, while error bars represent standard deviations. Different letters indicate significant differences among samples and conditions (p < 0.05). nd—, Not determined.
Figure 3
Figure 3
Phylogenetic trees based on 16S rRNA gene sequences showing the relationship among rod-shape (A) and cocci (B) SLAB strains isolated from three NWS samples and the related neighbor’s species. The trees were inferred using the maximum likelihood method and the Kimura’s two-parameter model (Kimura, 1980) with Mega X software (Kumar et al., 2018). Representative isolates for each sample are shown with the sequence accession numbers indicated in brackets, while the sequence data of reference strains were from the NCBI RefSeq database. A discrete Gamma distribution was used to model evolutionary rate differences among sites. Bootstrap values are indicated at branch points based on 1,000 replications. Bootstrap values below 50% are not shown. Bar: 0.01 substitutions per nucleotide position. The trees are drawn in scale, with branch length measured in the number of substitutions per site. The trees were rooted using the branch leading to three outgroup species: W. coagulans, B. subtilis, and B. vallismortis for the panel (A) and E. faecalis for the panel (B).
Figure 4
Figure 4
Genotyping of 65 SLAB isolates from NWS samples. Dendrogram of (GTG)5-PCR fingerprints was built according to the Pearson correlation coefficient and UPGMA. Collapsed clades (S1–S12) represent 12 clusters with more than 90% similarity coefficient. Upper case letters from A to D indicate major clusters. Each knot shows the length of the arms. Colors were according to the species, as follows: blue, L. delbrueckii subsp. lactis; orange, L. helveticus; dark gray, St. thermophilus; and light gray, mixed species. The tree was visualized with ITOL (Letunic and Bork, 2019).
Figure 5
Figure 5
SLAB species frequencies (A) and distribution (B) in PR NSW samples. The numbers in the columns represent biotypes scored by the UPGMA analysis of (GTG)5 rep-PCR fingerprinting data.
Figure 6
Figure 6
Non-starter lactic acid bacteria (NSLAB) plate counts from cheese samples. Data from dairies R (orange) (A), C (green) (B), and L (blue) (C) are mean (n = 3) of Log10 CFU/mL values, while error bars represent standard deviations. Different letters indicate significant differences among samples and conditions (p < 0.05).
Figure 7
Figure 7
Phylogenetic tree based on 16S rRNA gene sequences showing the relationships among non-starter lactic acid bacteria (NSLAB) strains isolated from PR cheeses at 12, 18, 24, and 30 months of ripening. The tree was constructed using the maximum likelihood method and the Kimura’s two-parameter model (Kimura, 1980) in Mega X software. Representative isolates for each sample are shown in bold, with the sequence accession numbers indicated in brackets. Sequence data for reference strains were from the NCBI RefSeq database. A discrete Gamma distribution was used to model evolutionary rate differences among sites. The final dataset involved 24 nucleotide sequences for a total of 1,372 positions. Bootstrap values (>60%) are indicated at branch points based on 1,000 replications. The tree is rooted using the branch leading to four outgroup species (W. coagulans, B. subtilis, B. vallismortis, and E. faecalis). The tree is drawn in scale with branch length measured in the number of substitutions per site: bar, 0.01 substitutions per nucleotide position. The outgroup species are highlighted in the blue background, Lcb. rhamnosus in orange background, Lcb. casei/Lcb. zeae in green background, and Lcb. paracasei in light blue background, respectively. The tree was visualized with ITOL (Letunic and Bork, 2019).
Figure 8
Figure 8
Non-starter lactic acid bacteria (NSLAB) species frequencies (A) and distribution (B) in PR cheese samples. The numbers in the columns represent biotypes scored by UPGMA analysis of (GTG)5 rep-PCR fingerprinting data.
Figure 9
Figure 9
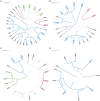
Genotyping of 189 NSLAB isolates from PR cheese samples. Trees (A–D) represent NSLAB isolates from 12, 18, 24, and 30 months of ripening, respectively. Dendrograms of (GTG)5-PCR fingerprints were built according to the Pearson correlation coefficient and UPGMA. In each tree, collapsed clades (S) represent clusters with more than 91% similarity coefficient. Each knot shows the length of the arms. Colors were according to the species, as follows: blue, Lcb. paracasei; pink, Lcb. rhamnosus; green, Lcb. zeae; and light gray, mixed group. The tree was visualized with ITOL (Letunic and Bork, 2019).
Figure 10
Figure 10
Number of peptides per protein in PR cheeses at different ripening times. Analysis was carried out on low-molecular-weight peptide fractions obtained by ultrafiltration at 3 kDa from the water-soluble peptide fractions extracted from the different PR cheeses. (A) Number of peptides per protein identified in PR cheeses from dairy C (orange) at 12, 18, 24, and 30 months of ripening. (B) Number of peptides per protein identified in PR cheeses from dairy L (green) at 12, 18, 24, and 30 months of ripening. (C) Number of peptides per protein identified in PR cheeses from dairy R (blue) at 12, 18, 24, and 30 months of ripening. (D) Number of peptides per protein averaged according to the ripening time. The complete list of identified peptides can be found in Supplementary Table S6.
Figure 11
Figure 11
Peptide abundance per protein in PR cheeses at different ripening times. Analysis was carried out on low-molecular-weight peptide obtained by ultrafiltration at 3 kDa from the water-soluble peptide fractions extracted from the different PR cheeses. (A) Total peptide abundance per protein in PR cheeses from dairy C at 12, 18, 24, and 30 months of ripening. (B) Total peptide abundance per protein in PR cheeses from dairy L at 12, 18, 24, and 30 months of ripening. (C) Total peptide abundance per protein in PR cheeses from dairy R at 12, 18, 24, and 30 months of ripening. (D) Total peptide abundance per protein averaged according to the ripening time. Data are reported as the sum of the intensity of each identified peptide measured as the area under the peak (AUP) by Skyline analysis. The complete list of identified peptides and the semi-quantitative data can be found in Supplementary Table S6.
Figure 12
Figure 12
Percentage of incidence of peptide abundance per protein in PR cheeses at different ripening times. (A) Percentage of incidence of total peptide abundance per protein in PR cheeses from dairy C at 12, 18, 24, and 30 months of ripening. (B) Percentage of incidence of total peptide abundance per protein in PR cheeses from dairy L at 12, 18, 24, and 30 months of ripening. (C) Percentage of incidence of total peptide abundance per protein in PR cheeses from dairy R at 12, 18, 24, and 30 months of ripening. (D) Percentage of incidence of total peptide abundance per protein averaged according to the ripening time.
Figure 13
Figure 13
ACE-inhibitory peptide abundance in PR cheeses at different ripening times. Analysis was carried out on low-molecular-weight peptide obtained by ultrafiltration at 3 kDa from the water-soluble peptide fractions extracted from the different PR cheeses (dairy R, orange; dairy C, green; and dairy L, blue). Data are reported as the sum of the intensity of each identified ACE-inhibitory peptide measured as the area under the peak (AUP) by Skyline analysis. The complete list of identified ACE-inhibitory peptides and the semi-quantitative data can be found in Supplementary Table S9.
Figure 14
Figure 14
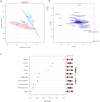
Partial least squares discriminant analysis (PLS-DA) of the bioactive peptide profile from dairies C, L, and R. Scores (A) and loadings (B) were analyzed at different ripening times (12, 18, 24, and 30 months). (C) Bioactive peptides with a VIP score > 1 were found throughout cheese ripening by PLS-DA analysis.

Similar articles

References

    1. Adamberg K., Antonsson M., Vogensen F. K., Nielsen E. W., Kask S., Møller P. L., et al. . (2005). Fermentation of carbohydrates from cheese sources by non-starter lactic acid bacteria isolated from semi-hard Danish cheese. Int. Dairy J. 15, 873–882. doi: 10.1016/j.idairyj.2004.07.017 - DOI
    1. Bancalari E., Sardaro M. L., Levante A., Marseglia A., Caligiani A., Lazzi C., et al. . (2017). An integrated strategy to discover Lactobacillus casei group strains for their potential use as aromatic starters. Food Res. Int. 100, 682–690. doi: 10.1016/j.foodres.2017.07.066, PMID: - DOI - PubMed
    1. Beresford T. P., Fitzsimons N. A., Brennan N. L., Cogan T. M. (2001). Recent advances in cheese microbiology. Int. Dairy J. 11, 259–274. doi: 10.1016/S0958-6946(01)00056-5 - DOI
    1. Bertani G., Levante A., Lazzi C., Bottari B., Gatti M., Neviani E. (2020). Dynamics of a natural bacterial community under technological and environmental pressures: the case of natural whey starter for Parmigiano Reggiano cheese. Food Res. Int. 129:108860. doi: 10.1016/j.foodres.2019.108860, PMID: - DOI - PubMed
    1. Bettera L., Levante A., Bancalari E., Bottari B., Gatti M. (2023). Lactic acid bacteria in cow raw milk for cheese production: which and how many. Front. Microbiol. 13:1092224. doi: 10.3389/fmicb.2022.1092224, PMID: - DOI - PMC - PubMed