. 2024 Jul 5;26(7):1280-1291.
doi: 10.1093/neuonc/noae068.

Circulating extracellular vesicles as biomarker for diagnosis, prognosis, and monitoring in glioblastoma patients

Affiliations

Circulating extracellular vesicles as biomarker for diagnosis, prognosis, and monitoring in glioblastoma patients

Franz L Ricklefs et al. Neuro Oncol. .

Abstract

Background: Extracellular vesicles (EVs) obtained by noninvasive liquid biopsy from patient blood can serve as biomarkers. Here, we investigated the potential of circulating plasma EVs to serve as an indicator in the diagnosis, prognosis, and treatment response of glioblastoma patients.

Methods: Plasma samples were collected from glioblastoma patients at multiple timepoints before and after surgery. EV concentrations were measured by nanoparticle tracking analysis and imaging flow cytometry. Tumor burden and edema were quantified by 3D reconstruction. EVs and tumors were further monitored in glioma-bearing mice.

Results: Glioblastoma patients displayed a 5.5-fold increase in circulating EVs compared to healthy donors (P < .0001). Patients with higher EV levels had significantly shorter overall survival and progression-free survival than patients with lower levels, and the plasma EV concentration was an independent prognostic parameter for overall survival. EV levels correlated with the extent of peritumoral fluid-attenuated inversion recovery hyperintensity but not with the size of the contrast-enhancing tumor, and similar findings were obtained in mice. Postoperatively, EV concentrations decreased rapidly back to normal levels, and the magnitude of the decline was associated with the extent of tumor resection. EV levels remained low during stable disease, but increased again upon tumor recurrence. In some patients, EV resurgence preceded the magnetic resonance imaging detectability of tumor relapse.

Conclusions: Our findings suggest that leakiness of the blood-brain barrier may primarily be responsible for the high circulating EV concentrations in glioblastoma patients. Elevated EVs reflect tumor presence, and their quantification may thus be valuable in assessing disease activity.

Keywords: blood; exosome; glioma; methylation; tetraspanin.


Conflict of interest statement

The authors declare no conflict of interest.

Figures

Figure 1.
Figure 1.
Concentration and prognostic relevance of circulating Extracellular vesicles (EVs) in glioblastoma patients. (A) EV levels in the plasma of glioblastoma (GBM) patients are increased compared to healthy donors (HD) as determined by NTA (Mann–Whitney). (B) Representative NTA graphs of particles isolated from HD and GBM patient plasma. (C) Transmission electron microscopy demonstrates the typical cup-shaped EV morphology. (D) Different subpopulations of EVs defined by tetraspanin markers in IFCM are increased in glioblastoma patients. Total EVs are defined as expressing at least one tetraspanin marker (Mann Whitney). (E) NTA particle counts correlate with EV counts measured by IFCM (linear regression). (F) Difference in overall survival (OS) and (G) progression-free survival (PFS) between patients with high vs. low circulating EV concentrations (Gehan-Breslow-Wilcoxon). (H) Multivariate analysis for prediction of OS and (I) PFS (Cox proportional hazards model). GTR, gross total resection; PR, partial resection; MGMT, O-6-methylguanine-DNA methyltransferase gene promoter methylation.
Figure 2.
Figure 2.
Correlations between EV concentration and clinical parameters. (A) Volumetric measurement of the contrast-enhancing tumor mass (top) and peritumoral FLAIR hyperintensity (bottom) with 3D reconstruction (right). (B) Association between tumor volume and plasma EV concentration and (C) between 3D FLAIR hyperintensity and EV concentration (n = 40, linear regression). (D) Correlation matrix of plasma EV concentration and clinical parameters and (E) blood parameters (Pearson). Correlation coefficients and significant P-values are shown in (D), and significant P-values are represented by asterisks in (E). BMI, body mass index; CRP, c-reactive protein; NLR, neutrophil-to-lymphocyte ratio; PLR, platelet-to-lymphocyte ratio; LMR, lymphocyte-to-monocyte ratio.
Figure 3.
Figure 3.
Dynamics of circulating Extracellular vesicles (EVs) in tumor-bearing mice. (A) Tumor cells (CT2A) were injected intracerebrally on day 0. Mice were sacrificed after 3–12 days of tumor growth and plasma EV concentrations were determined by NTA (Kruskall–Wallis, Dunn’s). (B) Correlations between plasma EV concentration, peritumoral edema volume, and tumor volume, showing correlation coefficients and P-values (Pearson). (C) Representative magnetic resonance imaging (MRI) analysis of mice bearing CT2A tumors. Tumors identified on hematoxylin and eosin (H&E)-stained sections were highlighted and merged into the corresponding T2-weighted MRI images and apparent diffusion coefficient maps, as demonstrated on the fused images. Surrounding edema was outlined by merging the T2-weighted MRI images with the apparent diffusion coefficient maps. (D) Correlation matrix of blood parameters, showing no correlation with plasma EV concentration (Pearson). PDW, platelet distribution width; MPV, mean platelet volume; P-LCR, platelet large cell ratio; PCT, procalcitonin.
Figure 4.
Figure 4.
Association between plasma EV levels and tumor presence in glioblastoma patients. (A) Rapid postoperative reduction of circulating Extracellular vesicles (EVs) down to healthy donor levels, measured by NTA (Kruskal–Wallis, Dunn’s). (B) EV concentration dynamics in individual patients within the first postoperative days 1–6 (n = 34, Friedman, Dunn’s). (C) Microscopic NTA image of plasma EVs in a glioblastoma patient before and after surgery (scale bars indicate 100 µm; D) EV concentration 4–6 days postoperatively in patients who received either subtotal tumor resection (STR) or gross total resection (GTR), (t-test). (E) Negative fold-change of postoperative EV concentrations in comparison to preoperative levels in individual patients (Mann–Whitney). (F–I) Decrease of tetraspanin-positive EV subpopulations 4–6 days after surgery, measured by IFCM (Wilcoxon).
Figure 5.
Figure 5.
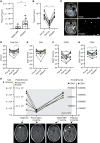
Longitudinal monitoring of patients by EV quantification and magnetic resonance imaging (MRI). (A) Elevated circulating EVs in patients with stable MRI (n = 7, meantime postoperation 7 months, range 3–12 months) vs. tumor relapse (n = 12, meantime postoperation 8 months, range 3–14 months), (Mann–Whitney). (B) EV concentration reflects tumor presence in individual patients (n = 11, Friedman, Dunn’s). C) Representative MRI and NTA images from a single patient during stable disease (top) and at tumor recurrence (bottom; scale bars indicate 100 µm; D–G) Dynamics of tetraspanin positive EV subpopulations measured by IFCM (Friedman, Dunn’s). (H) Re-increase in plasma EVs preceding detection of tumor recurrence by MRI in an individual patient. Total EVs in IFCM analysis are defined as expressing at least one tetraspanin marker. White arrows on MRI images mark the tumor.

References

    1. Stupp R, Mason WP, van den Bent MJ, et al.; European Organisation for Research and Treatment of Cancer Brain Tumor and Radiotherapy Groups. Radiotherapy plus concomitant and adjuvant temozolomide for glioblastoma. N Engl J Med. 2005;352(10):987–996. - PubMed
    1. Abbasi AW, Westerlaan HE, Holtman GA, et al.. Incidence of tumour progression and pseudoprogression in high-grade gliomas: A systematic review and meta-analysis. Clin Neuroradiol. 2018;28(3):401–411. - PMC - PubMed
    1. Westphal M, Lamszus K.. Circulating biomarkers for gliomas. Nat Rev Neurol. 2015;11(10):556–566. - PubMed
    1. Maire CL, Fuh MM, Kaulich K, et al.. Genome-wide methylation profiling of glioblastoma cell-derived extracellular vesicle DNA allows tumor classification. Neuro Oncol. 2021;23(7):1087–1099. - PMC - PubMed
    1. Andre-Gregoire G, Bidere N, Gavard J.. Temozolomide affects extracellular vesicles released by glioblastoma cells. Biochimie. 2018;155:11–15. - PubMed

Publication types

MeSH terms

Substances