. 2024 Apr 3:12:RP90158.
doi: 10.7554/eLife.90158.

Stimulation of VTA dopamine inputs to LH upregulates orexin neuronal activity in a DRD2-dependent manner

Affiliations

Stimulation of VTA dopamine inputs to LH upregulates orexin neuronal activity in a DRD2-dependent manner

Masaya Harada et al. Elife. .

Abstract

Dopamine and orexins (hypocretins) play important roles in regulating reward-seeking behaviors. It is known that hypothalamic orexinergic neurons project to dopamine neurons in the ventral tegmental area (VTA), where they can stimulate dopaminergic neuronal activity. Although there are reciprocal connections between dopaminergic and orexinergic systems, whether and how dopamine regulates the activity of orexin neurons is currently not known. Here we implemented an opto-Pavlovian task in which mice learn to associate a sensory cue with optogenetic dopamine neuron stimulation to investigate the relationship between dopamine release and orexin neuron activity in the lateral hypothalamus (LH). We found that dopamine release can be evoked in LH upon optogenetic stimulation of VTA dopamine neurons and is also naturally evoked by cue presentation after opto-Pavlovian learning. Furthermore, orexin neuron activity could also be upregulated by local stimulation of dopaminergic terminals in the LH in a way that is partially dependent on dopamine D2 receptors (DRD2). Our results reveal previously unknown orexinergic coding of reward expectation and unveil an orexin-regulatory axis mediated by local dopamine inputs in the LH.

Keywords: D2 receptors; Pavlovian conditioning; dopamine; hypothalamys; mouse; neuroscience; nucleus accumbens; optogenetics; orexin.


Conflict of interest statement

MH, LC, MW, DB, TP No competing interests declared

Figures

Figure 1.
Figure 1.. Dopamine transients in nucleus accumbens during an opto-Pavlovian task.
(A) Preparation for opto-Pavlovian task combined with dLight recordings in the nucleus accumbens (NAc). Scale bar: 1 mm. White dashed lines indicate fiber tracts. (B) Schematic for opto-Pavlovian task. One cue was associated with the laser delivery while the other cue was not. (C) dLight recordings in the NAc of a representative mouse around the laser-paired cue presentation at session (left) and grouped data (middle). dLight recordings of non-laser-paired trials are also shown (right) at session 1. (D) dLight signals at session 1 during laser stimulation. The signals during non-laser trials are also shown. (E) The signals of a representative mice around laser-paired cue (left), grouped data (middle), and signals around non-laser-paired cue presentation (right) at session 10. (F) Area under the curve (AUC) of dLight signal in the NAc around the cue presentations (0–1.5 s) across sessions. Laser-paired cue triggered bigger transient than non-laser-paired cue. Two-way repeated-measures ANOVA. Session, F9, 27 = 3.339, p=0.0072. Cue, F1, 3 = 3.997, p=0.139. Interaction, F9, 27 = 5.287, p=0.0003. Tukey’s multiple comparison, *p<0.05, **p<0.01,***p<0.001, and ***p<0.0001. n = 4 mice.
Figure 1—figure supplement 1.
Figure 1—figure supplement 1.. dLight recordings in the nucleus accumbens (NAc) during non-laser-paired cue delivery at sessions 1 (left) and 10 (right).
Figure 2.
Figure 2.. Accumbal dopamine transients during opto-Pavlovian omission trials.
(A) Schematic for the omission sessions. Two-thirds of laser-associated cue were followed by the laser stimulation while the other one-third of the laser-associated cue failed to trigger the laser stimulation. (B) dLight recordings of a representative mouse during omission sessions. dLight signal around the laser-paired cue presentation is shown here. White asterisks indicate omission trials, while in the other trials, the laser stimulation was delivered. (D) dLight recordings in the nucleus accumbens (NAc) during stimulation trials and during omission trials (C). A dip of dLight signals was observed. One-sample t-test; t = 4.176, df = 3. p=0.0250. n = 4 mice.
Figure 3.
Figure 3.. Mesohypothalamic dopamine dynamics associated with the opto-Pavlovian task.
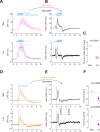
(A) Schematic for the dLight recording in the lateral hypothalamus (LH) while stimulating dopamine neurons in the ventral tegmental area (VTA) (left). Coronal image of the LH of a mouse infected with AAV-hSyn-DIO-Chrimson-tdTomato in the VTA and AAV-hSyn-dLight1.3b in the LH (right). White dashed lines indicate fiber tracts. Scale bar: 1 mm. (B) dLight signal in the LH during dopaminergic stimulation in the VTA at several number of pulses (20 Hz, 10 ms duration for each pulse). (C) dLight recordings during the laser-paired cue presentation of a representative mouse at session 1. (D) dLight recordings around the laser-paired cue presentation (left) and non-laser-paired cue presentation (right) at session 1. (E). dLight recordings during the laser-paired cue presentation of a representative mouse at session 10. (F). dLight recordings around the laser-paired cue presentation (left) and non-laser-paired cue presentation (right) at session 10. (G) Area under the curve (AUC) of dLight signal in the LH around the cue presentations (0–1.5 s) across sessions. Laser-paired cue triggered bigger transient than non-laser-paired cue. Two-way repeated-measures ANOVA. Session, F9, 27 = 3.814, p=0.0033. Cue, F1, 3 = 5.818, p=0.0948. Interaction, F9, 27 = 3.923, p=0.0027. Tukey’s multiple comparison, *p<0.05, **p<0.01,***p<0.001, and ***p<0.0001. (H) dLight recordings in the LH during omission trials. A dip in dLight signals was observed. One-sample t-test; t = 3.193, df = 3. p=0.0496. n = 4 mice.
Figure 4.
Figure 4.. Kinetic differences in dopamine transients between mesoaccumbens and mesohypothalamic pathways.
(A) dLight recordings in the nucleus accumbens (NAc) (top) and lateral hypothalamus (LH) (bottom) during optical stimulation of ventral tegmental area (VTA) dopamine neurons. (B) Derivative of panel (A). (C) quantification of zero-crossing point in panel (B) after the initiation of laser stimulation. Unpaired t-test; t = 21.69, df = 6. p<0.0001. (D) dLight recordings in the NAc (top) and LH (bottom) during omission trials. (E) Derivative of panel (D). (F) Quantification of first (top, point A) and second (bottom, point B) zero-crossing points after the initiation of the cue in panel (E). Top, unpaired t-test. t = 2.920, df = 6. p=0.0266. bottom, unpaired t-test. t = 2.614, df = 6. p=0.0399. Note that panels (A) and (D) are shown in Figures 2 and 3 also. They are displayed for comparison purposes.
Figure 5.
Figure 5.. Orexin neuronal activity during an opto-Pavlovian task.
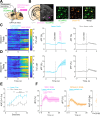
(A) Schematic of the preparation for opto-Pavlovian task combined with orexin promoter GCaMP recordings in the lateral hypothalamus (LH). (B) Coronal image of a mouse brain slice infected with AAV-hSyn-DIO-ChrimsonR-tdTomato in the ventral tegmental area (VTA) and AAV1-hOX-GcaMP6S in the LH (left; scale bar; 1 mm). White dashed lines indicate fiber tracts. Zoom of infected LH with AAV1-hOX-GcaMP6s and co-localization orexin IR and GcaMP6s (right; scale bars; 50 μm). (C) Orexin promoter GcaMP recordings in the LH of a representative mouse around the laser-paired cue presentation at session 1 (left), grouped data (middle) and recordings during non-laser-paired trial (right). (D) Orexin promoter GcaMP recordings in the LH of a representative mouse around the laser-paired cue presentation at session 10 (left), grouped data (middle), and recordings during non-laser trial (right). (E) Area under the curve (AUC) of hOX-GcaMP signal in the LH around the cue presentations (0–1.5 s) across sessions. Laser-paired cue triggered bigger transient than non-laser-paired cue. Two-way repeated-measures ANOVA. Session, F9, 27 = 4.438, p=0.0012. Cue, F1, 3 = 25.41, p=0.0151. Interaction, F9, 27 = 4.125, p=0.0020. Tukey’s multiple comparison, *p<0.05, **p<0.01, ***p<0.001, and ***p<0.0001. (F) Orexin promoter GCaMP recordings during stimulation trials (left) and omission trials (middle and right). AUC around the omission was higher than baseline. One-sample t-test; t = 4.693, df = 3. p=0.0183. n = 4 mice.
Figure 5—figure supplement 1.
Figure 5—figure supplement 1.. Orexin-promoter GCaMP recording (left) and dLight recording during stimulation at session 1.
Figure 6.
Figure 6.. DA-dependent modulation of orexin neuronal activity is dependent on DRD2.
(A) Schematic for the orexin promoter GCaMP recording in the lateral hypothalamus (LH) while stimulating dopamine terminals in the LH. (B) Orexin promoter GCaMP signals of a representative mouse. Recordings were performed while mice were freely moving (top) and anesthetized with isoflurane (bottom). Red bars indicate the stimulation (20 Hz, 100 pulses, 10 ms duration). (C) Orexin promoter GCaMP signals around the stimulation of dopamine terminals in the LH while animals were freely moving (left) and anesthetized (right). (D) Area under the curve (AUC) at 0–20 s was not significantly different between freely moving and anesthetized conditions. Paired t-test, t = 1.923, df = 2. p=0.1944. n = 3 mice. (E) In freely moving condition, recordings were performed after mice received the intraperitoneal injection of vehicle (left), SCH 23390 (1 mg/kg, middle), and raclopride (1 mg/kg, right). (F) AUC at 0–5 s. Black line indicates the mean for each condition and gray lines show individual mice. The administration of raclopride decreased the AUC significantly while SCH 23390 did not change the AUC. One-way ANOVA; F (3, 6) = 5.305, p=0.04. Tukey’s multiple comparison test. vehicle vs. SCH 23390; p=0.8145. vehicle vs. raclopride; p=0.0476. n = 4 mice.
Figure 6—figure supplement 1.
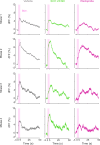
Figure 6—figure supplement 1.. Individual traces for Figure 6E.
Author response image 1.

Update of

  • doi: 10.1101/2023.06.13.544720
  • doi: 10.7554/eLife.90158.1
  • doi: 10.7554/eLife.90158.2

References

    1. Baik JH. Dopamine signaling in reward-related behaviors. Frontiers in Neural Circuits. 2013;7:152. doi: 10.3389/fncir.2013.00152. - DOI - PMC - PubMed
    1. Baimel C, Lau BK, Qiao M, Borgland SL. Projection-Target-Defined Effects of Orexin and Dynorphin on VTA Dopamine Neurons. Cell Reports. 2017;18:1346–1355. doi: 10.1016/j.celrep.2017.01.030. - DOI - PubMed
    1. Borgland SL, Taha SA, Sarti F, Fields HL, Bonci A. Orexin A in the VTA is critical for the induction of synaptic plasticity and behavioral sensitization to cocaine. Neuron. 2006;49:589–601. doi: 10.1016/j.neuron.2006.01.016. - DOI - PubMed
    1. Bracey EF, Grujic N, Peleg-Raibstein D, Burdakov D. Coding of Reward Uncertainty and Probability by Orexin Neurons. bioRxiv. 2022 doi: 10.1101/2022.04.13.488195. - DOI
    1. Bubser M, Fadel JR, Jackson LL, Meador-Woodruff JH, Jing D, Deutch AY. Dopaminergic regulation of orexin neurons. The European Journal of Neuroscience. 2005;21:2993–3001. doi: 10.1111/j.1460-9568.2005.04121.x. - DOI - PubMed