. 2024 Apr 3:12:RP87811.
doi: 10.7554/eLife.87811.

A concerted increase in readthrough and intron retention drives transposon expression during aging and senescence

Affiliations

A concerted increase in readthrough and intron retention drives transposon expression during aging and senescence

Kamil Pabis et al. Elife. .

Abstract

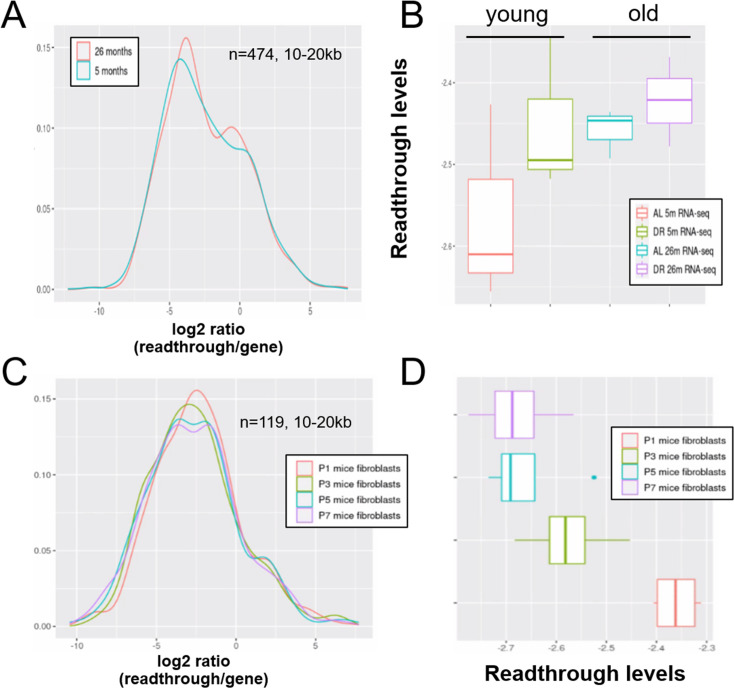
Aging and senescence are characterized by pervasive transcriptional dysfunction, including increased expression of transposons and introns. Our aim was to elucidate mechanisms behind this increased expression. Most transposons are found within genes and introns, with a large minority being close to genes. This raises the possibility that transcriptional readthrough and intron retention are responsible for age-related changes in transposon expression rather than expression of autonomous transposons. To test this, we compiled public RNA-seq datasets from aged human fibroblasts, replicative and drug-induced senescence in human cells, and RNA-seq from aging mice and senescent mouse cells. Indeed, our reanalysis revealed a correlation between transposons expression, intron retention, and transcriptional readthrough across samples and within samples. Both intron retention and readthrough increased with aging or cellular senescence and these transcriptional defects were more pronounced in human samples as compared to those of mice. In support of a causal connection between readthrough and transposon expression, analysis of models showing induced transcriptional readthrough confirmed that they also show elevated transposon expression. Taken together, our data suggest that elevated transposon reads during aging seen in various RNA-seq dataset are concomitant with multiple transcriptional defects. Intron retention and transcriptional readthrough are the most likely explanation for the expression of transposable elements that lack a functional promoter.

Keywords: aging; chromosomes; gene expression; human; intron retention; mouse; senescense; transcriptional readthrough; transposon expression.


Conflict of interest statement

KP, DB, OS, KS, JG, BK No competing interests declared

Figures

Figure 1.
Figure 1.. A concerted increase in transposon and intron expression with aging and senescence.
Transposon (A) and intron (B) expression is increased in skin fibroblasts isolated from aged individuals. What is more, expression of both transposons and introns shows a significant correlation (C). Similarly, transposon (D) and intron (E) expression is increased in MDAH041 cells induced into senescence (sen) by treatment with drugs or via passaging. Normalized reads from the top 1000 differentially expressed genes, transposons and introns were used in this analysis. (A) Transposon reads normalized by the expression of adjacent genes plotted across five age groups (adolescent n = 32, young n = 31, middle-aged n = 22, old n = 37, and very old n = 21). (B) Intron reads normalized by the expression of adjacent genes plotted across five age groups (adolescent n = 32, young n = 31, middle-aged n = 22, old n = 37, and very old n = 21). (C) Scatterplot between transposon and intron expression (normalized as in A and B) for all 143 samples. Each sample is colored by age. (D) Transposon reads normalized by the expression of adjacent genes plotted across four senescent conditions (H2O2, 5-azacytidine, adriamycin, and replicative senescence) and four other conditions (serum-starved, immortalized, intermediate passage, and early passage). N = 3 per group. (E) Intron reads normalized by the expression of adjacent genes plotted across four senescent conditions (H2O2, 5-azacytidine, adriamycin, and replicative senescence) and four other conditions (serum-starved, immortalized, intermediate passage, and early passage). N = 3 per group. (F) Scatterplot between transposon and intron expression (normalized as in E and F) for all 24 samples. Each sample is colored by senescence status.
Figure 1—figure supplement 1.
Figure 1—figure supplement 1.. Aging promotes readthrough, transposon expression, and intron retention.
Readthrough, transposon expression, and intron retention are elevated with aging when the expression of each element is normalized to the nearest gene (A) and similarly when all the reads are normalized to library size (B). Reads from the top 1000 differentially expressed elements were used in this analysis (n < 1000 for readthrough after filtering).
Figure 1—figure supplement 2.
Figure 1—figure supplement 2.. Transposons show strand-specific expression.
Transposons with inverted strandedness (reverse) show lower expression levels (log counts; A) and no differential expression with age (B) when compared to matched differentially expressed transposons (actual). For this analysis, we selected all transposons showing significant differential expression with age in the actual dataset that also showed at least minimal expression in the strand-inverted analysis (n = 226). Data from Fleischer et al., 2018. (A) The log (counts) are clipped because we only used transposons that passed minimal read filtering in this analysis. (B) The distribution of expression values in the actual dataset is bimodal and positive since some transposons are significantly up- or downregulated. This bimodal distribution is lost in the strand-inverted analysis.
Figure 1—figure supplement 3.
Figure 1—figure supplement 3.. Stronger upregulation of transposons and introns than of genic transcripts.
Intron, readthrough, and transposon elements are more strongly elevated with age (A) and cellular senescence (B) than are genic transcripts. The percentage of upregulated transcripts is indicated above each violin plot and the median log10-fold change for genic transcripts is indicated with a dashed red line. (A) Log10-fold changes plotted for all elements that significantly change with age (genes, introns, readthrough, transposon, and read-in transcripts). (B) Log10-fold changes plotted for all elements that significantly change with induced senescence (genes, introns, readthrough, transposon, and read-in transcripts). The four senescent conditions (H2O2, 5-Aza, adriamycin, and replicative senescence) are grouped together and compared with four control conditions (serum-starved, immortalized, intermediate passage, and early passage).
Figure 1—figure supplement 4.
Figure 1—figure supplement 4.. Increased transposon expression and intron retention in liver of aged mice.
Transposon expression (A) and intron retention (B) are increased in the liver of 26-month-old mice. In contrast, transposon expression (C) and intron retention (D) are decreased with replicative senescence of mouse fibroblasts. Normalized counts from all (A, B) and top 1000 (C, D) differentially expressed genes, transposons and introns were used in this analysis. Mouse liver data are from Hahn et al., 2017 (GSE92486) and mouse replicative senescence data from Wang et al., 2022 (GSE179880). (A) Transposon reads normalized by the expression of adjacent genes plotted for each sample (ad libitum [AL] 5-month-old, AL 26-month-old, dietary restricted [DR] 5-month-old, and DR 26-month-old, n = 3 per group) (B) Intron reads normalized by the expression of adjacent genes plotted for each sample as in (A). (C) Transposon reads normalized by the expression of adjacent genes plotted for each sample (fibroblasts from passage [P] 1, 3, 5, and 7, n = 4 per group). (D) Intron reads normalized by the expression of adjacent genes plotted for each sample as in (C).
Figure 1—figure supplement 5.
Figure 1—figure supplement 5.. Aging promotes readthrough, transposon expression, and intron retention in mouse liver.
Intron, readthrough, and transposon elements are elevated in the liver of aging mice (26- vs 5-month-old, n = 6 per group). Readthrough and transposon expression is especially elevated even when compered to genic transcripts. The percentage of upregulated transcripts is indicated above each violin plot and the median log10-fold change for genic transcripts is indicated with a dashed red line.
Figure 1—figure supplement 6.
Figure 1—figure supplement 6.. Correlated age-related increase of transposon and intron loci.
Intron and transposon expression show a significant correlation. For every transposon within an intron, the correlation between the log-fold change of the intron and the transposon is plotted. Scatter plots are shown for all transposons and introns (A, B) and all transposons and introns that are significantly changed (C, D) in the aging dataset (A, C) and with cellular senescence (B, D).
Figure 1—figure supplement 7.
Figure 1—figure supplement 7.. Correlated expression of transposon and intron loci.
Intronic counts are correlated with the counts of intronic transposons in the aging dataset (A) and in the senescence dataset (B). In contrast, intragenic reads aligning outside of introns do not correlate with the counts of intronic transposons (labeled ‘outside’). Intronic counts also show no correlation with randomized transposon counts (labeled ‘rand’). Pearson correlation was performed for each sample in these datasets and the R-values for all the samples are shown here. Intronic counts for a gene were defined as the sum of all its intronic counts.
Figure 1—figure supplement 8.
Figure 1—figure supplement 8.. Transposons are depleted at splice junctions.
Transposons are evenly distributed within introns except for the region close to splice junctions (A–E). Transposons appear to be excluded from the splice junction-adjacent region both in all introns (A, D) and in significantly retained introns (B, E). In addition, transposon density of all introns and significantly retained introns is comparable (C, F). We included only introns containing at least one transposon in this analysis and normalized their length to 1. (A) Distribution of 2,292,769 transposons within 163,498 introns among all annotated transposons. (B) Distribution of 195,190 transposons within 14,100 introns significantly retained with age. (C) Density (transposon/1 kb of intron) of transposons in all introns (n = 163,498) compared to significantly retained introns (n = 14,100). (D) as in (A). (E) Distribution of 428,130 transposons within 13,205 introns significantly retained with induced senescence. (F) Density (transposon/1 kb of intron) of transposons in all introns (n = 163,498) compared to significantly retained introns (n = 13,205).
Figure 1—figure supplement 9.
Figure 1—figure supplement 9.. Introns with and without transposons are retained during aging and senescence.
We split the set of introns that significantly change with cellular aging (A) or cell senescence (B) into introns that contain at least one transposon (has_t) and those that do not contain any transposons (has_no_t). Intron retention is increased in both groups. In this analysis, we included all introns that passed minimal read filtering (n = 63,782 in A and n = 124,173 in B). Median log-fold change indicated with a dashed red line for the group of introns without transposons.
Figure 2.
Figure 2.. A schematic model of transposon expression.
In our model, represented in this schematic, transcription (A) can give rise to mRNAs and pre-mRNAs that contain retained introns when co-transcriptional splicing is impaired. This is often seen during aging and senescence, and these can contain transposon sequences (B). In addition, transcription can give rise to mRNAs and pre-mRNAs that contain transposon sequences toward the 3′-end of the mRNA when co-transcriptional termination at the polyadenylation signal (PAS) is impaired (C, D) as seen with aging and senescence. Some of these RNAs may be successfully polyadenylated (as depicted here) whereas others will be subject to nonsense mediated decay. Image created with Biorender.
Figure 3.
Figure 3.. Biased distribution of extragenic transposons relative to genes.
(A) Extragenic transposons with significantly (sig.) changed expression during aging or cellular senescence show a biased distribution, when mapped back onto the genome, with a preference toward a 5-kb region at the 3′-end of genes when compared to all annotated transposons (all) or randomly permuted transposons (random). Permutation was performed using the bedtools shuffle function. (B) Extragenic transposons whose expression changes during cellular senescence are spread out further from genes compared to aging-associated transposons.
Figure 3—figure supplement 1.
Figure 3—figure supplement 1.. Increased readthrough levels with aging and senescence.
Readthrough transcription is increased in fibroblasts isolated from the very old (A, B) and after induction of senescence in vitro (C, D). (A) Readthrough was determined in a region 0–10 kb downstream of genes for a subset of genes that were at least 10 kb away from the nearest neighboring gene (n = 684 regions). The log2 ratio of readthrough to gene expression is plotted across five age groups (adolescent n = 32, young n = 31, middle-aged n = 22, old n = 37, and very old n = 21). (B) As in (A), but data are plotted on a per sample basis. (C) Readthrough was determined in a region 0–10 kb downstream of genes for a subset of genes that were at least 10 kb away from the nearest neighboring gene (n = 1045 regions). The log2 ratio of readthrough to gene expression is plotted for the groups comprising senescence (n = 12) and the non-senescent group (n = 6). (D) As in (D), but data are plotted on a per sample basis and for additional control datasets (serum-starved, immortalized, intermediate passage, and early passage). N = 3 per group.
Figure 4.
Figure 4.. Increased readthrough levels with aging and senescence.
Readthrough transcription is increased in fibroblasts isolated from the very old (A, B) and after induction of senescence in vitro (D, E). Readthrough transcription is correlated with transposon expression (C, F). (A) Readthrough was determined in a region 10- to 20-kb downstream of genes for a subset of genes that were at least 20 kb away from the nearest neighboring gene (n = 200 regions). The log2 ratio of readthrough to gene expression is plotted across five age groups (adolescent n = 32, young n = 31, middle-aged n = 22, old n = 37, and very old n = 21). (B) As in (A), but data are plotted on a per sample basis. (C) Scatterplot between transposon expression and readthrough levels (normalized as in A and Figure 1) for all 143 samples. Each sample is colored by age. (D) Readthrough was determined in a region 10- to 20-kb downstream of genes for a subset of genes that were at least 20 kb away from the nearest neighboring gene (n = 299 regions). The log2 ratio of readthrough to gene expression is plotted across four senescent conditions (H2O2, 5-Aza, adriamycin, and replicative senescence) and for early passage cells. N = 3 per group. (E) As in (D), but data are plotted on a per sample basis and for additional control datasets (serum-starved, immortalized, intermediate passage, and early passage). N = 3 per group. (F) Scatterplot between transposon expression and readthrough levels (normalized as in A and Figure 1) for all 24 samples. Each sample is colored by senescence status.
Figure 4—figure supplement 1.
Figure 4—figure supplement 1.. Readthrough transcription might be increased with age in mouse liver, but not during in vitro senescence of mouse fibroblasts.
Readthrough transcription is non-significantly increased with age in mouse liver (A, B) and this increase is not attenuated by dietary restriction (B). In contrast, there is no increase in readthrough when mouse fibroblasts undergo replicative senescence (C, D). (A) Readthrough was determined in a region 10- to 20-kb downstream of genes for a subset of genes that were at least 20 kb away from the nearest neighboring gene (n = 474 genes). The log2 ratio of readthrough to gene expression is plotted for liver samples from 5- and 26-month-old mice (n = 6 per group). (B) As in (A), but data are plotted on a per-sample-basis (n = 3 per group). (C) Readthrough was determined in a region 10- to 20-kb downstream of genes for a subset of genes that were at least 20 kb away from the nearest neighboring gene (n = 119 genes). The log2 ratio of readthrough to gene expression is plotted across five age groups (n = 4 per group). (D) As in (C), but data are plotted on a per-sample-basis.
Figure 4—figure supplement 2.
Figure 4—figure supplement 2.. Readthrough is increased downstream of genes over a wide range of distances.
Transcriptional readthrough observed with aging or cellular senescence is elevated over a wide region downstream of genes. Readthrough levels were determined for each 10-kb interval downstream of genes, in the range between 0 and 100 kb using the same approach as in Figure 4. Values for each gene and treatment group were log-transformed and pooled. The difference between treatment (either senescence or aging) and controls is shown here. Higher numbers indicate stronger readthrough. The senescence group comprises data from H2O2 treatment, adriamycin, 5-azacytidine, and replicative senescence. The aging group comprises data from the very old subgroup (85–96 years-old) and was compared to the middle-aged group.
Figure 4—figure supplement 3.
Figure 4—figure supplement 3.. Read-in does not change with age and is increased by senescence.
Read-in expression is unchanged with aging (A) whereas it is increased with cellular senescence (B). (A) Read-in normalized by the expression of adjacent genes plotted across five age groups (adolescent n = 32, young n = 31, middle-aged n = 22, old n = 37, and very old n = 21). (B) Read-in normalized by the expression of adjacent genes plotted across four senescent conditions (H2O2, 5-azacytidine, adriamycin, and replicative senescence) and four other conditions (serum-starved, immortalized, intermediate passage, and early passage). N = 3 per group.
Figure 4—figure supplement 4.
Figure 4—figure supplement 4.. Readthrough and transposon counts are higher closer to genes.
Readthrough counts (rt_counts) decrease exponentially downstream of genes, both in the aging dataset (A) and in the cellular senescence dataset (B). Although noisier, the pattern for transposon counts (transp_cum_counts) is similar with higher counts closer to gene terminals, both in the aging dataset (C) and in the cellular senescence dataset (D). Readthrough counts are the cumulative counts across all genes and samples. Readthrough was determined in 10 kb bins and the values are assigned to the midpoint of the bin for easier plotting. Transposon counts are the cumulative counts across all samples for each transposon that did not overlap a neighboring gene. n = 801 in (C) and n = 3479 in (D).
Figure 4—figure supplement 5.
Figure 4—figure supplement 5.. Age-related transposon expression downstream of high readthrough genes is elevated.
Transposons found downstream of genes with high readthrough (hi_RT) show a more pronounced log-fold change (transp_logfc) than transposons downstream of genes with low readthrough (low_RT). This is true in fibroblasts isolated from aged donors (A) and with cellular senescence (B). Furthermore, the difference between high and low readthrough region transposons is diminished for transposons that are more than 10 kb downstream of genes (Transp >10 kb). Transposons in high readthrough regions were defined as those in the top 20% of readthrough log-fold change. Readthrough was measured between 0 and 10 kb downstream from genes. n = 2124 transposons in (A) and n = 6061 transposons in (B) included in the analysis.
Figure 4—figure supplement 6.
Figure 4—figure supplement 6.. Intergenic transposons are rarely expressed.
Total counts are the sum of all counts from transposons located in introns, genes, downstream (ds), or upstream (us) of genes (distance to gene <25 kb) or in intergenic regions (distance to gene >25 kb). Counts were defined as cumulative counts across all samples.
Figure 4—figure supplement 7.
Figure 4—figure supplement 7.. Age-related changes in readthrough are correlated with changes in transposon expression.
Readthrough and transposon expression are correlated. For every transposon downstream of a gene, the correlation between the log-fold change (logFC) of the transposon and the adjacent readthrough region is plotted. Readthrough was measured in a 10- to 20-kb region downstream of the gene. (A) Log-fold changes for all significant transposons plotted against log-fold changes for all significant, adjacent readthrough regions in the aging dataset. (B) Log-fold changes for all significant transposons plotted against log-fold changes for all significant, adjacent readthrough regions in the senescence dataset. (C) Log-fold changes for all transposons plotted against log-fold changes for all adjacent readthrough regions in the aging dataset. (D) Log-fold changes for all transposons plotted against log-fold changes for all adjacent readthrough regions in the senescence dataset.
Figure 4—figure supplement 8.
Figure 4—figure supplement 8.. Positive correlation between readthrough counts and transposons downstream of genes.
Readthrough counts are correlated with the counts of transposons downstream of genes in the aging dataset (A) and in the senescence dataset (B). In contrast, readthrough counts do not correlate with counts of transposons upstream of genes. Readthrough counts also show no correlation with randomized transposon counts (labeled ‘rand’). Pearson correlation was performed for each sample in these datasets and the R-values for all the samples are shown here. Readthrough and transposons were restricted to a region 10-kb up- or downstream of genes.
Figure 5.
Figure 5.. Elevated transposon expression after induced readthrough.
Readthrough transcription is increased after KCl treatment of HEK293 cells (A, D) and to a lesser extent during influenza infection (D). These readthrough inducing treatments also promote increased transposon expression (B, E). Giving rise to a correlation between readthrough and transposon expression on a per sample basis (C, F). Data in (A–C) are from Rosa-Mercado et al., 2021. In this study, HEK293 cells were subjected to 1 hr of hyperosmotic stress (KCl) after which RNA-seq and TT-TL-seq were performed. Data in (D–F) are from Bauer et al., 2018. In this study, HEK293 cells were subjected to 1 hr of hyperosmotic stress (KCl) after which mNETseq was performed. (A) Readthrough was determined in a region 10- to 20-kb downstream of genes for a subset of genes that was at least 20 kb away from the nearest neighboring gene (n = 1420 regions). (B) To normalize transposon expression counts for each transposon were corrected for the expression of the nearest gene. Normalized transposon counts for each sample are shown as box-whisker plot. (C) Normalized transposon counts (as in B) and readthrough levels are plotted for each sample (n = 12). (D) Readthrough was determined in a region 10- to 20-kb downstream of genes for a subset of genes that was at least 20 kb away from the nearest neighboring gene (n = 2222 regions). (E) To normalize transposon expression counts for each transposon were corrected for the expression of the nearest gene. Normalized transposon levels for each sample are shown as box-whisker plot. (F) Normalized transposon counts (as in B) and readthrough counts are plotted for each sample (n = 22). The shapes indicate the cell type (circles = HEK293, triangles = A549).
Figure 5—figure supplement 1.
Figure 5—figure supplement 1.. Elevated transposon expression after induced readthrough.
Readthrough transcription is increased after heatshock treatment of NIH-3T3 fibroblasts and to a lesser extend after KCl and hydrogen peroxide (A). These readthrough inducing treatments also promote increased transposon expression (B). Therefore readthrough and transposon expression are correlated on a per-sample-basis (C). Data from Vilborg et al., 2017. (A) Readthrough was determined in a region 10- to 20-kb downstream of genes for a subset of genes that was at least 20 kb away from the nearest neighboring gene (n = 732 genes). (B) To normalize transposon expression counts for each transposon were corrected for the expression of the nearest gene. Normalized transposon counts for each sample are shown as box-whisker plot. (C) Normalized transposon counts (as in B) and readthrough counts (medians) are plotted for each sample (n = 8).
Figure 5—figure supplement 2.
Figure 5—figure supplement 2.. Heatshock and osmotic stress promote expression of gene proximal transposons.
Specific readthrough induction leads to stronger differential expression of gene proximal transposons (A) and stronger upregulation of extragenic transposons (B) as compared with cellular senescence and aging, which are associated with more modest readthrough. Differential expression was performed for KCl treated HEK293 cells vs control (mNETseq; Bauer et al., 2018), 44°C heatshocked NIH-3T3 vs control (RNA-seq; Vilborg et al., 2017), KCl treated HEK293 cells vs control (RNA-seq; Rosa-Mercado et al., 2021), senescent cells and aged fibroblasts (as detailed in Figure 1). The fraction of all genic and gene proximal transposons (distance <25 kb) among differentially regulated transposons is shown in (A); the remaining transposons are intergenic (distance >25 kb). The fraction of all extra-genic transposons among the significantly upregulated transposons is shown in (B).
Figure 6.
Figure 6.. Increased expression of active LINE-1 elements with senescence but not aging.
A scatterplot between the log2-fold change of every transposon (p < 0.05) differentially expressed with age or senescence and the log2-fold change of the nearest gene. The percentage of active LINE-1s among transposons with higher-than-expected expression levels is unchanged in aging (A) and increased during senescence (B). For the tables, we compared the percentage of active LINE-1s among all LINE-1 elements for 250 transposons with higher-than-expected expression levels (in orange; labeled ‘outliers’), all significantly changed transposons (blue plus orange; labeled ‘significant’), and all transposons passing read filtering (not plotted; labeled ‘all expressed’). The p-value is based on the comparison with ‘all expressed’.
Author response image 1.
Author response image 1.. Transposons with inverted strandedness (“reverse”) show lower expression levels (log counts; A) and no differential expression with age (B) when compared to matched differentially expressed transposons (“actual”).
For this analysis we selected all transposons showing significant differential expression with age in the actual dataset that also showed at least minimal expression in the strand-inverted analysis (n=226). Data from Fleischer et al. (2018). (A) The log (counts) are clipped because we only used transposons that passed minimal read filtering in this analysis. (B) The distribution of expression values in the actual dataset is bimodal and positive since some transposons are significantly up- or downregulated. This bimodal distribution is lost in the strand-inverted analysis.
Author response image 2.
Author response image 2.. We analyzed transposons located in introns, genes, downstream (ds) or upstream (us) of genes (distance to gene < 25 kb) or in intergenic regions (distance to gene > 25 kb).
Independent of their location, transposons show similar differential expression with aging or cellular senescence (A). In contrast, the expression of transposons (log counts) is highly dependent on their location and the median log(count) value decreases in the order: genic > intronic > ds > us > intergenic.
Author response image 3.
Author response image 3.. Total counts are the sum of all counts from transposons located in introns, genes, downstream (ds) or upstream (us) of genes (distance to gene < 25 kb) or in intergenic regions (distance to gene > 25 kb).
Counts were defined as cumulative counts across all samples.
Author response image 4.
Author response image 4.. We split the set of introns that significantly change with cellular aging (A) or cell senescence (B) into introns that contain at least one transposon (has_t) and those that do not contain any transposons (has_no_t).
Intron retention is increased in both groups. In this analysis we included all transposons that passed minimal read filtering (n=63782 in A and n=124173 in B). Median log-fold change indicated with a dashed red line for the group of introns without transposons.
Author response image 6.
Author response image 6.. Transposons are evenly distributed within introns except for the region close to splice junctions (A-E).
Transposons appear to be excluded from the splice junction-adjacent region both in all introns (A, D) and in significantly retained introns (B, E). In addition, transposon density of all introns and significantly retained introns is comparable (C, F). We included only introns containing at least one transposon in this analysis. (A) Distribution of 2292769 transposons within 163498 introns among all annotated transposons. (B) Distribution of 195190 transposons within 14100 introns significantly retained with age. (C) Density (transposon/1kb of intron) of transposons in all introns (n=163498) compared to significantly retained introns (n=14100). (D) as in (A) (E) Distribution of 428130 transposons within 13205 introns significantly retained with induced senescence. (F) Density (transposon/1kb of intron) of transposons in all introns (n=163498) compared to significantly retained introns (n=13205).
Author response image 7.
Author response image 7.. Readthrough was determined in a region 0 to 10 kb downstream of genes for a subset of genes that were at least 10 kb away from the nearest neighboring gene (n=684 regions).
The log2 ratio of readthrough to gene expression is plotted across five age groups (adolescent n=32, young n=31, middle-aged n=22, old n=37 and very old n=21). (B) As in (A) but data is plotted on a per sample basis. (C) Readthrough was determined in a region 0 to 10 kb downstream of genes for a subset of genes that were at least 10 kb away from the nearest neighboring gene (n=1045 regions). The log2 ratio of readthrough to gene expression is plotted for the groups comprising senescence (n=12) and the non-senescent group (n=6). (D) As in (D) but data is plotted on a per sample basis and for additional control datasets (serum-starved, immortalized, intermediate passage and early passage). N=3 per group.
Author response image 8.
Author response image 8.. Readthrough counts (rt_counts) decrease exponentially downstream of genes, both in the aging dataset (A) and in the cellular senescence dataset (B).
Although noisier, the pattern for transposon counts (transp_cum_counts) is similar with higher counts closer to gene terminals, both in the aging dataset (C) and in the cellular senescence dataset (D). Readthrough counts are the cumulative counts across all genes and samples. Readthrough was determined in 10 kb bins and the values are assigned to the midpoint of the bin for easier plotting. Transposon counts are the cumulative counts across all samples for each transposon that did not overlap a neighboring gene. n=801 in (C) and n=3479 in (D).
Author response image 9.
Author response image 9.. Transposons found downstream of genes with high readthrough (hi_RT) show a more pronounced log-fold change (transp_logfc) than transposons downstream of genes with low readthrough (low_RT).
This is true in fibroblasts isolated from aged donors (A) and with cellular senescence (B). Furthermore, the difference between high and low readthrough region transposons is diminished for transposons that are more than 10 kb downstream of genes (“Transp > 10 kb”). Transposons in high readthrough regions were defined as those in the top 20% of readthrough log-fold change. Readthrough was measured between 0 and 10 kb downstream from genes. n=2124 transposons in (A) and n=6061 transposons in (B) included in the analysis.
Author response image 10.
Author response image 10.. A schematic model of transposon expression.
In our model, represented in this schematic, transcription (A) can give rise to mRNAs and pre-mRNAs that contain retained introns when co-transcriptional splicing is impaired. This is often seen during aging and senescence, and these can contain transposon sequences (B). In addition, transcription can give rise to mRNAs and pre-mRNAs that contain transposon sequences towards the 3’-end of the mRNA when co-transcriptional termination at the polyadenylation signal (PAS) is impaired (C, D) as seen with aging and senescence. Some of these RNAs may be successfully polyadenylated (as depicted here) whereas others will be subject to nonsense mediated decay. Image created with Biorender.
Author response image 11.
Author response image 11.. Intron, readthrough and transposon elements are elevated in the liver of aging mice (26 vs 5-month-old, n=6 per group).
Readthrough and transposon expression is especially elevated even when compered to genic transcripts. The percentage of upregulated transcripts is indicated above each violin plot and the median log10-fold change for genic transcripts is indicated with a dashed red line.
Author response image 12.
Author response image 13.

Update of

References

    1. Adusumalli S, Ngian ZK, Lin WQ, Benoukraf T, Ong CT. Increased intron retention is a post-transcriptional signature associated with progressive aging and Alzheimer’s disease. Aging Cell. 2019;18:e12928. doi: 10.1111/acel.12928. - DOI - PMC - PubMed
    1. Agostini F, Zagalak J, Attig J, Ule J, Luscombe NM. Intergenic RNA mainly derives from nascent transcripts of known genes. Genome Biology. 2021;22:136. doi: 10.1186/s13059-021-02350-x. - DOI - PMC - PubMed
    1. Bauer DLV, Tellier M, Martínez-Alonso M, Nojima T, Proudfoot NJ, Murphy S, Fodor E. Influenza virus mounts a two-pronged attack on host RNA polymerase II transcription. Cell Reports. 2018;23:2119–2129. doi: 10.1016/j.celrep.2018.04.047. - DOI - PMC - PubMed
    1. Chen S, Zhou Y, Chen Y, Gu J. fastp: an ultra-fast all-in-one FASTQ preprocessor. Bioinformatics. 2018;34:i884–i890. doi: 10.1093/bioinformatics/bty560. - DOI - PMC - PubMed
    1. Colombo AR, Elias HK, Ramsingh G. Senescence induction universally activates transposable element expression. Cell Cycle. 2018;17:1846–1857. doi: 10.1080/15384101.2018.1502576. - DOI - PMC - PubMed

Substances

Associated data