. 2024 May 2;12(5):e0378823.
doi: 10.1128/spectrum.03788-23. Epub 2024 Apr 3.

Arsenic trioxide impacts hepatitis B virus core nuclear localization and efficiently interferes with HBV infection

Affiliations

Arsenic trioxide impacts hepatitis B virus core nuclear localization and efficiently interferes with HBV infection

Samuel Hofmann et al. Microbiol Spectr. .

Abstract

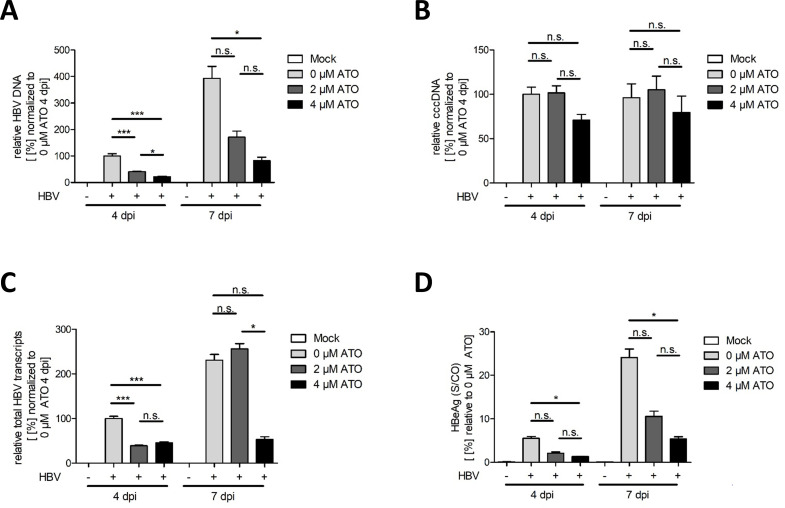
The key to a curative treatment of hepatitis B virus (HBV) infection is the eradication of the intranuclear episomal covalently closed circular DNA (cccDNA), the stable persistence reservoir of HBV. Currently, established therapies can only limit HBV replication but fail to tackle the cccDNA. Thus, novel therapeutic approaches toward curative treatment are urgently needed. Recent publications indicated a strong association between the HBV core protein SUMOylation and the association with promyelocytic leukemia nuclear bodies (PML-NBs) on relaxed circular DNA to cccDNA conversion. We propose that interference with the cellular SUMOylation system and PML-NB integrity using arsenic trioxide provides a useful tool in the treatment of HBV infection. Our study showed a significant reduction in HBV-infected cells, core protein levels, HBV mRNA, and total DNA. Additionally, a reduction, albeit to a limited extent, of HBV cccDNA could be observed. Furthermore, this interference was also applied for the treatment of an established HBV infection, characterized by a stably present nuclear pool of cccDNA. Arsenic trioxide (ATO) treatment not only changed the amount of expressed HBV core protein but also induced a distinct relocalization to an extranuclear phenotype during infection. Moreover, ATO treatment resulted in the redistribution of transfected HBV core protein away from PML-NBs, a phenotype similar to that previously observed with SUMOylation-deficient HBV core. Taken together, these findings revealed the inhibition of HBV replication by ATO treatment during several steps of the viral replication cycle, including viral entry into the nucleus as well as cccDNA formation and maintenance. We propose ATO as a novel prospective treatment option for further pre-clinical and clinical studies against HBV infection.

Importance: The main challenge for the achievement of a functional cure for hepatitis B virus (HBV) is the covalently closed circular DNA (cccDNA), the highly stable persistence reservoir of HBV, which is maintained by further rounds of infection with newly generated progeny viruses or by intracellular recycling of mature nucleocapsids. Eradication of the cccDNA is considered to be the holy grail for HBV curative treatment; however, current therapeutic approaches fail to directly tackle this HBV persistence reservoir. The molecular effect of arsenic trioxide (ATO) on HBV infection, protein expression, and cccDNA formation and maintenance, however, has not been characterized and understood until now. In this study, we reveal ATO treatment as a novel and innovative therapeutic approach against HBV infections, repressing viral gene expression and replication as well as the stable cccDNA pool at low micromolar concentrations by affecting the cellular function of promyelocytic leukemia nuclear bodies.

Keywords: HBV; PML-NB; SUMO; antivirals; arsenic; cccDNA; dsDNA viruses; hepatitis B virus.


Conflict of interest statement

U.P. is a co-founder and shareholder of SCG Cell Therapy and received personal fees as a speaker or an ad hoc scientific advisor from AbbVie, Aligos, Arbutus, Biontech, Gilead, GSK, Leukocare, J&J, Roche, Sanofi, Sobi, Vaccitech, and VIR Biotechnology. The other authors declare no competing interests.

Figures

Fig 1
Fig 1
Reduction of HBV infectivity by ATO treatment. HepG2-NTCP-K7 cells were infected with HBV (MOI 200), treated with the indicated concentrations of ATO at 20 hpi, and analyzed at 4 and 7 dpi. (A) Schematic representation of the experimental setup. (B) Cell viability of HBV-infected and ATO-treated cells was assessed using the Promega CellTiter-Blue Cell Viability Assay system prior to fixation with 4% paraformaldehyde and staining with mAb sc-23945 (core). HBV core fluorescence intensity was measured using a Tecan Infinite 200M plate reader at an excitation and emission wavelength of 488 nm. Fluorescence intensity values were normalized to untreated, infected cells. IC50 values were determined by a logarithmic data representation and a fitted logarithmic function represented by a red line in the right panels. Data correspond to six biological replicates. (C) Cells were fixed, stained (rbAb 216A-14-ASR, core), and HBc flow cytometry analysis was performed. Percentage of HBc-positive cells was quantified by FlowJo relative to untreated, infected cells. (D) Mean fluorescence intensity of HBc-positive cells was calculated relative to untreated, HBV-infected cells. (E) Cells were harvested, protein lysates were prepared, separated by SDS-PAGE, and subjected to immunoblotting using mAb 8C9-11 (core), pAb NB100-59787 (PML), and mAb AC-15 (β-actin). Molecular weights are depicted in kDa on the left, and proteins are depicted on the right-hand side, respectively. (F) Protein expression was quantified by densitometric analysis of the detected bands using ImageJ (version 1.45s). Relative protein expression was normalized to β-actin levels. Bar charts represent average values and standard deviations based on three independent experiments. Statistical significance was determined using one-way ANOVA. *P ≤ 0.05, **P ≤ 0.01, ***P ≤ 0.001, and ****P ≤ 0.0001.
Fig 2
Fig 2
ATO treatment induces diminution of HBV replication and expression. HepG2-NTCP-K7 cells were infected with HBV (MOI 200) and treated with the depicted concentration of ATO at 20 hpi. Cells were subjected to analysis at 4 and 7 dpi. (A) Total DNA was isolated and subjected to RT-PCR using primers specific for the total intracellular HBV DNA relative to PRP as an internal control. Values were normalized to untreated, infected cells at 4 dpi. (B) Quantification of intracellular cccDNA was performed by RT-PCR analysis utilizing specific HBV cccDNA primers relative to PRP as an internal control and normalized to untreated, infected cells at 4 dpi. (C) Total HBV transcript quantification was performed after mRNA extraction by RT-PCR using specific primers. Data were quantified relative to the respective PRP levels and normalized to untreated, infected cells at 4 dpi. (D) HBeAg in cell culture supernatant was measured and normalized to untreated, infected cells. Bar charts represent average values and standard deviations based on six biological replicates. Statistically significant differences were determined using one-way ANOVA. *P ≤ 0.05, **P ≤ 0.01, ***P ≤ 0.001, and ****P ≤ 0.0001.
Fig 3
Fig 3
Intracellular HBV core protein localization efficiently vanished during ATO treatment. Differentiated HepG2-NTCP-K7 cells were infected with HBV (MOI 200) and treated with the depicted amount of ATO at 20 hpi. Cells were fixed at 4 and 7 dpi with 4% paraformaldehyde and stained with mAb sc-23945 (core) and pAb NB100-59787 (PML). Primary antibodies were detected by conjugated secondary antibodies Alexa488 (PML, green) and Alexa647 (core, red). (A) Representative pictures are shown for cells fixed at 4 dpi. (B) Representative pictures are shown for cells fixed at 7 dpi. Scale bar represents 7 µm. (C) Nuclear localization of the HBV core was determined using Pearson correlation analysis of the HBV core and DAPI as a nuclear marker. Statistical significance was determined using one-way ANOVA. *P ≤ 0.05, **P ≤ 0.01, ***P ≤ 0.001, and ****P ≤ 0.0001. Data correspond to at least 17 cells.
Fig 4
Fig 4
ATO treatment efficiently diminishes established HBV infection. Differentiated HepG2-NTCP-K7 cells were infected with HBV (MOI 200) and treated at 4 dpi with the indicated amount of ATO. Samples were harvested and analyzed at 3 and 6 dpt. (A) Schematic representation of the experimental setup. (B) Cells were harvested, whole-cell lysates were prepared, separated by SDS-PAGE, and subjected to immunoblotting using mAb 8C9-11 (core), pAb NB100-59787 (PML), and mAb AC-15 (β-actin). Molecular weights in kDa are depicted on the left and respective proteins on the right of each blot. (C) Protein expression of the detected bands was quantified by densitometric analysis utilizing ImageJ (Version 1.45 s). Relative protein expression was normalized to the respective β-actin steady-state level. Bar charts represent average values and standard deviations based on three independent experiments. (D) Cells were subjected to RT-PCR analysis at 3 and 6 dpt using primers for the total intracellular HBV DNA relative to PRP as an internal control, normalized to untreated, infected cells at 3 dpt. (E) Quantification of intracellular cccDNA by RT-PCR analysis was performed respectively to panel A, utilizing specific HBV cccDNA primers. (F) HBV total transcript quantification was performed after mRNA extraction by RT-PCR using primers specific for total HBV transcripts. Data were normalized to the respective PRP levels relative to 4 dpi with 0 µM ATO treatment. (G) Secreted HBeAg quantity in cell culture supernatant was determined by performing an ELISA assay. Results depicted in bar charts represent average values and standard deviations based on six biological replicates. Statistically significant differences were determined using one-way ANOVA. *P ≤ 0.05, **P ≤ 0.01, ***P ≤ 0.001, and ****P ≤ 0.0001.
Fig 5
Fig 5
HBV core is substantially relocalized by ATO administration during established HBV infection. Differentiated HepG2-NTCP-K7 cells were infected with HBV (MOI 200) and treated with the depicted amount of ATO at 4 dpi. Cells were fixed at 3 and 6 dpt with 4% paraformaldehyde and stained with mAb sc-23945 (core) and pAb NB100-59787 (PML). Primary antibodies were detected by conjugated secondary antibodies Alexa488 (PML, green) and Alexa647 (core, red). (A) Representative immunofluorescence images are shown for cells fixed at 3 dpt. (B) Representative pictures are shown for cells fixed at 6 dpt. Scale bar represents 7 µm. (C) Nuclear localization of HBV core was determined using Pearson correlation analysis of HBV core and DAPI as a nuclear marker. Statistical significance was determined using one-way ANOVA. *P ≤ 0.05, **P ≤ 0.01, ***P ≤ 0.001, and ****P ≤ 0.0001. Data correspond to at least 100 cells.
Fig 6
Fig 6
Cessation of ATO treatment induces HBV infection relapse. Differentiated HepG2-NTCP-K7 cells were infected with HBV (MOI 200) and treated with 0 or 4 µM of ATO at 20 hpi. After 7 dpi, the cells were removed from ATO treatment, and the cells were further incubated in a medium without ATO for a further 7 days. Cells were subjected to analysis at 7, 11 (4 days post-ATO cessation), and 14 dpi (7 days post-ATO cessation). (A) Schematic representation of the experimental setup. (B) Cells were harvested, whole-cell lysates were prepared, separated by SDS-PAGE, and subjected to immunoblotting using mAb 8C9-11 (core), pAb NB100-59787 (PML), and mAb AC-15 (β-actin). Molecular weights in kDa are depicted on the left and respective proteins on the right of each blot. (C) Protein expression of the detected bands was quantified by densitometric analysis utilizing ImageJ (Version 1.45 s). Relative protein expression was normalized to the respective β-actin steady-state level. Bar charts represent average values and standard deviations based on two independent experiments. (D) Cells were subjected to RT-PCR analysis at 7, 11, and 14 dpi using primers for the total intracellular HBV DNA relative to PRP as an internal control, normalized to untreated, infected cells at 7 dpi. (E) Secreted HBeAg quantity in cell culture supernatant was determined by performing an ELISA assay. Results depicted in bar charts represent average values and standard deviations based on six biological replicates. Statistically significant differences were determined using one-way ANOVA. *P ≤ 0.05, **P ≤ 0.01, ***P ≤ 0.001, and ****P ≤ 0.0001.
Fig 7
Fig 7
ATO treatment relocalizes transfected HBV core away from PML-NBs. HepaRG His/HA cells were transfected with HBV core-HA and treated with 2 µM ATO at 3 hpt for 48 h. (A) HepaRG His/HA cells were fixed with 4% paraformaldehyde and stained with mAb 3F10 (HA) and pAb NB100-59787 (PML). Primary antibodies were detected by conjugated secondary antibodies Alexa488 (PML, green) and Alexa647 (HA, red). Representative pictures as well as Z-stack images are shown. Scale bar represents 7 µm. (B) Number of PML-NB per cell in HepaRG His/HA cells with and without ATO treatment. (C) Number of PML-NBs in core-HA-transfected HepaRG His/HA cells with and without ATO administration. (D) Colocalization of core-HA protein with endogenous PML staining in HepaRG His/HA cells with and without ATO administration was quantified using the Pearson colocalization coefficient via Volocity software.
Fig 8
Fig 8
Schematic representation of the proposed mechanism of action of ATO during HBV infection. Our data revealed the reduction of the HBV parameters including the HBV core protein by ATO administration. We presume that the recruitment and/or localization of core to PML-NBs is interrupted during ATO application, resulting in antiviral intervention during novel as well as established HBV infections.

References

    1. Nassal M. 2015. HBV cccDNA: viral persistence reservoir and key obstacle for a cure of chronic hepatitis B. Gut 64:1972–1984. doi:10.1136/gutjnl-2015-309809 - DOI - PubMed
    1. Liang TJ. 2009. Hepatitis B: the virus and disease. Hepatology 49:S13–21. doi:10.1002/hep.22881 - DOI - PMC - PubMed
    1. Datta S, Chatterjee S, Veer V, Chakravarty R. 2012. Molecular biology of the hepatitis B virus for clinician. J Clin Exp Hepatol 2:353–365. doi:10.1016/j.jceh.2012.10.003 - DOI - PMC - PubMed
    1. Kay A, Zoulim F. 2007. Hepatitis B virus genetic variability and evolution. Virus Res 127:164–176. doi:10.1016/j.virusres.2007.02.021 - DOI - PubMed
    1. Kidd-Ljunggren K, Miyakawa Y, Kidd AH. 2002. Genetic variability in hepatitis B viruses. J Gen Virol 83:1267–1280. doi:10.1099/0022-1317-83-6-1267 - DOI - PubMed

Publication types

MeSH terms