. 2024 Apr 17;146(15):10537-10549.
doi: 10.1021/jacs.3c14703. Epub 2024 Apr 3.

Structure-Toxicity Relationship in Intermediate Fibrils from α-Synuclein Condensates

Affiliations

Structure-Toxicity Relationship in Intermediate Fibrils from α-Synuclein Condensates

Serene W Chen et al. J Am Chem Soc. .

Abstract

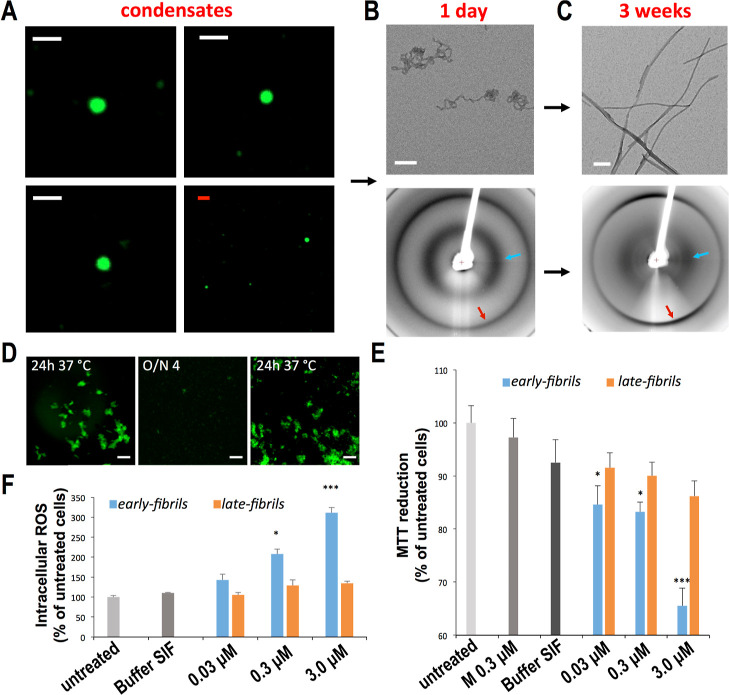
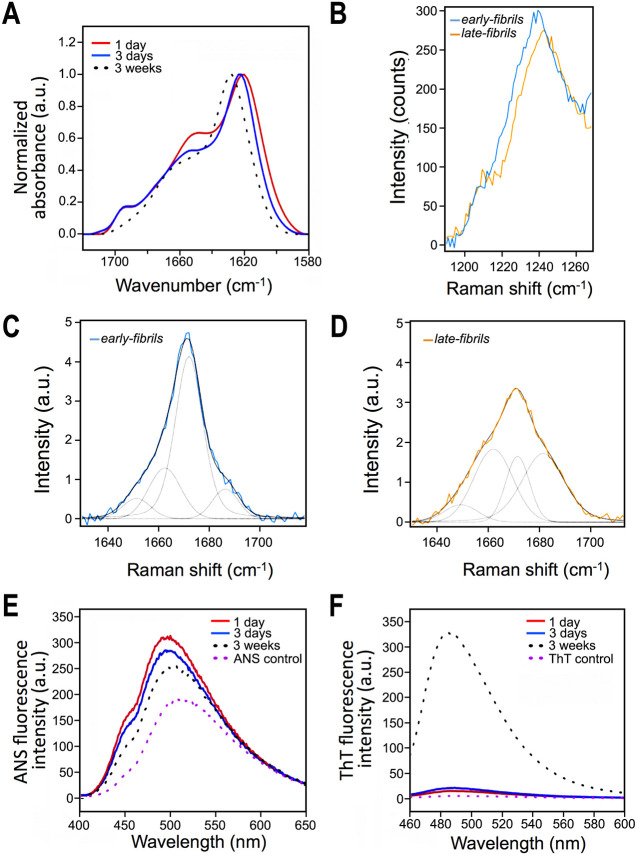
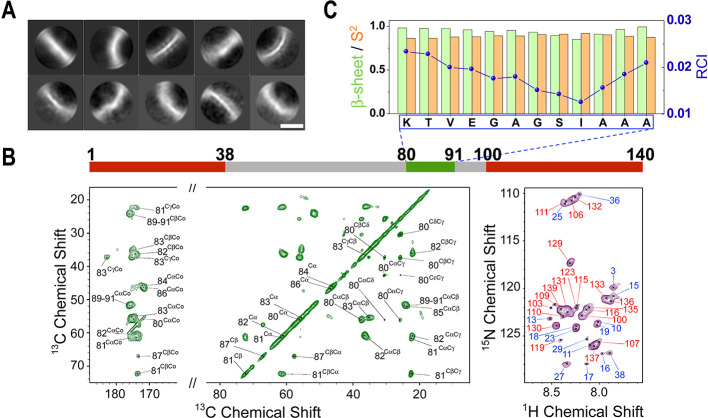
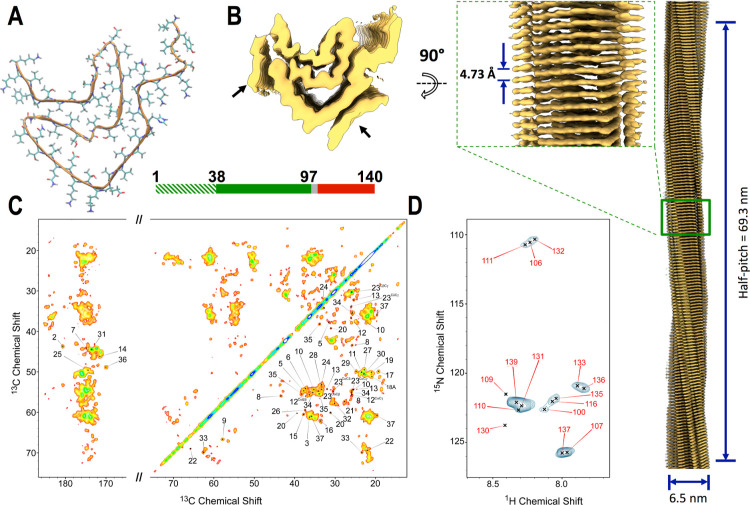
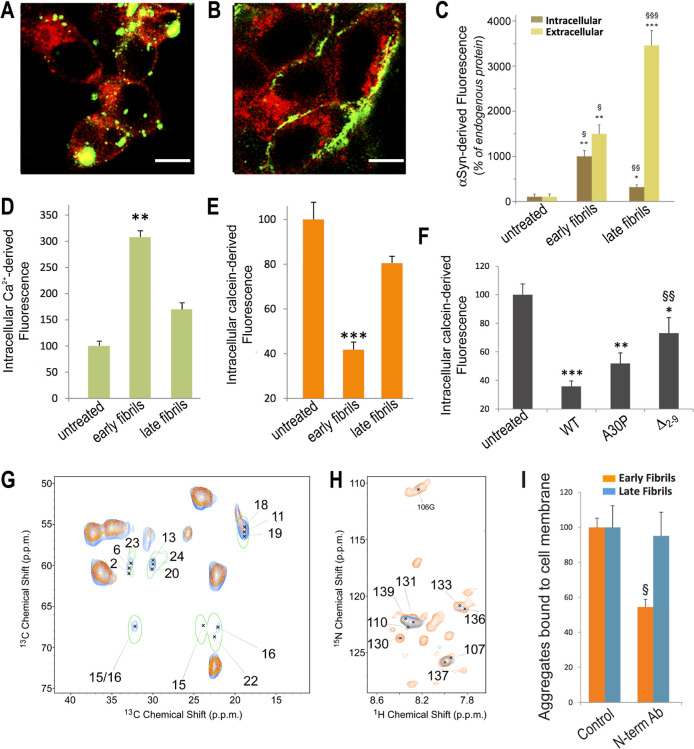
The aberrant aggregation of α-synuclein (αS) into amyloid fibrils is associated with a range of highly debilitating neurodegenerative conditions, including Parkinson's disease. Although the structural properties of mature amyloids of αS are currently understood, the nature of transient protofilaments and fibrils that appear during αS aggregation remains elusive. Using solid-state nuclear magnetic resonance (ssNMR), cryogenic electron microscopy (cryo-EM), and biophysical methods, we here characterized intermediate amyloid fibrils of αS forming during the aggregation from liquid-like spherical condensates to mature amyloids adopting the structure of pathologically observed aggregates. These transient amyloid intermediates, which induce significant levels of cytotoxicity when incubated with neuronal cells, were found to be stabilized by a small core in an antiparallel β-sheet conformation, with a disordered N-terminal region of the protein remaining available to mediate membrane binding. In contrast, mature amyloids that subsequently appear during the aggregation showed different structural and biological properties, including low levels of cytotoxicity, a rearranged structured core embedding also the N-terminal region, and a reduced propensity to interact with the membrane. The characterization of these two fibrillar forms of αS, and the use of antibodies and designed mutants, enabled us to clarify the role of critical structural elements endowing intermediate amyloid species with the ability to interact with membranes and induce cytotoxicity.


Conflict of interest statement

The authors declare no competing financial interest.

Figures

Figure 1
Figure 1
Properties of early-fibrils and late-fibrils from αS condensates. (A) Confocal images of spherical condensates of αS that readily form at 37 °C (see Experimental Section). The droplets show a round shape (see also Figure S1) and liquid-like properties in FRAP analyses (Figure S2). Samples included 1% of AF488-αSN122C to fluorescently label the condensates. Scale bars are 1 μm (white) and 5 μm (red). (B) After 1 day of incubation, TEM images (top, scale bar 1 μm) showed the presence of curly early-fibrils that possess the typical X-ray diffraction pattern of amyloid fibrils (down), with reflections at 4.8 Å (red arrow) and 10 Å (cyan arrow). The diffraction patterns of the early-fibrils are typical of unoriented fibrillar samples, likely owing to the curly nature of these amyloids. (C) After 3 weeks of incubation, TEM images (top, scale bar 1 μm) detected straight late-fibrils, with a conserved amyloid pattern of X-ray diffraction (down). (D) early-fibrils imaged at the confocal microscope (scale bar 20 μm) after 1 day of incubation at 37 °C. The aggregates disassemble after overnight incubation at 4 °C and can be observed again after 1 day of incubation at 37 °C. The sample included 2% of AF488-αSN122C to fluorescently label the aggregates. (E) Cell dysfunction monitored by the reduction of MTT in human neuroblastoma SH-SY5Y cells upon incubation with increasing concentrations (0.03, 0.3, and 3 μM, monomer equivalents) of early-fibrils and late-fibrils from αS spherical condensates formed after 1 day and 3 weeks, respectively. * and *** indicate P values <0.05 and <0.001 with respect to untreated cells. Cells exposed to monomeric αS (M) and buffer of the early-fibrils (buffer SIF) were also shown. (F) Cell dysfunction monitored by intracellular ROS production in human neuroblastoma cells [details as in panel (E)]. Error bars in panels E and F are S.E.M.
Figure 2
Figure 2
Secondary structure, hydrophobicity, and ThT binding of the early-fibrils and late-fibrils from αS condensates. (A) FT-IR spectra of αS upon incubation at the present experimental conditions at 37 °C. Early-fibrils after 1 and 3 days of incubation are shown in red and blue, respectively, whereas late-fibrils are shown in black-dotted line. The spectrum of the early-fibrils showed a band for antiparallel β-sheet structure at ca. 1685–1700 cm–1, which is missing in the late-fibrils. (B) Raman spectra of the amide III band of early-fibrils (1 day of incubation, blue) and late-fibrils (3 weeks of incubation, orange). (C,D) Raman spectra of the amide I band region of the early-fibrils (C) and late-fibrils (D). Exemplary curve fitting (multipeakfit) of Raman spectra over the amide I region. Four fitting Lorentzian curves were employed for the convolution and assigned to α-helix (1650 cm–1), parallel β-sheet (1662 cm–1), antiparallel β-sheet (1672 cm–1), and random coil (1685 cm–1) structures. In the case of the early-fibrils, the spectrum is dominated by the Lorentzian component at 1672 cm–1 (antiparallel β-sheet). In the case of the late-fibrils we observed a significant component in the Raman bands at 1662 cm–1 (parallel β-sheet) and 1685 cm–1 (random coil). The increased random coil component is attributed to the transfer of the late-fibrils from the incubation buffer into PBS to perform Raman measurements, which promoted the disassembly of the residual early-fibrils, thereby resulting in an increase of disordered monomers in the sample. (E) ANS binding assay spectra of early-fibrils and late-fibrils show a progressive reduction in fluorescence, which indicates a shielding of the hydrophobic regions, during the maturation of the aggregates. (F) ThT fluorescence reveals that both fibrils possess an amyloid core; however, the significantly stronger fluorescence of the late-fibrils indicates a larger core for these species compared to the early-fibrils.
Figure 3
Figure 3
Structural topology of toxic early-fibrils from αS condensates. (A) Cryo-EM 2D class averages of the early-fibrils show heterogeneous particles with a variety of different curvatures. Scale bar 5 nm. (B) MAS ssNMR spectra of the early-fibrils. (left) 13C–13C DARR correlation spectra (aliphatic and carbonyl regions) measured using a 20 ms mixing time probed rigid regions in the core of the fibrils. (right) MAS 1H–15N-HSQC spectra probed dynamical regions of the fibrils. MAS spectra were recorded at 5 °C at a MAS rate of 12.5 kHz. The bar on the top reports the protein regions detected in the spectra (green and red for the rigid and flexible regions, respectively). (C) Analysis of the ssNMR chemical shifts provided the β-sheet content (green), order parameters S2 (orange), and random coil index (blue) of the core residues of the early-fibrils. The data indicate that the core is rigid and in a β-sheet conformation.
Figure 4
Figure 4
Structure of non-toxic late-fibrils from αS condensates. (A) Cryo-EM structure of late-fibrils resolved at 3.3 Å (PDB code: 8RI9). The structure, which is composed of one protein molecule in each stack of the fibril, is shown in the direction of the fibril axis. The atomic model, which spans residues 38 to 97, has a similar amyloid topology of αS fibrils studied postmortem from JOS patients (Figure S11). (B) 3D density from the cryo-EM analysis shown from the top (left) and side (right) views (EMD code: 19184). Lower resolution density, indicated with black arrows, was not amenable for model building (Figure S10). The map was resolved with a half pitch of 69.3 nm. The average diameter of the fibrils is 6.3 nm. (C) MAS ssNMR 13C–13C DARR spectra (aliphatic and carbonyl regions) measured using a 20 ms mixing time probed rigid regions in the core of the late-fibrils. The spectra included peaks from the N-terminal region (labeled in the spectra), indicating that these are rigid and structured in the late-fibrils. In order to improve the peak shape, these spectra were measured using αS fibrils obtained by incubating fresh monomers with seeds generated from the late-fibrils by sonication. Unseeded spectra are shown in Figure S15. (D) MAS ssNMR 1H–15N-HSQC spectra probed the dynamical regions of the late-fibrils. MAS ssNMR spectra were recorded at 5 °C at a MAS rate of 12.5 kHz.
Figure 5
Figure 5
Mechanism of membrane interaction and cellular internalization. (A,B) Confocal microscopy images of the median plane of neuroblastoma cells incubated with early-fibrils (A) and late-fibrils (B) of αS (2% of AF488-αSN122C) at 3 μM (monomer equivalents) for 1 h. Scale bar, 10 μm. (C) Internalization of early-fibrils and late-fibrils of αS (2% of AF488-αSN122C) after 1 h of incubation at 3.0 μM (monomer equivalents) with neuroblastoma cells and estimated from confocal microscopy images of the median plane. *, **, and *** indicate p < 0.5, <0.01, and <0.001 versus untreated cells. (D) Intracellular Ca2+ levels (% of untreated cells) in control samples and in cells incubated with early-fibrils and late-fibrils of αS (3 μM of monomer equivalents) for 15 min ** indicates P < 0.01 versus untreated cells. (E) Membrane disruption monitored with the green fluorescent signal arising from the calcein probe loaded in neuroblastoma cells. The bars report the fluorescence values (% of untreated cells) of control samples and cells incubated with early-fibrils and late-fibrils of αS (3 μM of monomer equivalents) for 1 h. *** indicates P < 0.001 versus untreated cells. (F) Membrane disruption monitored with the calcein probe (% of untreated cells) in neuroblastoma cells incubated with early-fibrils of αS variants (WT, A30P, and Δ2–9, 3 μM of monomer equivalents) for 1 h. These mutations did not affect the pathway of aggregation into early-fibrils and late-fibrils (Figure S16). ** and *** indicate p < 0.01 and 0.001 versus untreated cells. §§ indicates p < 0.01 versus cells treated with WT early-fibrils. (G) MAS ssNMR 13C–13C-DARR spectra (spinning rate of 12.5 kHz; mixing time of 20 ms; contact time of 1 ms) of isolated early-fibrils of αS (orange) are overlapped with spectra of the membrane bound early-fibrils (blue). The latter were measured at −19 °C to enhance the signals of membrane-bound regions of the protein.,, The 13C–13C-DARR spectrum of the monomeric membrane-bound αS measured under the same conditions is shown with a single green contour line. (H) MAS ssNMR 1H–15N-HSQC spectrum of the early-fibrils of αS bound to lipid membranes (blue) detects only the C-terminal region of the protein. This is overlapped with the spectrum of isolated early-fibrils (orange). (I) Degree of membrane binding of early-fibrils (orange) and late-fibrils (blue) of αS measured following their incubation with human SH-SY5Y neuroblastoma cells for 1 h at 3.0 μM (monomer equivalents) in the absence or presence of 1:1 mol equiv of the N-terminal antibody. § indicates p < 0.05 versus cells treated with WT early-fibrils. Error bars in panels C, D, E, F, and I are S.E.M.

References

    1. Fusco G.; Chen S. W.; Williamson P. T. F.; Cascella R.; Perni M.; Jarvis J. A.; Cecchi C.; Vendruscolo M.; Chiti F.; Cremades N.; Ying L.; Dobson C. M.; De Simone A. Structural basis of membrane disruption and cellular toxicity by α-synuclein oligomers. Science 2017, 358 (6369), 1440–1443. 10.1126/science.aan6160. - DOI - PubMed
    1. Lashuel H. A.; Overk C. R.; Oueslati A.; Masliah E. The many faces of α-synuclein: from structure and toxicity to therapeutic target. Nat. Rev. Neurosci. 2013, 14 (1), 38–48. 10.1038/nrn3406. - DOI - PMC - PubMed
    1. Spillantini M. G.; Schmidt M. L.; Lee V. M.; Trojanowski J. Q.; Jakes R.; Goedert M. α-Synuclein in Lewy bodies. Nature 1997, 388 (6645), 839–840. 10.1038/42166. - DOI - PubMed
    1. Newberry R. W.; Leong J. T.; Chow E. D.; Kampmann M.; DeGrado W. F. Deep mutational scanning reveals the structural basis for α-synuclein activity. Nat. Chem. Biol. 2020, 16 (6), 653–659. 10.1038/s41589-020-0480-6. - DOI - PMC - PubMed
    1. Luk K. C.; Kehm V.; Carroll J.; Zhang B.; O’Brien P.; Trojanowski J. Q.; Lee V. M. Pathological α-Synuclein Transmission Initiates Parkinson-like Neurodegeneration in Nontransgenic Mice. Science 2012, 338 (6109), 949–953. 10.1126/science.1227157. - DOI - PMC - PubMed

Publication types