. 2024 Apr 23;43(4):114033.
doi: 10.1016/j.celrep.2024.114033. Epub 2024 Apr 2.

The Legionella pneumophila effector DenR hijacks the host NRas proto-oncoprotein to downregulate MAPK signaling

Affiliations

The Legionella pneumophila effector DenR hijacks the host NRas proto-oncoprotein to downregulate MAPK signaling

Stephanie S Lehman et al. Cell Rep. .

Abstract

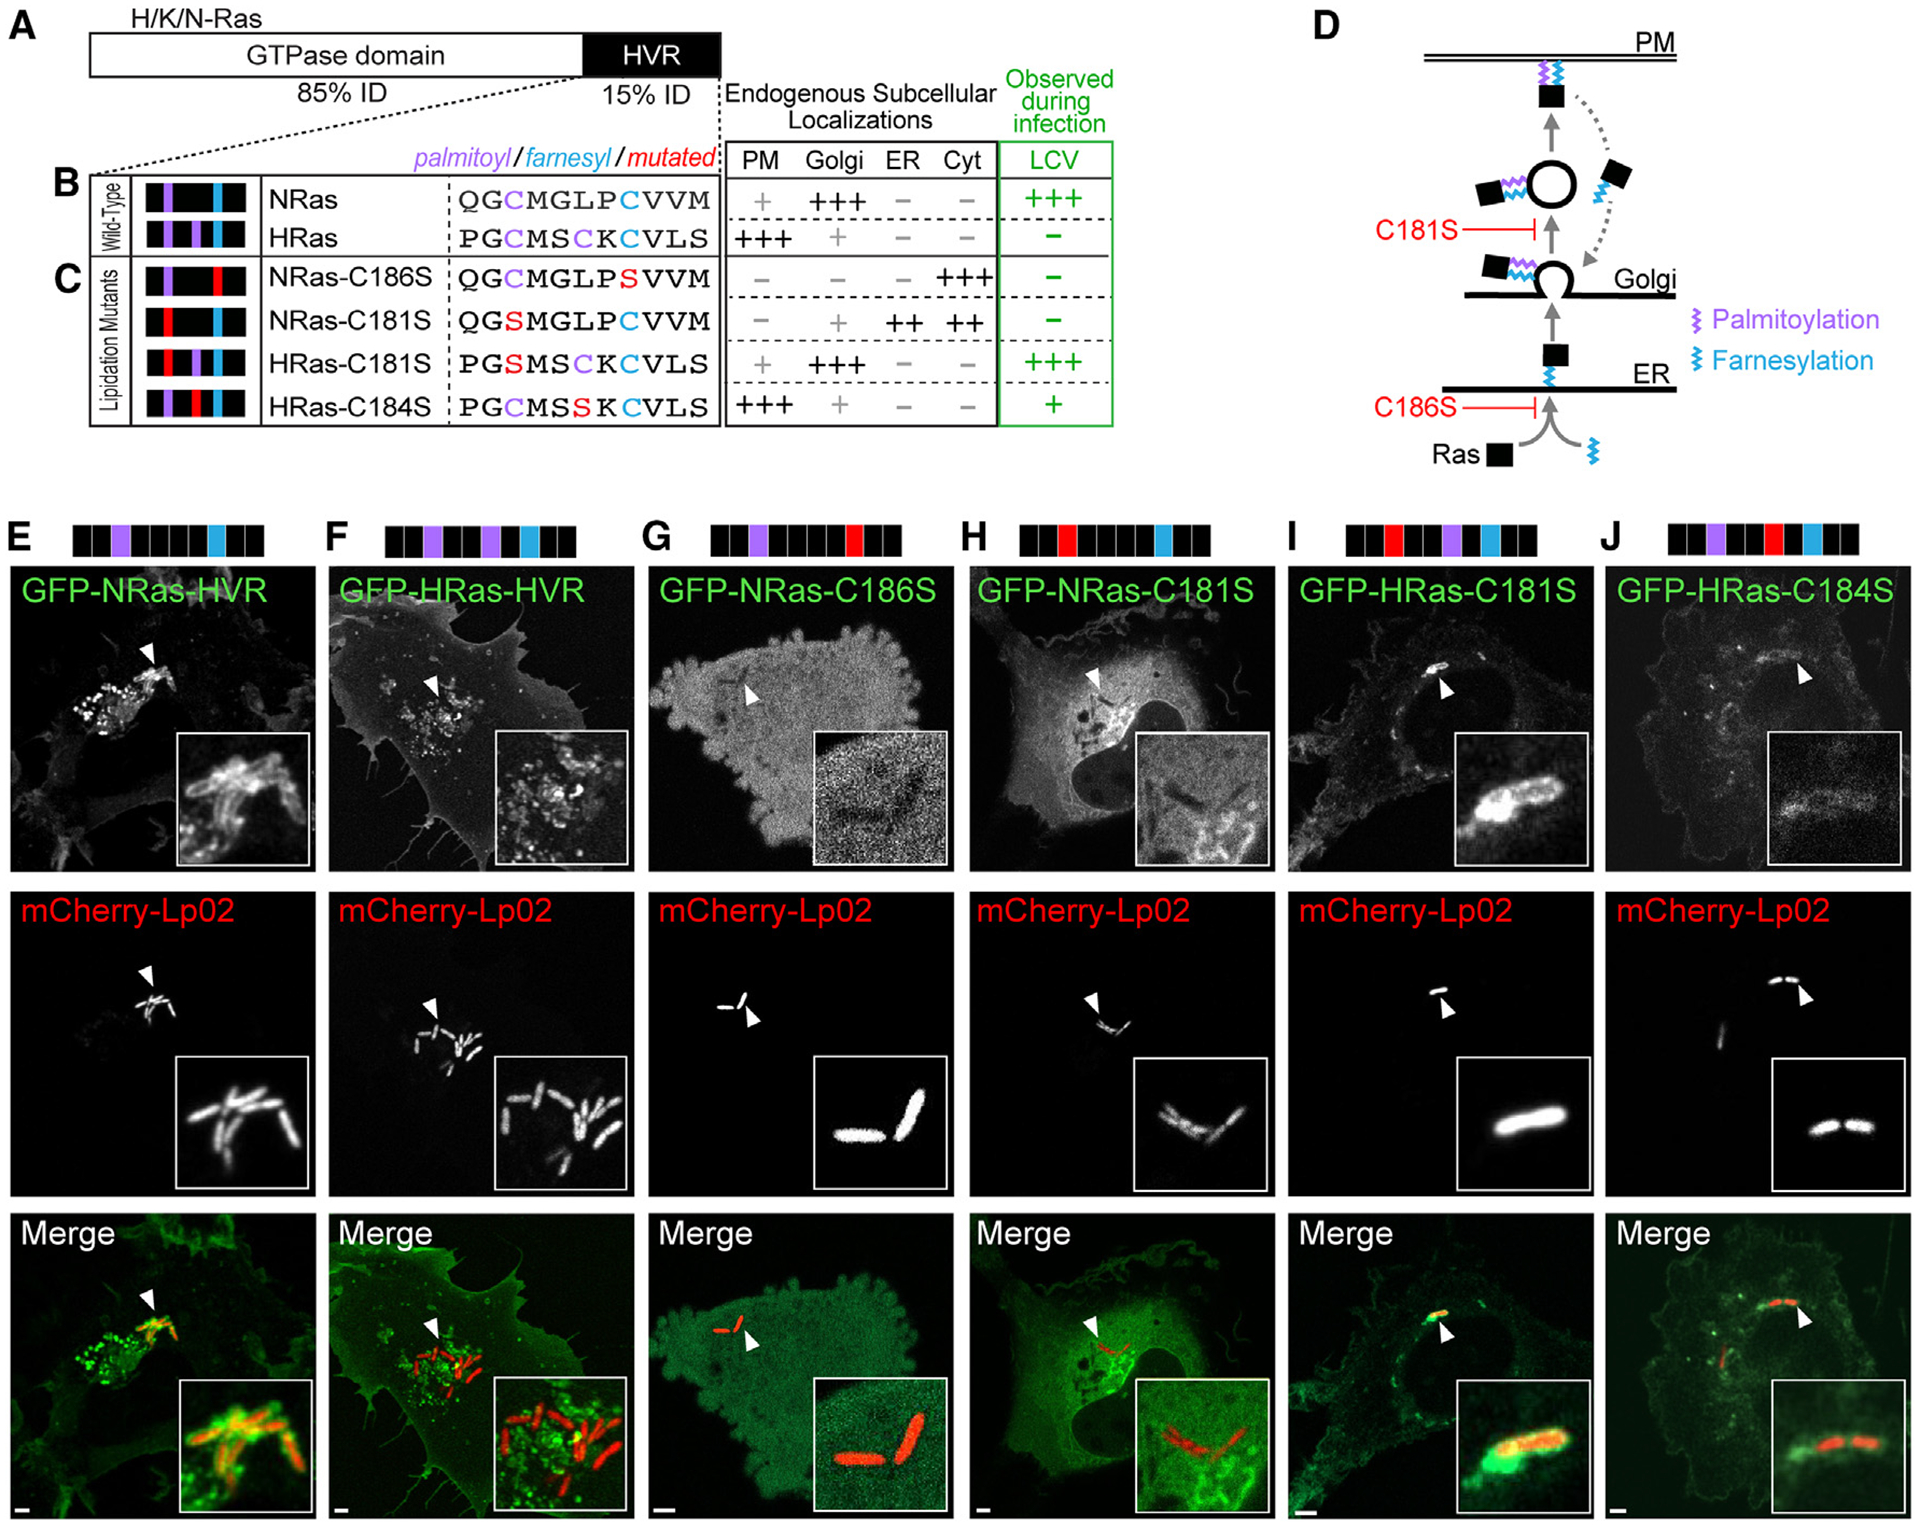
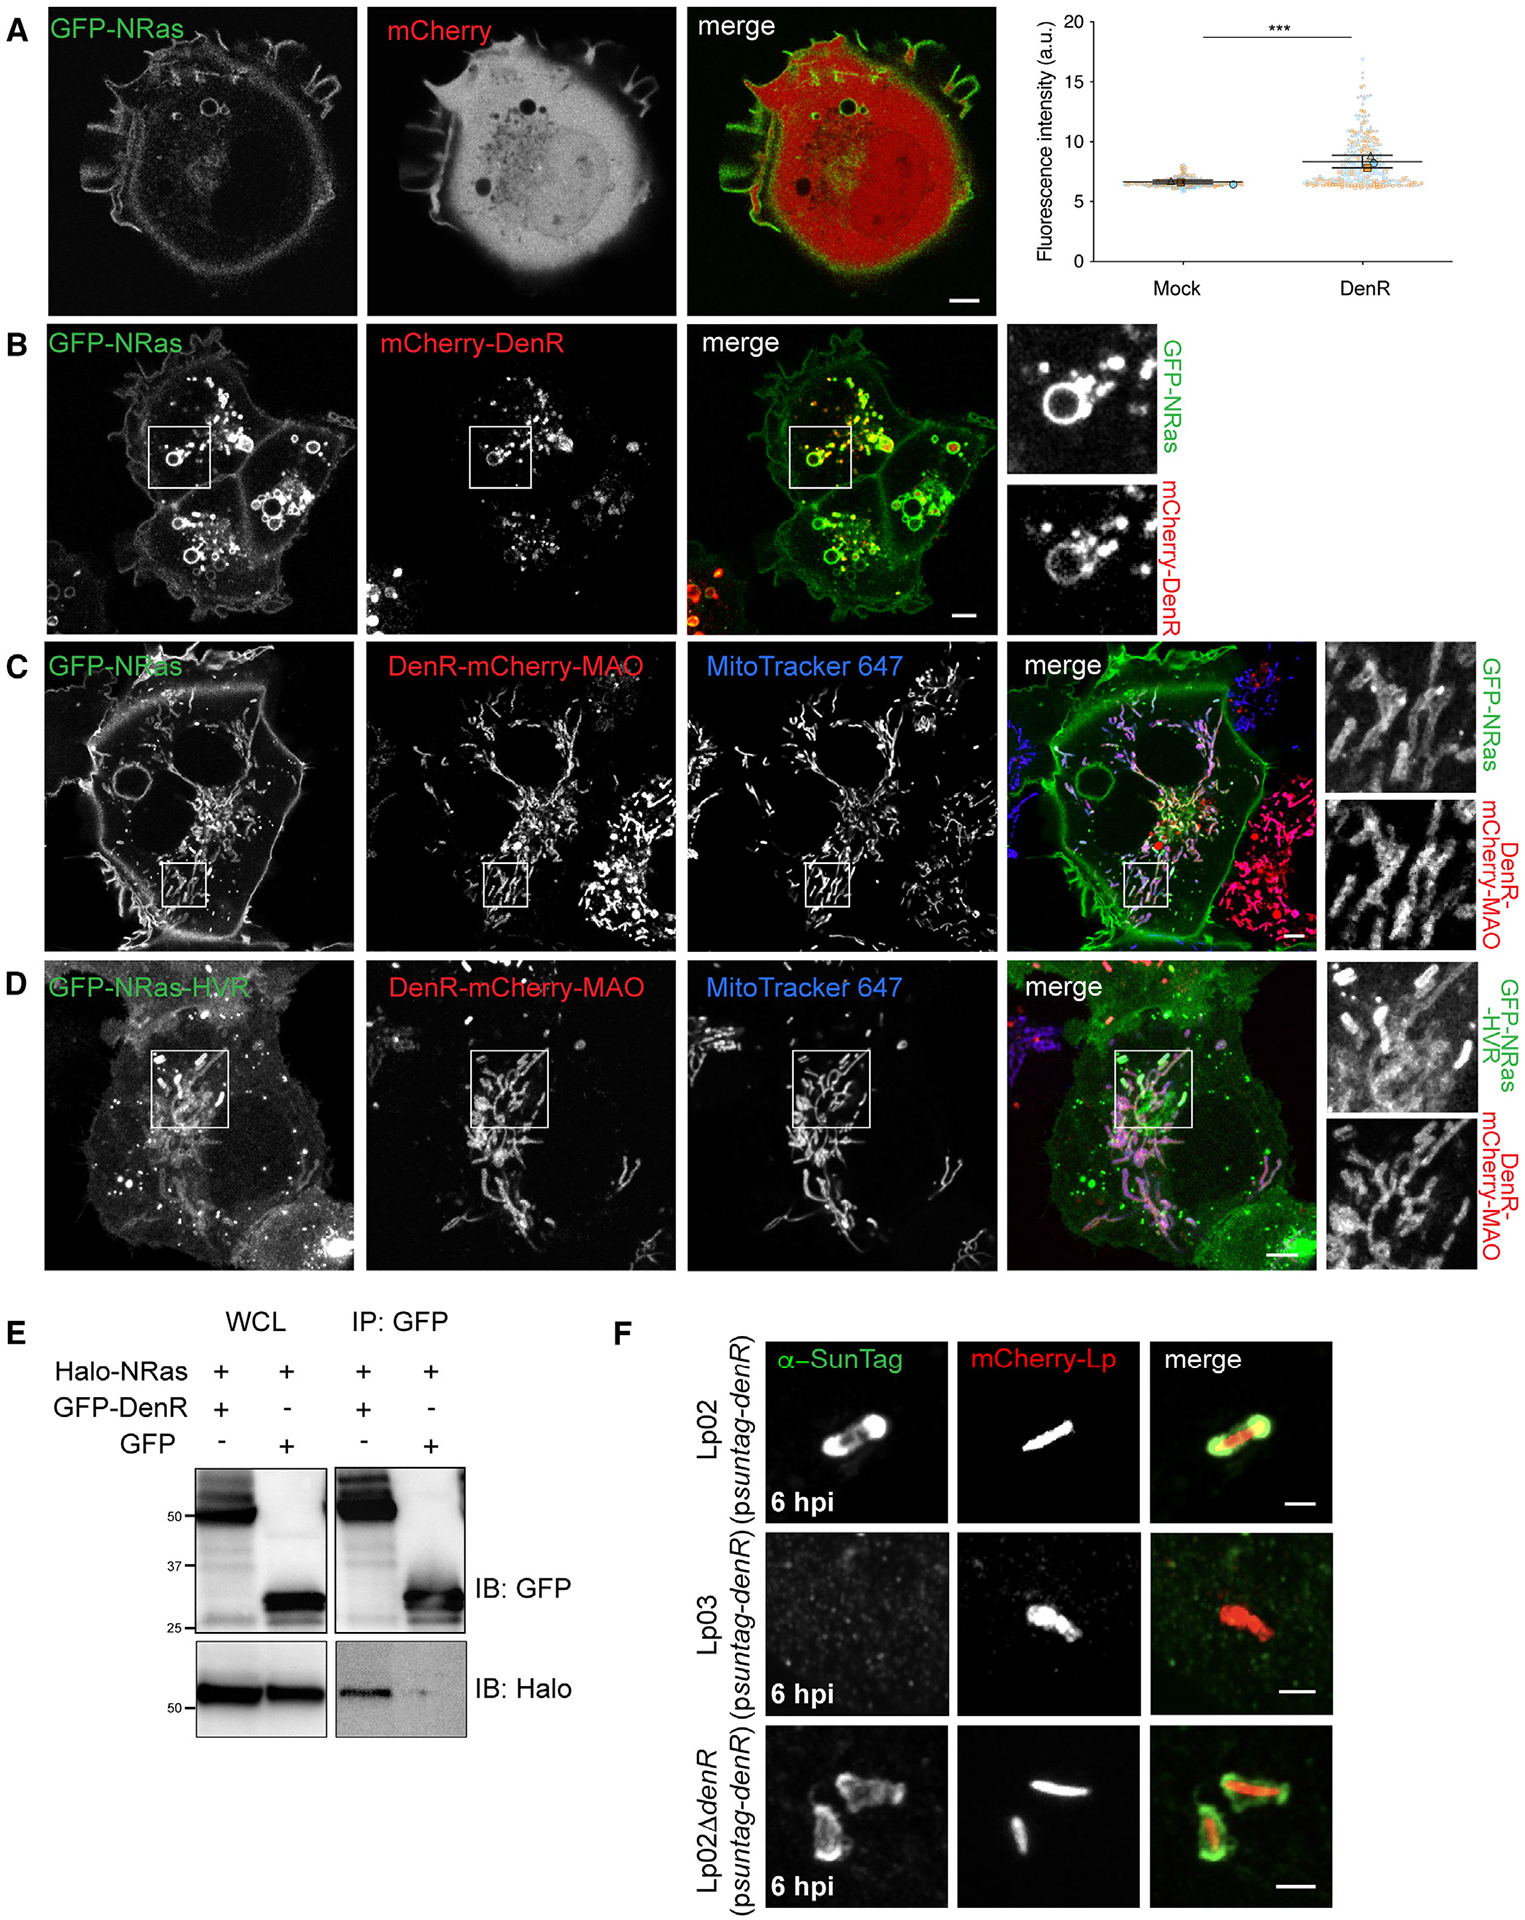
Small GTPases of the Ras subfamily are best known for their role as proto-oncoproteins, while their function during microbial infection has remained elusive. Here, we show that Legionella pneumophila hijacks the small GTPase NRas to the Legionella-containing vacuole (LCV) surface. A CRISPR interference screen identifies a single L. pneumophila effector, DenR (Lpg1909), required for this process. Recruitment is specific for NRas, while its homologs KRas and HRas are excluded from LCVs. The C-terminal hypervariable tail of NRas is sufficient for recruitment, and interference with either NRas farnesylation or S-acylation sites abrogates recruitment. Intriguingly, we detect markers of active NRas signaling on the LCV, suggesting it acts as a signaling platform. Subsequent phosphoproteomics analyses show that DenR rewires the host NRas signaling landscape, including dampening of the canonical mitogen-activated protein kinase pathway. These results provide evidence for L. pneumophila targeting NRas and suggest a link between NRas GTPase signaling and microbial infection.

Keywords: CP: Microbiology; cancer; intracellular pathogen; palmitoylation; type IV secretion system; virulence.


Conflict of interest statement

Declaration of interests The authors declare no competing interests.

Figures

Figure 1.
Figure 1.. LCVs containing virulent L. pneumophila colocalize with NRas
(A) HT1080GFP–NRas cells were challenged with mCherry-Lp02 (red) for 0.5, 2, 6, or 12 h. Graph shows the percent GFP-NRas-positive LCVs determined by confocal microscopy. Data are represented as the mean ± SEM of 3–5 experimental replicates (n = 3–5) with 25–50 LCVs counted per replicate. For Lp03 see Figure S1. (B) Transiently transfected mammalian cell lines ectopically producing GFP-NRas were challenged with mCherry-Lp02 at an MOI of 25 (HT1080) for 6 h, MOI of 50 (HeLa) for 12 h, or MOI of 20 (RAW264.7 or U937 macrophages) for 3 h. (C) HT1080 cells producing GFP-tagged NRas, HRas, KRasA, or KRasB were challenged with mCherry-Lp02 for 6–12 h. Data of GFP-Ras-positive LCVs are represented as the mean ± SEM of 3 experimental replicates (n = 3). Individual replicate points are shown as circles. Scale bars, 2 μm. White arrows denote LCVs magnified in the insets.
Figure 2.
Figure 2.. Lipidation sites are critical for NRas localization to the LCV
(A) Domain organization of NRas. GTPase domain and hypervariable region (HVR) with their degree of sequence identity (ID) to other Ras isoforms are shown. (B and C) The HVR of NRas and HRas contains similar sites for lipidation, including farnesylation (blue) and palmitoylation (purple). Differences in the HVR enable each isoform to localize to unique membranes in cells, as indicated in the table (with plus-marks indicating extent of enrichment). The endogenous subcellular localization is indicated in the table for NRas and HRas wild-type (B) and NRas lipidation mutants (C). Localization of these Ras isoforms/mutants to the LCV is denoted in green. Note that only NRas and monopalmitoylated HRas(C181S) have increased Golgi localization and, hence, are found on LCVs. (D) Graphical illustration of the prototypical Ras acylation cycle. See main text for details. Farnesyl, blue; palmitoyl, purple. (E–J) Representative images of the data summarized in (B and C). HT1080 cells producing the indicated GFP-NRas-HVR or GFP-HRas-HVR variants were challenged with mCherry-Lp02 and imaged 4–8 h post infection. Scale bars, 2 μm. White arrows denote LCVs magnified in the insets.
Figure 3.
Figure 3.. NRas localization dynamics to the LCV are consistent with vesicular delivery
(A) NRas and Sec61B localize to different membranes. HT1080 cells producing GFP-tagged NRas-HVR and mCherry-tagged Sec61B, marking ER membranes, were infected with Lp02 for 10 h and imaged by live confocal microscopy. Regions where both proteins exhibited enrichment around internal membranes are highlighted (white boxes) and enlarged on the right. Graphs show the pixel intensity profile of both fluorophores plotted along a line drawn across the LCV or endosome (white lines, merged panels). Scale bar, 5 μm. (B–I) Correlative light-electron microscopy analysis of LCVs. HT1080GFP–NRas cells were infected with Lp02 for 10 h. (B and F) Cells displaying GFP-positive LCVs (white arrows) were imaged by confocal microscopy. Scale bars, 5 μm. (C and G) Samples were then processed for TEM. Scale bars, 5 μm. (D) Sample regions of the LCV displaying separation of ER and LCV membranes are shown in the top panels (white box in D is shown as enlargement in E). Scale bars, 2 μm. (H and I) Bottom regions and top regions of the LCV wrapped in tubular ER are shown. Scale bars, 0.5 μm. (J) HT1080GFP–NRas cells producing mCherry-Sec61B were challenged with Lp02 for 8–10 h and imaged by live confocal microscopy. LCVs in 28 different cells were photobleached to deplete GFP-NRas and mCherry-Sec61B signals, and fluorescent signal recovery was recorded in 1-s intervals for both channels over 3 min. Micrographs to the left show representative images of the recovery after bleaching for both fluorophores. Scale bar, 2 μm. The graph shows the mean (solid line) ± SD (shaded region around solid line) of signal recovery as a fraction of initial fluorescence for GFP-NRas (green) and mCherry-Sec61B (red) for all cells analyzed (n = 28).
Figure 4.
Figure 4.. NRas accumulation on the LCV is dependent on the T4SS effector DenR
(A) A Lp02Δ5 mutant still recruits NRas. HT1080GFP–NRas cells were challenged for 12 h with Lp02Δ5 producing mCherry. Cells were imaged by confocal microscopy showing NRas in green and bacteria in red. (B) Gene silencing by CRISPRi elucidates candidates of NRas recruitment. HT1080GFP–NRas cells were challenged with Lp02(dcas9) bearing a library of multiplex CRISPR (MC) arrays that silence effector-encoding genes in groups of ten and monitored for their ability to recruit GFP-NRas to LCVs. Cells infected with Lp02(dcas9) containing the MC-8 construct failed to recruit NRas, pink arrow. (C) Screening GFP-NRas recruitment to LCVs was done as in (B) for HT1080GFP–NRas cells challenged with Lp02(dcas9) bearing CRISPR constructs silencing select MC-8 gene subgroups (indicated by colored boxes). Summary of imaging results is displayed in the table. Silencing of lpg1909 appears to render L. pneumophila defective for NRas recruitment (denR). (D) Same experiment as in (C) but with a 1-plex CRISPR array silencing only denR (lgp1909). (E) HT1080GFP-NRas cells were challenged with Lp02ΔdenR containing a plasmid producing mCherry (top panel) or Lp02ΔdenR(pdenR) (complementation plasmid, bottom panel) for the indicated time points post infection. Cells were fixed and stained using anti-Legionella antibody to differentiate internalized and external bacteria. Visual counts of GFP-NRas-positive LCVs (white arrows) at each time point were conducted, and data of mean ± SEM of 3–5 experimental replicates with 25–50 LCV counted per replicate are displayed appended to graph from Figure 1A (n = 3–5). Pink arrows show LCVs that failed to recruit GFP-NRas. (F) DenR is a T4SS-translocated effector. RAW264.7 macrophages were challenged with either Lp02 (functional T4SS) or Lp03 (defective T4SS) harboring plasmids encoding either βLac-RalF (control) or βLac-DenR. At 1 hpi, CCF4/AM was added to the cells, and fluorescence emission light was detected by plate reader. A shift in emission light from green (530 nm) to blue (452 nm) due to CCF4/AM cleavage indicates successful delivery of the β-Lac-effector fusion into host cells. The 452/530 nm ratio measured from each condition is displayed (black dots) for three independent experiments. Bar graph shows mean ± SD (n = 3). Scale bars, 2 μm. White arrows denote LCVs.
Figure 5.
Figure 5.. DenR recruits NRas to intracellular membranes
(A and B) DenR redirects NRas to endomembranes. mCherry (control) (A) or mCherry-DenR (B) were produced in HT1080GFP–NRas cells, and the distribution of NRas (green) and DenR (red) was examined. Boxes highlight areas enlarged in insets displayed on the far right. Superplot shows quantification of GFP-NRas on internal membranes in cells producing DenR compared with mock transfected cells (289 random cells per condition, triplicate experiments are color coded and larger symbols denote averages). Error bars display mean ± SD for the three experiments. ***p = 0.0058, n = 3. (C and D) DenR is sufficient to recruit NRas. DenR-mCherry-MAO was produced in HT1080 cells producing either GFP-NRas (C) or GFP-NRas-HVR (D) for 24 h. MitoTracker 647 was used to label mitochondria. Boxes are highlighting areas enlarged in insets displayed on the right. (E) NRas co-precipitates with DenR. HT1080 cells were transfected with plasmids encoding Halo-NRas and either GFP (control) or GFP-DenR. Co-precipitation was performed with the Chromotek GFP-Trap kit, and proteins were separated by SDS-PAGE and detected by immunoblot. (F) DenR localizes to LCVs. HT1080 cells were challenged with either Lp02, Lp03, or Lp02ΔdenR producing mCherry and SunTag24X-DenR (psuntag-denR) for 6 h. Infected cells were fixed, permeabilized, probed with anti-SunTag antibody, and imaged by confocal microscopy. SunTag24X-DenR signal was enriched primarily at the poles of the LCV, containing either Lp02 or Lp02ΔdenR (functional T4SS) but not Lp03 (defective T4SS). Scale bars, 2 μm. For whole cells, see Figure S7A.
Figure 6.
Figure 6.. DenR-induced redistribution of NRas to LCVs dampens MAPK signaling
(A) NRas on the LCV is signaling competent. HT1080GFP–NRas cells were transfected with constructs encoding Halo-Raf1-RBD, and challenged with Lp02 for 7 h, and visualized by live microscopy after adding 500 nM Janelia Fluor-549 Halo Tag ligand for 30 min. Scale bar, 2 μm. (B) Effect of DenR on the host cell phosphoproteome. RAW264.7 macrophages were challenged with Lp02ΔdenR containing either the complementation plasmid (pdenR) or an empty vector (control), and the RAW264.7 cell phosphoproteome was analyzed by mass spectrometry. Volcano plot showing phosphopeptides with increased (green) or decreased (red) abundance in RAW264.7 cells infected with Lp02ΔdenR(pdenR) compared with Lp02ΔdenR for phospho-enriched fraction E1 (p < 0.05, 1.4-fold change). (C) Distribution of hits within the NRas KEGG pathway. Significant (p < 0.05, 1.4-fold change in Lp02ΔdenR(pdenR) vs. Lp02ΔdenR) global and phosphoproteomic hits were overlaid onto the prototypical KEGG pathway for Ras signaling (mmu04014). Proteins with altered quantity that emerged from the global proteomic analysis are denoted with a dotted line, and proteins with altered phosphorylation levels are denoted with a solid bold line. Enriched Ras-related “Reactome” pathways (bottom boxes, denoted with an arrow shape) from either global expression data hits (dotted lines) or phosphopeptide hits (solid bold line) are highly similar. Additional related pathway proteins (bottom boxes) that are associated with different arms of the known Ras signaling network but not easily added to the KEGG map are listed at the bottom and are denoted with dotted lines (from global proteome analysis) or solid bold lines (from phosphoproteome analysis). (D) Reactome pathway enrichment for proteins with increased phosphorylation in the Lp02ΔdenR(pdenR) sample compared with the Lp02ΔdenR sample. Color groupings are based on Reactome categories for each pathway. (E) HT1080 cells transfected (18 h) with increasing concentrations of plasmid encoding mCherry-DenR or the empty vector (control) were harvested, and their lysate probed by immunoblot for phospho-MEK (pMEK Ser217/Ser221) and phospho-ERK (Thr202/Tyr204). Graphs show normalization to total protein levels (pMEK/tMEK or pERK/tERK). Plasmid concentrations shown are μg per 1 × 10⁷ cells. EV, empty vector. (F) RAW264.7 macrophages were challenged with Lp02 (WT), Lp02ΔdenR, or Lp02ΔdenR(pdenR) for 18 hpi. Lysates from three separate experiments were probed by immunoblot for phospho-MEK/ERK levels relative to total protein levels (tMEK/tERK). Lysates from four separate experiments were probed by immunoblot for total NRas levels normalized to tubulin. Immunoblots are representative of all replicates. Individual data points are plotted relative to Lp02 and mean of replicates is displayed as bars. Statistical significance was calculated using one-way ANOVA with multiple comparisons to the control using Dunnett’s test, *p = 0.0274 (n = 3), ***p = 0.008 (n = 3); ns, not significant (n = 4). See also Figure S8.

References

    1. Schroeder GN, Pearson JS, and Thurston TLM (2021). Editorial: Bacterial Effectors as Drivers of Human Disease: Models, Methods, Mechanisms. Front. Cell. Infect. Microbiol 11, 708228. 10.3389/fcimb.2021.708228. - DOI - PMC - PubMed
    1. Ham H, Sreelatha A, and Orth K (2011). Manipulation of host membranes by bacterial effectors. Nat. Rev. Microbiol 9, 635–646. 10.1038/nrmicro2602. - DOI - PubMed
    1. Spanò S, and Galán JE (2018). Taking control: Hijacking of Rab GTPases by intracellular bacterial pathogens. Small GTPases 9, 182–191. 10.1080/21541248.2017.1336192. - DOI - PMC - PubMed
    1. Newton HJ, Ang DKY, Driel I.R.v., and Hartland EL (2010). Molecular Pathogenesis of Infections Caused by Legionella pneumophila. Clin. Microbiol. Rev 23, 274–298. 10.1128/cmr.00052-09. - DOI - PMC - PubMed
    1. Brumell JH, and Scidmore MA (2007). Manipulation of Rab GTPase Function by Intracellular Bacterial Pathogens. Microbiol. Mol. Biol. Rev 71, 636–652. 10.1128/mmbr.00023-07. - DOI - PMC - PubMed

Publication types

MeSH terms