Machine learning for differentiating lung squamous cell cancer from adenocarcinoma using Clinical-Metabolic characteristics and 18F-FDG PET/CT radiomics
- PMID: 38568892
- PMCID: PMC10990193
- DOI: 10.1371/journal.pone.0300170
Machine learning for differentiating lung squamous cell cancer from adenocarcinoma using Clinical-Metabolic characteristics and 18F-FDG PET/CT radiomics
Abstract
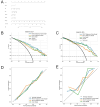
Noninvasive differentiation between the squamous cell carcinoma (SCC) and adenocarcinoma (ADC) subtypes of non-small cell lung cancer (NSCLC) could benefit patients who are unsuitable for invasive diagnostic procedures. Therefore, this study evaluates the predictive performance of a PET/CT-based radiomics model. It aims to distinguish between the histological subtypes of lung adenocarcinoma and squamous cell carcinoma, employing four different machine learning techniques. A total of 255 Non-Small Cell Lung Cancer (NSCLC) patients were retrospectively analyzed and randomly divided into the training (n = 177) and validation (n = 78) sets, respectively. Radiomics features were extracted, and the Least Absolute Shrinkage and Selection Operator (LASSO) method was employed for feature selection. Subsequently, models were constructed using four distinct machine learning techniques, with the top-performing algorithm determined by evaluating metrics such as accuracy, sensitivity, specificity, and the area under the curve (AUC). The efficacy of the various models was appraised and compared using the DeLong test. A nomogram was developed based on the model with the best predictive efficiency and clinical utility, and it was validated using calibration curves. Results indicated that the logistic regression classifier had better predictive power in the validation cohort of the radiomic model. The combined model (AUC 0.870) exhibited superior predictive power compared to the clinical model (AUC 0.848) and the radiomics model (AUC 0.774). In this study, we discovered that the combined model, refined by the logistic regression classifier, exhibited the most effective performance in classifying the histological subtypes of NSCLC.
Copyright: © 2024 Zhang et al. This is an open access article distributed under the terms of the Creative Commons Attribution License, which permits unrestricted use, distribution, and reproduction in any medium, provided the original author and source are credited.
Conflict of interest statement
The authors have declared that no competing interests exist.
Figures


References
-
- Bradley JD, Paulus R, Komaki R, Masters G, Blumenschein G, Schild S, et al.. Standard-dose versus high-dose conformal radiotherapy with concurrent and consolidation carboplatin plus paclitaxel with or without cetuximab for patients with stage IIIA or IIIB non-small-cell lung cancer (RTOG 0617): a randomised, two-by-two factorial phase 3 study. The Lancet Oncology. 2015;16: 187–199. doi: 10.1016/S1470-2045(14)71207-0 - DOI - PMC - PubMed
-
- Bryan S, Masoud H, Weir Hannah K, Woods R, Lockwood G, Smith Lisa F, et al.. Cancer in Canada: Stage at diagnosis. Health Reports, Health Reports. 2018. - PubMed
MeSH terms
Substances
LinkOut - more resources
Full Text Sources
Medical
Research Materials

