Assessing the sensitivity and suitability of a range of detectors for SIMT PSQA
- PMID: 38569013
- PMCID: PMC11087180
- DOI: 10.1002/acm2.14343
Assessing the sensitivity and suitability of a range of detectors for SIMT PSQA
Abstract
Purpose: Single-isocenter multi-target intracranial stereotactic radiotherapy (SIMT) is an effective treatment for brain metastases with complex treatment plans and delivery optimization necessitating rigorous quality assurance. This work aims to assess five methods for quality assurance of SIMT treatment plans in terms of their suitability and sensitivity to delivery errors.
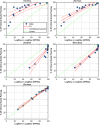
Methods: Sun Nuclear ArcCHECK and SRS MapCHECK, GafChromic EBT Radiochromic Film, machine log files, and Varian Portal Dosimetry were all used to measure 15 variations of a single SIMT plan. Variations of the original plan were created with Python. They comprised various degrees of systematic MLC offsets per leaf up to 2 mm, random per-leaf variations with differing minimum and maximum magnitudes, simulated collimator, and dose miscalibrations (MU scaling). The erroneous plans were re-imported into Eclipse and plan-quality degradation was assessed by comparing each plan variation to the original clinical plan in terms of the percentage of clinical goals passing relative to the original plan. Each erroneous plan could be then ranked by the plan-quality degradation percentage following recalculation in the TPS so that the effects of each variation could be correlated with γ pass rates and detector suitability.
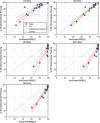
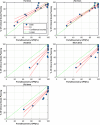
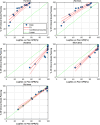
Results & conclusions: It was found that 2%/1 mm is a good starting point for the ArcCHECK, Portal Dosimetry, and the SRS MapCHECK methods, respectively, and provides clinically relevant error detection sensitivity. Looser dose criteria of 5%/1 mm or 5%/1.5 mm are suitable for film dosimetry and log-file-based methods. The statistical methods explored can be expanded to other areas of patient-specific QA and detector assessment.
Keywords: ArcCHECK; PSQA; SIMT; SRS; SRS MapCHECK; SRT; detector; external beam; film; log file; portal dosimetry; quality assurance; sensitivity; stereotactic.
© 2024 The Authors. Journal of Applied Clinical Medical Physics is published by Wiley Periodicals, Inc. on behalf of The American Association of Physicists in Medicine.
Conflict of interest statement
The authors declare no conflicts of interest.
Figures






Similar articles
-
Evaluation of commercial devices for patient specific QA of stereotactic radiotherapy plans.J Appl Clin Med Phys. 2023 Aug;24(8):e14009. doi: 10.1002/acm2.14009. Epub 2023 May 9. J Appl Clin Med Phys. 2023. PMID: 37158727 Free PMC article.
-
Dosimetric commissioning of a high-resolution CMOS 2D detector array for patient-specific QA of single-isocenter multi-target VMAT stereotactic radiosurgery.J Radiat Res. 2024 Dec 3;65(6):787-797. doi: 10.1093/jrr/rrae080. J Radiat Res. 2024. PMID: 39412202 Free PMC article.
-
Multi-institution validation of a new high spatial resolution diode array for SRS and SBRT plan pretreatment quality assurance.Med Phys. 2020 Jul;47(7):3153-3164. doi: 10.1002/mp.14153. Epub 2020 Apr 27. Med Phys. 2020. PMID: 32215929
-
Assessing the feasibility of single target radiosurgery quality assurance with portal dosimetry.J Appl Clin Med Phys. 2019 May;20(5):135-140. doi: 10.1002/acm2.12578. Epub 2019 Apr 1. J Appl Clin Med Phys. 2019. PMID: 30933414 Free PMC article.
-
Systematic evaluation of spatial resolution and gamma criteria for quality assurance with detector arrays in stereotactic radiosurgery.J Appl Clin Med Phys. 2024 Feb;25(2):e14274. doi: 10.1002/acm2.14274. Epub 2024 Jan 24. J Appl Clin Med Phys. 2024. PMID: 38265979 Free PMC article.
Cited by
-
A Time-Series Approach for Machine Learning-Based Patient-Specific Quality Assurance of Radiosurgery Plans.Bioengineering (Basel). 2025 Aug 21;12(8):897. doi: 10.3390/bioengineering12080897. Bioengineering (Basel). 2025. PMID: 40868410 Free PMC article.
-
Reporting Clinical Results of EPID-Based Patient-Specific Quality Assurance for Brain Stereotactic Radiosurgery/Radiation Therapy: Demonstrating the Feasibility of Same-Day Stereotactic Radiosurgery via HyperArc Delivery.Adv Radiat Oncol. 2025 Jun 7;10(8):101831. doi: 10.1016/j.adro.2025.101831. eCollection 2025 Aug. Adv Radiat Oncol. 2025. PMID: 40686738 Free PMC article.
References
-
- Aoki K, Nagatani Y, Noma K, et al. Effective control of brain metastases irrespective of distance from isocenter in single‐isocenter multitarget stereotactic radiosurgery. Anticancer Res. 2021;41(5):2575‐2581. - PubMed
-
- Rostampour N, Badrigilan S, Rezaeian S, et al. Efficacy of stereotactic radiosurgery as single or combined therapy for brain metastasis: a systematic review and meta‐analysis. Crit Rev Oncol Hematol. 2023;186:104015. - PubMed
MeSH terms
LinkOut - more resources
Full Text Sources
Medical
Research Materials

