. 2024 Apr 5;10(14):eadj4009.
doi: 10.1126/sciadv.adj4009. Epub 2024 Apr 3.

SF3A2 promotes progression and cisplatin resistance in triple-negative breast cancer via alternative splicing of MKRN1

Affiliations

SF3A2 promotes progression and cisplatin resistance in triple-negative breast cancer via alternative splicing of MKRN1

Ling Deng et al. Sci Adv. .

Abstract

Triple-negative breast cancer (TNBC) is the deadliest subtype of breast cancer owing to the lack of effective therapeutic targets. Splicing factor 3a subunit 2 (SF3A2), a poorly defined splicing factor, was notably elevated in TNBC tissues and promoted TNBC progression, as confirmed by cell proliferation, colony formation, transwell migration, and invasion assays. Mechanistic investigations revealed that E3 ubiquitin-protein ligase UBR5 promoted the ubiquitination-dependent degradation of SF3A2, which in turn regulated UBR5, thus forming a feedback loop to balance these two oncoproteins. Moreover, SF3A2 accelerated TNBC progression by, at least in part, specifically regulating the alternative splicing of makorin ring finger protein 1 (MKRN1) and promoting the expression of the dominant and oncogenic isoform, MKRN1-T1. Furthermore, SF3A2 participated in the regulation of both extrinsic and intrinsic apoptosis, leading to cisplatin resistance in TNBC cells. Collectively, these findings reveal a previously unknown role of SF3A2 in TNBC progression and cisplatin resistance, highlighting SF3A2 as a potential therapeutic target for patients with TNBC.


Figures
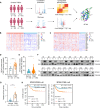
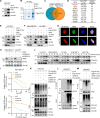
Fig. 1.
Fig. 1.. SF3A2 is frequently overexpressed in TNBC tumors and its high expression indicates poor prognosis for patients with TNBC.
(A) A schematic diagram describing the screening of dysregulated splicing factors in the FUSCC-TNBC quantitative proteome dataset and RNA-seq dataset. This picture was created with BioRender.com. m/z, mass/charge ratio. (B and C) The heatmap of the top 30 splicing factors that were dysregulated both in protein and mRNA levels in the FUSCC-TNBC proteomic (B) and FUSCC-TNBC RNA-seq datasets (C), respectively. (D) The protein level of SF3A2 in the FUSCC-TNBC quantitative proteome dataset. (E) The mRNA level of SF3A2 in the FUSCC-TNBC RNA-seq dataset. (F and G) Immunoblotting analyses of SF3A2 protein levels using 20 pairs of human TNBC specimens and adjacent normal tissues (F). The corresponding quantitative result is presented in (G). The protein gray scale was quantified by ImageJ software, and the expression level of SF3A2 was standardized to vinculin. N, normal; T, TNBC. (H) Kaplan-Meier analyses of overall survival and distant metastasis–free survival of SF3A2 in TNBC using the Kaplan-Meier plotter breast cancer mRNA dataset.
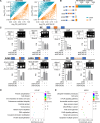
Fig. 2.
Fig. 2.. SF3A2 increases the oncogenic potential of TNBC cells.
(A) Immunoblotting analyses of SF3A2 protein levels in the normal breast cancer cell line MCF10A and 10 representative TNBC cell lines. (B) Immunoblotting analyses of SF3A2 protein levels in MDA-MB-231 and SUM159PT cells stably expressing shNC or shSF3A2 (#1 and #2). (C) Immunoblotting analyses of SF3A2 protein levels in MDA-MB-231 and SUM159PT cells stably expressing shNC, shSF3A2*, or shSF3A2* + Flag-SF3A2. (D to F) Cell proliferation (D) and colony formation [(E) and (F)] assays were carried out using cells as described in (B). Representative images [(E), scale bars, 0.5 cm] and corresponding quantification (F) of survival colonies are displayed. (G to I) Migration and invasion assays were conducted with cells described in (B) [(G), scale bars, 100 μm]. The quantitative results of migrated and invaded cells are shown in (H) and (I), respectively. (J to L) Cell proliferation (J) and colony formation [(K) and (L)] assays were carried out using cells as described in (C). Representative images [(K), scale bars, 0.5 cm] and corresponding quantification (L) of survival colonies are displayed. (M to O) Migration and invasion assays were conducted with cells described in (C) [(M), scale bar, 100 μm]. The quantitative results of migrated and invaded cells are shown in (N) and (O), respectively.
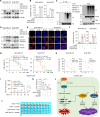
Fig. 3.
Fig. 3.. SF3A2 is degraded by UBR5 through the ubiquitin-proteasome pathway.
(A) Immunoblotting analysis of HEK293T cells stably expressing pLVX or Flag-SF3A2. (B) HEK293T cells stably expressing pLVX or Flag-SF3A2 were subjected to IP assay, and then analyzed by LC-MS. (C) The list of SF3A2-interacting proteins identified by LC-MS analysis. (D) The top 10 SF3A2-binding proteins based on the number of unique peptides. (E) IP assay was performed using HEK293T cells transiently expressing pLVX or Flag-SF3A2 to detect the interaction between SF3A2 and UBR5. (F) IP assays were performed using MDA-MB-231 and Hs-578 T cells stably expressing pLVX or Flag-SF3A2 to detect the interaction between SF3A2 and UBR5. (G) Immunofluorescent staining indicating the colocalization of SF3A2 and UBR5 in MDA-MB-231 and Hs-578 T cells stably expressing HA-SF3A2. Exogenous HA-SF3A2 (red), endogenous UBR5 (green), and nuclear (blue) (scale bars, 10 μm). (H) Immunoblotting analyses showing SF3A2 protein expression levels in MDA-MB-231 and Hs-578 T cells stably expressing shNC or shUBR5 (#1 and #3). (I) Immunoblotting analyses showing SF3A2 protein expression levels in MDA-MB-231 and Hs-578 T cells stably expressing shNC or shUBR5 (#1 and #3) treated with cycloheximide (CHX; 100 μg/ml) for the indicated time. Quantitative results of relative SF3A2 protein levels (SF3A2/vinculin) which were analyzed by ImageJ are shown. (J) Immunoblotting analyses using a series of cell lines supplemented with 10 μM MG132 for the indicated time, and CDKN1A (a known substrate of the ubiquitin-proteasome system) was used as a positive control. (K to M) In vivo ubiquitination assay demonstrating the ubiquitinated SF3A2 proteins. HEK293T cells transfected with the indicated plasmid were treated with 10 μM MG132 for 6 hours, followed by IP and subsequent immunoblotting analyses.
Fig. 4.
Fig. 4.. Global profiles of SF3A2-regulated AS in TNBC cells.
(A) Dot plot displaying PSI profiles of AS events identified in control (y axis) and SF3A2-silencing MDA-MB-231 cells (x axis). Notably, down-regulated (aquamarine) or up-regulated (orange) AS events are highlighted (n = 3). (B) The AS events shared by shSF3A2#1 versus shNC and shSF3A2#2 versus shNC groups were divided into five categories: SE, RI, MXE, A5SS, and A3SS. (C) RT-PCR assays were performed to validate SF3A2-affected AS events. ImageJ software was used to quantify the gray intensity of the DNA gel band and PSI was calculated as splice_in /(splice_in + splice_out). (D and E) Gene Ontology biological process (GO-BP) (D) and Kyoto Encyclopedia of Genes and Genomes (KEGG) pathway analyses (E) of SF3A2-regulated AS targets.
Fig. 5.
Fig. 5.. SF3A2 regulates MKRN1 splicing to induce the full-length MKRN1 isoform.
(A) Sashimi plots showing MKRN1 exon 5 with A5SS usage. (B) Gene structure of two MKRN1 transcripts (top) and RT-PCR validation of MKRN1 alternative splicing using MDA-MB-231 and SUM159PT cells stably expressing shNC or shSF3A2 (#1 and #2) (bottom). (C) Top: Schematic diagram of the MKRN1 minigene. Bottom: Splicing of the MKRN1 minigene was verified by RT-PCR. The percentages of MKRN1-T1 within the total MKRN1 transcripts are presented using T1% in (B) and (C). (D) RT-qPCR analyses were performed with isoform-specific primers in MDA-MB-231 and SUM159PT cells stably expressing shNC or shSF3A2 (#1 and #2). The ratio of MKRN1-T1/T2 isoforms to all isoforms is shown. (E) Immunoblotting analyses of MKRN1 protein levels in MDA-MB-231 and SUM159PT cells stably expressing shNC or shSF3A2 (#1 and #2). (F) Immunoblotting analyses of MKRN1 protein levels in MDA-MB-231 and SUM159PT cells stably expressing shNC, shSF3A2*, or shSF3A2* + Flag-SF3A2.
Fig. 6.
Fig. 6.. SF3A2-regulated tumor-promoting activities are partially mediated by abnormal MKRN1 splicing switch.
(A) Immunoblotting analyses were conducted using MDA-MB-231 and SUM159PT cells stably expressing shNC, shSF3A2 #2, shSF3A2 #2 + MKRN1-T1, or shSF3A2 #2 + MKRN1-T2. (B) Cell proliferation assays were carried out using cells as described in (A). (C) Colony formation assays were performed using cells as described in (A). The quantitative results of survival colonies are shown in (C), and corresponding representative images are provided in fig. S7A. (D and E) Migration and invasion assays were conducted with cells as described in (A). The quantitative results of migrated and invaded cells are shown in (D) and (E), respectively. Corresponding representative images are displayed in fig. S7B. (F and G) MDA-MB-231 cells stably expressing shNC, shSF3A2 #2, shSF3A2 #2 + MKRN1-T1, or shSF3A2 #2 + MKRN1-T2 were subcutaneously injected into the mammary fat pads of mice (n = 10). The growth curve and tumor weight of xenograft tumors are shown in (F) and (G), respectively. (H and I) LM2-4175 cells stably expressing shNC, shSF3A2 #2, shSF3A2 #2 + MKRN1-T1, or shSF3A2 #2 + MKRN1-T2 were inoculated into the mammary fat pads of mice (n = 10). The incidence of lung metastasis and representative images of hematoxylin and eosin (H&E) staining sections are presented in (H) and (I), respectively (scale bars, 200 μm).
Fig. 7.
Fig. 7.. SF3A2 regulates TNBC apoptosis and contributes to cisplatin resistance in TNBC cells.
(A) Immunoblotting analyses of FADD protein levels in MDA-MB-231 and SUM159PT cells stably expressing shNC or shSF3A2 (#1 and #2). (B) Flow cytometry analysis of cell apoptosis was conducted using MDA-MB-231 and SUM159PT cells stably expressing shNC or shSF3A2 (#1 and #2). (C) In vivo ubiquitination assay demonstrating the ubiquitinated FADD proteins. HEK293T cells transfected with the indicated plasmid were treated with 10 μM MG132 for 6 hours, followed by IP and subsequent immunoblotting analyses. (D) Immunoblotting analyses of γH2AX and cleaved caspase-3 protein levels in MDA-MB-231 and SUM159PT cells stably expressing shNC or shSF3A2 (#1 and #2). (E and F) MDA-MB-231 and SUM159PT cells stably expressing shNC or shSF3A2 (#1 and #2) were subjected to immunofluorescence staining for γH2AX or 4′,6-diamidino-2-phenylindole (DAPI). Representative images are shown in [(E), scale bars, 10 μm] and corresponding calculations of clustered foci are displayed in (F). (G) SF3A2 knockdown endows sensitivity to cisplatin in TNBC cells as detected by CCK8 assay. (H) SF3A2 ablation confers sensitivity to cisplatin in TNBC cells as confirmed by colony formation assay. Quantitative results of survival colonies are shown in (H) and corresponding representative images are provided in fig. S9C. (I to K) A total of 5 × 10⁶ MDA-MB-231 cells stably expressing shNC or shSF3A2 #2 were transplanted into the mammary fat pads of mice (n = 10). Cisplatin treatment (3 mg/kg in 1× PBS) was initiated when tumors reached 100 mm3 and administered twice a week via intraperitoneal injection. Tumor growth curve (I), tumor photograph (J), and weight (K) are shown. (L) The proposed working model.

References

    1. Yeo S. K., Guan J.-L., Breast cancer: Multiple subtypes within a tumor? Trends Cancer 3, 753–760 (2017). - PMC - PubMed
    1. Gluz O., Liedtke C., Gottschalk N., Pusztai L., Nitz U., Harbeck N., Triple-negative breast cancer—Current status and future directions. Ann. Oncol. 20, 1913–1927 (2009). - PubMed
    1. Billar J. A. Y., Dueck A. C., Stucky C.-C. H., Gray R. J., Wasif N., Northfelt D. W., McCullough A. E., Pockaj B. A., Triple-negative breast cancers: Unique clinical presentations and outcomes. Ann. Surg. Oncol. 17, 384–390 (2010). - PubMed
    1. Malorni L., Shetty P. B., De Angelis C., Hilsenbeck S., Rimawi M. F., Elledge R., Osborne C. K., De Placido S., Arpino G., Clinical and biologic features of triple-negative breast cancers in a large cohort of patients with long-term follow-up. Breast Cancer Res. Treat. 136, 795–804 (2012). - PMC - PubMed
    1. Bianchini G., Balko J. M., Mayer I. A., Sanders M. E., Gianni L., Triple-negative breast cancer: Challenges and opportunities of a heterogeneous disease. Nat. Rev. Clin. Oncol. 13, 674–690 (2016). - PMC - PubMed

Publication types

MeSH terms