County-Level Socio-Environmental Factors Associated With Stroke Mortality in the United States: A Cross-Sectional Study
- PMID: 38569060
- PMCID: PMC11447143
- DOI: 10.1177/00033197241244814
County-Level Socio-Environmental Factors Associated With Stroke Mortality in the United States: A Cross-Sectional Study
Abstract
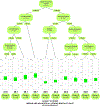
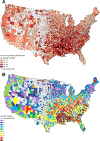
We used machine learning methods to explore sociodemographic and environmental determinants of health (SEDH) associated with county-level stroke mortality in the USA. We conducted a cross-sectional analysis of individuals aged ≥15 years who died from all stroke subtypes between 2016 and 2020. We analyzed 54 county-level SEDH possibly associated with age-adjusted stroke mortality rates/100,000 people. Classification and Regression Tree (CART) was used to identify specific county-level clusters associated with stroke mortality. Variable importance was assessed using Random Forest analysis. A total of 501,391 decedents from 2397 counties were included. CART identified 10 clusters, with 77.5% relative increase in stroke mortality rates across the spectrum (28.5 vs 50.7 per 100,000 persons). CART identified 8 SEDH to guide the classification of the county clusters. Including, annual Median Household Income ($), live births with Low Birthweight (%), current adult Smokers (%), adults reporting Severe Housing Problems (%), adequate Access to Exercise (%), adults reporting Physical Inactivity (%), adults with diagnosed Diabetes (%), and adults reporting Excessive Drinking (%). In conclusion, SEDH exposures have a complex relationship with stroke. Machine learning approaches can help deconstruct this relationship and demonstrate associations that allow improved understanding of the socio-environmental drivers of stroke and development of targeted interventions.
Keywords: epidemiology; health policy; machine learning; sociodemographic and environmental determinants of health; stroke.
Conflict of interest statement
Declaration of Conflicting InterestsThe author(s) declared no potential conflicts of interest with respect to the research, authorship, and/or publication of this article.
Figures


References
-
- Virani SS, Alonso A, Benjamin EJ, et al. Heart Disease and Stroke Statistics—2020 Update: A Report From the American Heart Association. Circulation. 2020;141:e139–e596. - PubMed
-
- Obisesan TO, Vargas CM, Gillum RF. Geographic Variation in Stroke Risk in the United States. Stroke. 2000;31:19–25. - PubMed
-
- Rajagopalan S, Al-Kindi SG, Brook RD. Air Pollution and Cardiovascular Disease: JACC State-of-the-Art Review. J Am Coll Cardiol. 2018;72:2054–2070. - PubMed
MeSH terms
Grants and funding
LinkOut - more resources
Full Text Sources
Medical

