. 2024 Apr 2;36(4):745-761.e5.
doi: 10.1016/j.cmet.2024.03.002.

Cardiometabolic characteristics of people with metabolically healthy and unhealthy obesity

Affiliations

Cardiometabolic characteristics of people with metabolically healthy and unhealthy obesity

Max C Petersen et al. Cell Metab. .

Abstract

There is considerable heterogeneity in the cardiometabolic abnormalities associated with obesity. We evaluated multi-organ system metabolic function in 20 adults with metabolically healthy obesity (MHO; normal fasting glucose and triglycerides, oral glucose tolerance, intrahepatic triglyceride content, and whole-body insulin sensitivity), 20 adults with metabolically unhealthy obesity (MUO; prediabetes, hepatic steatosis, and whole-body insulin resistance), and 15 adults who were metabolically healthy lean. Compared with MUO, people with MHO had (1) altered skeletal muscle biology (decreased ceramide content and increased expression of genes involved in BCAA catabolism and mitochondrial structure/function); (2) altered adipose tissue biology (decreased expression of genes involved in inflammation and extracellular matrix remodeling and increased expression of genes involved in lipogenesis); (3) lower 24-h plasma glucose, insulin, non-esterified fatty acids, and triglycerides; (4) higher plasma adiponectin and lower plasma PAI-1 concentrations; and (5) decreased oxidative stress. These findings provide a framework of potential mechanisms responsible for MHO and the metabolic heterogeneity of obesity. This study was registered at ClinicalTrials.gov (NCT02706262).

Keywords: adipose tissue; beta cell function; insulin resistance; insulin sensitivity; metabolically healthy obesity; obesity; skeletal muscle.


Conflict of interest statement

Declaration of interests S.K. serves on scientific advisory boards for Altimmune, Merck, Scholar Rock, and CinFina Pharma. R.A.B. receives royalty income related to the CompBio method developed by R.A.B. and licensed by Washington University to PercayAI. M.Y. is currently an employee of Eli Lilly Japan.

Figures

Figure 1.
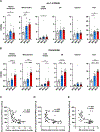
Figure 1.. 24-hour metabolic profiles.
Plasma glucose (A) and insulin (B) concentrations, insulin secretion rate (C), insulin clearance rate (D), plasma glucagon concentration (E), plasma non-esterified fatty acid (NEFA) concentration (F), and plasma triglyceride concentration (G) in MHL (black), MHO (blue), and MUO (red) groups with corresponding areas under the curve (AUC). Three standard meals, estimated to meet individual total daily energy requirements, were served at 0 h (0700 h), 6 h (1300 h) and 12 h (1900 h). For individual data points, filled circles denote females and empty circles denote males. N = 15 MHL, 20 MHO, 20 MUO for all panels except (E), which is N = 11 MHL, 18 MHO, 16 MUO. * P < 0.05, ** P < 0.005, *** P < 0.0001 by one-way ANOVA. Data are means ± SEM.
Figure 2.
Figure 2.. Beta-cell function.
(A) Beta-cell function, assessed as the relationship between insulin secretion rate (ISR) and plasma glucose concentration during the first 30 minutes of the OGTT (time points 0, 10, 20, and 30 minutes). The curves are significantly different by using the extra-sum-of-squares F test (P < 0.0001). (B) ISR incremental AUC (iAUC) divided by plasma glucose iAUC during the first 30 minutes of the OGTT. (C) Beta-cell function, assessed as the relationship between ISR and plasma glucose concentration at 0 and 30 minutes after consuming a mixed meal at 0700 h that provided one-third of each participant’s estimated total daily energy requirement. The slopes are significantly different by using ANCOVA (P = 0.0037). (D) ISR iAUC divided by plasma glucose iAUC during the first 30 minutes after consuming a mixed meal at 0700 h. Color key for panels A and C: black, MHL group; blue, MHO group; red, MUO group. For individual data points, filled circles denote females and empty circles denote males. N = 15 MHL, 20 MHO, 20 MUO for all panels except (B), which is N = 15 MHL, 20 MHO, 19 MUO. ** P < 0.005, *** P < 0.0001 by one-way ANOVA. Data are means ± SEM.
Figure 3.
Figure 3.. Skeletal muscle bioactive lipids.
Skeletal muscle sn-1,2-diacylglycerol (DAG) (A) and ceramide (B) content in specific subcellular fractions in MHL (n=11), MHO (n=15), MUO (n=17) groups. * P < 0.05, ** P < 0.005, *** P < 0.0005, **** P < 0.0001 by one-way ANOVA. For individual data points, filled circles denote females and empty circles denote males. Values are means ± SEM. (C-E) Relationships between ceramide content in the plasma membrane (C), mitochondrial (D), and endoplasmic reticulum (ER) (E) compartments and whole-body insulin sensitivity [glucose rate of disappearance (Rd, expressed as nmol glucose per kilogram fat-free mass per minute) divided by plasma insulin concentration (in μU/mL) during a hyperinsulinemic-euglycemic clamp procedure]. See also Figure S3.
Figure 4.
Figure 4.. Subcutaneous abdominal adipose tissue and skeletal muscle transcriptomics.
RNA was isolated and sequenced from subcutaneous abdominal adipose tissue (SAAT) and skeletal muscle tissue obtained in the postabsorptive state. Differentially expressed genes (DEGs) were defined as fold change >1.25, nominal P <0.05 for a given pairwise comparison. (A) Venn diagram showing SAAT DEGs that were progressively upregulated from the MHL to the MHO to the MUO group. (B) CompBio map of top 12 enriched biological themes in the set of SAAT DEGs upregulated in the MUO compared with the MHO group. Red themes relate to inflammation and blue themes relate to extracellular matrix (ECM) remodeling. Line thickness is proportional to the number of shared DEGs among themes. (C) CompBio enrichment scores for themes in panel B. (D) Heatmap of collagen (composite of 12 individual collagen transcripts) and expression of individual SAAT DEGs within pathways of ECM and inflammation. (E) Venn diagram showing SAAT DEGs that were progressively downregulated from the MHL to the MHO to the MUO group (F) CompBio map of top 12 enriched biological themes in the set of SAAT DEGs downregulated in the MUO compared with the MHO group. Purple themes relate to metabolic pathways. (G) CompBio enrichment scores for themes in panel F. (H) Heatmap of individual SAAT DEGs within pathways of lipogenesis and adipocyte beiging. (I) Venn diagram showing muscle DEGs progressively downregulated from the MHL to the MHO to the MUO group. (J) Map of enriched biological themes in the muscle DEGs downregulated in the MUO compared with the MHO group. Orange themes relate to mitochondria. (K) CompBio enrichment scores for themes in panel J. (L) Heatmap of individual muscle DEGs within pathways of mitochondrial structure/function, transcriptional control of lipid metabolism, and branched-chain amino acid (BCAA) catabolism. There were no significantly enriched themes in the set of <100 DEGs upregulated in MUO compared to MHO skeletal muscle. For SAAT, N = 15 MHL, 19 MHO, 19 MUO. For muscle, N = 12 MHL, 18 MHO, 20 MUO. See also Figure S4 and Tables S2–S3.
Figure 5.
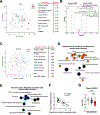
Figure 5.. Dimensionality reduction analysis of features that differentiate the MHL, MHO, and MUO groups.
(A) Principal component analysis and PC1 features with the ten greatest loading coefficients among 100 physiological outcomes in the full cohort (N = 15 MHL, 20 MHO, 20 MUO). (B) Volcano plot of all outcomes with the MUO group vs. MHO group log2 fold change (FC) on the x-axis and −log10 P value (p) on the y-axis. Features with FC >1.5 and FDR-adjusted P <0.001 are labeled in black. (C) Sparse partial-least-squares discriminant analysis of participants with MHO (N = 20) and MUO (N = 20) and loading coefficients of the ten features used to construct component 1. (D) CompBio map of significantly enriched biological themes within the set of 131 muscle transcripts that were positively correlated with muscle mitochondrial ceramide content in all subjects with muscle RNA-sequencing data (N = 12 MHL, 18 MHO, 20 MUO). Orange themes relate to extracellular matrix biology. Line thickness is proportional to the number of shared DEGs among themes. (E) CompBio map of significantly enriched biological themes within the set of 185 muscle transcripts that were negatively correlated with muscle mitochondrial ceramide content. All themes relate to mitochondrial structure/function. (F) Relationship between muscle mitochondrial ceramide content and muscle PAQR4 expression. (G) Muscle PAQR4 expression. See also Figure S5 and Table S4.

References

    1. Klein S, Wadden T, and Sugerman HJ (2002). AGA technical review on obesity. Gastroenterology 123, 882–932. 10.1053/gast.2002.35514. - DOI - PubMed
    1. Stefan N, Häring H-U, Hu FB, and Schulze MB (2013). Metabolically healthy obesity: epidemiology, mechanisms, and clinical implications. Lancet Diabetes Endocrinol. 1, 152–162. 10.1016/S2213-8587(13)70062-7. - DOI - PubMed
    1. Blüher M (2020). Metabolically Healthy Obesity. Endocr. Rev 41. 10.1210/endrev/bnaa004. - DOI - PMC - PubMed
    1. Smith GI, Mittendorfer B, and Klein S (2019). Metabolically healthy obesity: facts and fantasies. J. Clin. Invest. 129, 3978–3989. 10.1172/JCI129186. - DOI - PMC - PubMed
    1. Mongraw-Chaffin M, Foster MC, Anderson CAM, Burke GL, Haq N, Kalyani RR, Ouyang P, Sibley CT, Tracy R, Woodward M, et al. (2018). Metabolically Healthy Obesity, Transition to Metabolic Syndrome, and Cardiovascular Risk. J. Am. Coll. Cardiol. 71, 1857–1865. 10.1016/j.jacc.2018.02.055. - DOI - PMC - PubMed

Associated data