. 2024 May 20;59(10):1233-1251.e5.
doi: 10.1016/j.devcel.2024.03.012. Epub 2024 Apr 2.

The Notch-PDGFRβ axis suppresses brown adipocyte progenitor differentiation in early post-natal mice

Affiliations

The Notch-PDGFRβ axis suppresses brown adipocyte progenitor differentiation in early post-natal mice

Zuoxiao Shi et al. Dev Cell. .

Abstract

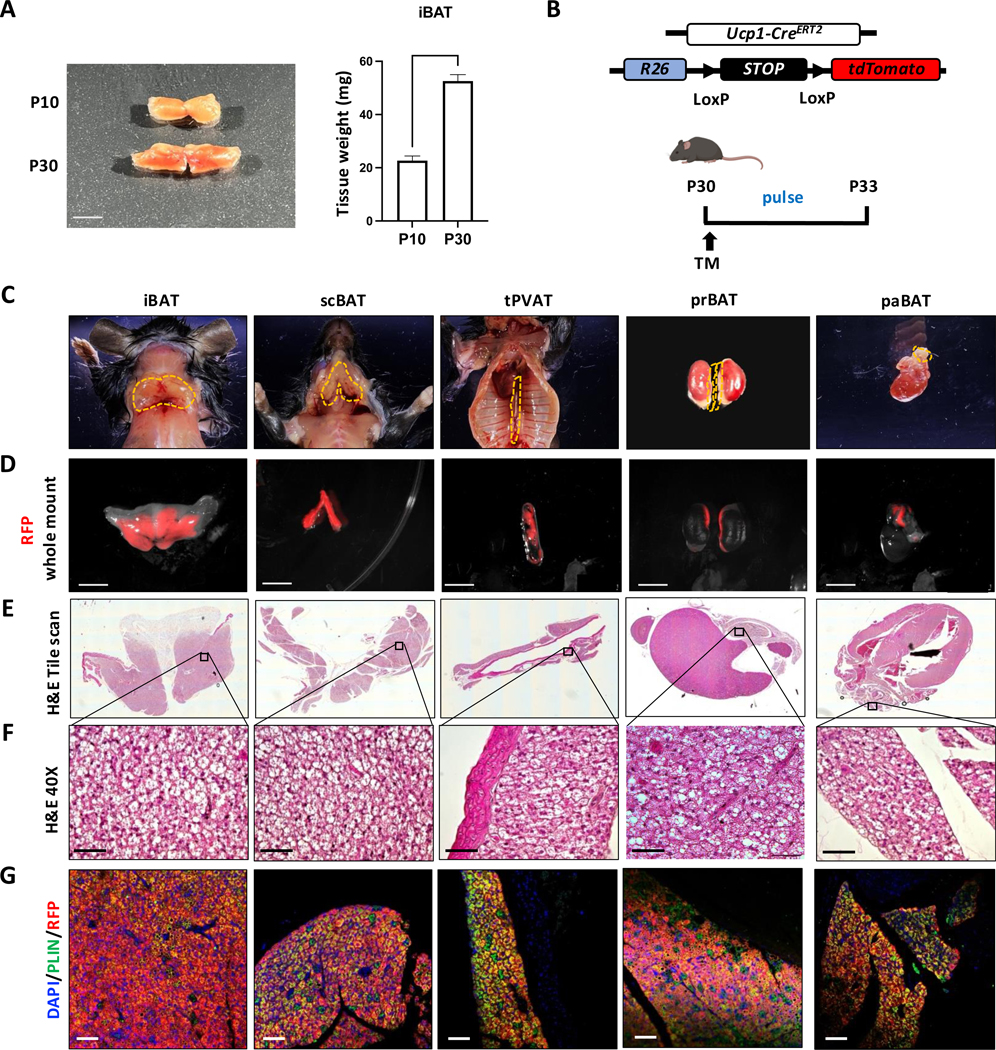
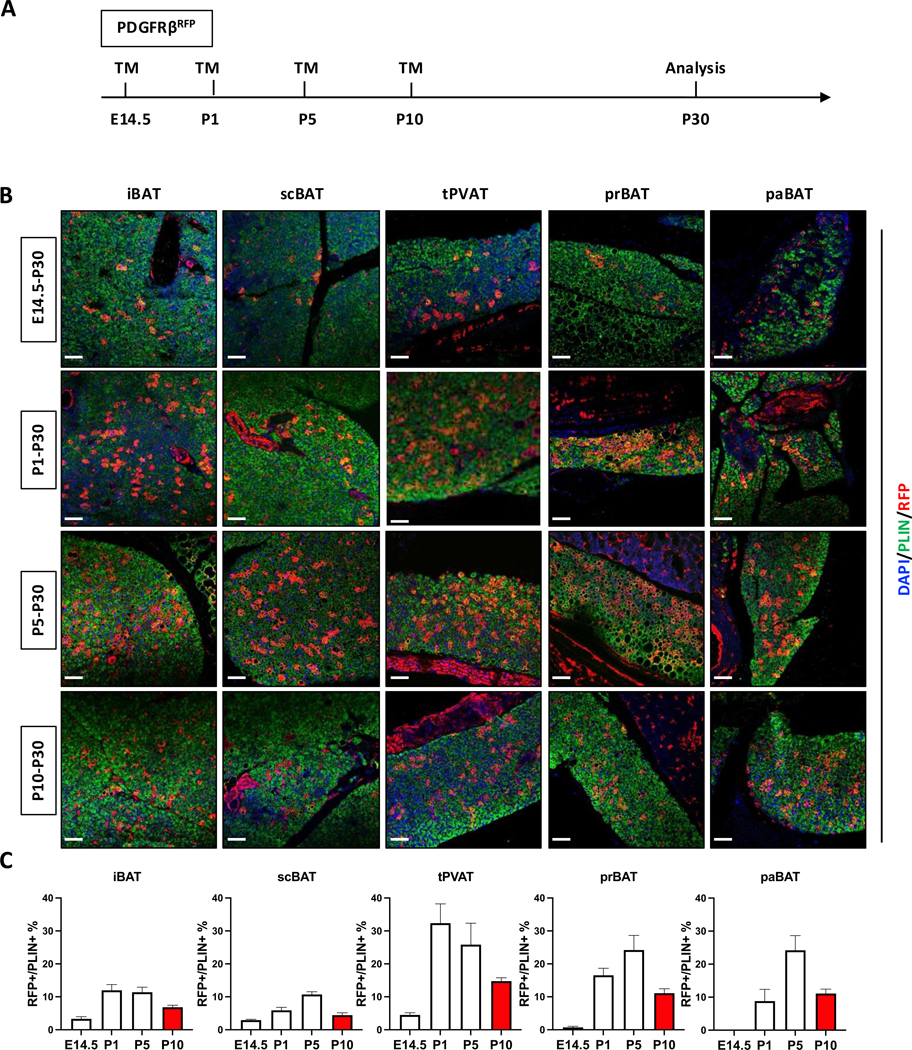
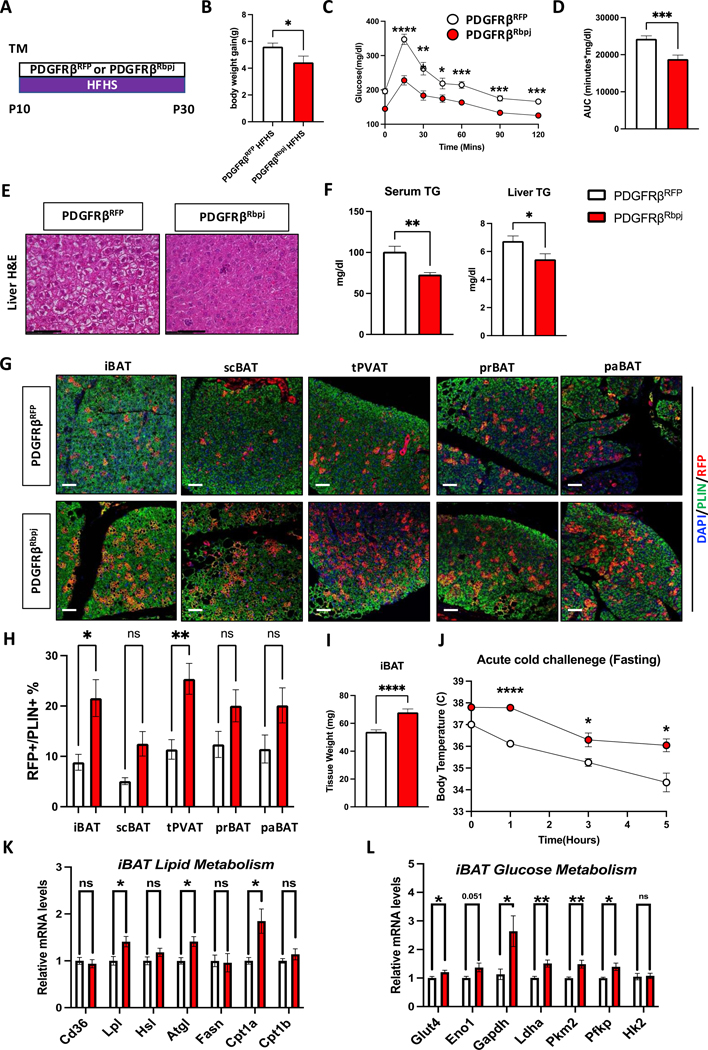
De novo brown adipogenesis holds potential in combating the epidemics of obesity and diabetes. However, the identity of brown adipocyte progenitor cells (APCs) and their regulation have not been extensively explored. Here, through in vivo lineage tracing and mouse modeling, we observed that platelet-derived growth factor receptor beta (PDGFRβ)+ pericytes give rise to developmental brown adipocytes but not to those in adult homeostasis. By contrast, T-box 18 (TBX18)+ pericytes contribute to brown adipogenesis throughout both developmental and adult stages, though in a depot-specific manner. Mechanistically, Notch inhibition in PDGFRβ+ pericytes promotes brown adipogenesis by downregulating PDGFRβ. Furthermore, inhibition of Notch signaling in PDGFRβ+ pericytes mitigates high-fat, high-sucrose (HFHS)-induced glucose and metabolic impairment in mice during their development and juvenile phases. Collectively, these findings show that the Notch/PDGFRβ axis negatively regulates developmental brown adipogenesis, and its repression promotes brown adipose tissue expansion and improves metabolic health.

Keywords: PDGFRβ; Tbx18; brown adipocyte progenitor cells; development; obesity; pericytes.


Conflict of interest statement

Declaration of interests The authors declare no competing interests.

Figures

Figure 1.
Figure 1.. Anatomical locations of BAT depots and iBAT expansion during postnatal development
(A) Representative images comparing interscapular BAT (iBAT) at P10 and P30 mice and corresponding tissue weights. Scale bar, 3mm. (B) UCP1RFP (Ucp1-CreERT2; Rosa26RFP) mouse model and experimental design: Mice received a single intraperitoneal (i.p.) injection of Tamoxifen (TM) at P30, followed by analysis at P33. (C) Anatomical mapping of BAT depots, including iBAT, supraclavicular BAT (scBAT), thoracic perivascular adipose tissue (tPVAT), pre-renal BAT (prBAT), and para-aortic BAT (paBAT), in mice from (B). (D) Representative images of whole-mount RFP images of BAT depots from mice described in (B). Scale bar, 1mm. (E) Representative H&E images of tile scans of various BAT depots identified in (D). (F) High magnification (40X) H&E images of various BAT depots identified in (E). Scale bar, 50 μm. (G) Representative images of IF staining showing DAPI (blue), PLIN (green), and RFP (red) in BAT sections identified in (D), Scale bar, 50 μm.
Figure 2.
Figure 2.. Pericytes contribute to brown adipogenesis in early postnatal development
(A) PDGFRβRFP (Pdgfrβ-CreERT2; Rosa26RFP) and TBX18RFP (Tbx18-CreERT2; Rosa26RFP) mouse models. (B) Experimental Design. Mice were administered a single dose of Tamoxifen (TM) intraperitoneally (i.p.) at P10, with subsequent analysis at P30. BAT depots were examined for direct whole-mount RFP fluorescence and RFP immunofluorescence (IF) staining. (C) Upper panel: Whole mount RFP images of BAT depots in PDGFRβRFP at P30. Scale bar, 1mm. Middle and lower panel: IF staining of DAPI (blue), PLIN (green) and RFP (red). Lower Panel: Enlarged views from the middle panel. Scale Bar, 50 μm. (D) Upper panel: Whole mount RFP images of BAT depots in TBX18RFP at P30. Scale bar, 1mm. Middle and lower panel: IF staining of DAPI (blue), PLIN (green) and RFP (red). Lower Panel: (A) Enlarged views from the middle panel. Scale Bar, 50 μm. (E) Quantification of PLIN and RFP colocalization in BAT depots, based on pixel analysis in IF images from PDGFRβRFP and TBX18RFP mice (n=3–4 images per group). Data are presented as means ± SEM.
Figure 3.
Figure 3.. PDGFRβ+ APCs acquire adipocyte fate during embryogenesis
(A) Experimental Design. PDGFRβRFP mice were TM i.p. injected with one dose at embryonic day 14.5 (E14.5), postnatal day 1 (P1), P5, or P10 and were analyzed at P30. BAT depots were examined for direct whole-mount RFP fluorescence and RFP IF staining. (B) Representative images of IF staining of DAPI (blue), PLIN (green), and RFP (red) in BAT sections. Scale bar, 50 μm. (C) Quantification of PLIN and RFP colocalization in BAT depots, determined by pixel analysis in IF images from various PDGFRβRFP BAT depots (n=3–4 images). Data are presented as means ± SEM.
Figure 4.
Figure 4.. PDGFRβ+ APCs are essential for postnatal BAT development
(A) PDGFRβDTA (Pdgfrβ-CreERT2; Rosa26RFP; Rosa26DTA) mouse model. (B) Experimental Design. A single dose of Tamoxifen (TM) was administered intraperitoneally (i.p.) at P10, with subsequent analysis at P30. BAT depots were examined for direct whole-mount RFP fluorescence and RFP immunofluorescence (IF) staining. (C) Body weight comparison in mice described in (A) (n=8–10). *p< 0.05. Data are presented as means ± SEM. (D) Adipose tissue weights at P30 in mice described in (A) (n=8–10). *p< 0.05. Data are presented as means ± SEM. (E) Weights of other organs at P30 in mice described in (A) (n=8–10). Data are presented as means ± SEM. (F) Fed blood glucose levels at P30 from mice described in (A). Data are presented as means ± SEM. (G) Representative images of IF staining of DAPI (blue), PLIN (green), and RFP (red) in various BAT sections from mice described in (A). Scale bar, 50 μm. (H) Quantification of PLIN and RFP colocalization in various BAT depots described in (G) (n=3–4 images). Data are presented as means ± SEM. (I) Differential interference contrast (DIC)/RFP representative images of differentiated SVF cells from BAT depots (iBAT, scBAT, and tPVAT). Quantification of RFP+ adipocytes percentage in PDGFRβRFP and PDGFRβDTA mice. *p< 0.05, ***p< 0.001. Data are presented as means ± SEM.
Figure 5.
Figure 5.. Inhibiting notch signaling in PDGFRβ+ APCs promotes brown adipogenesis
(A) qRT-PCR analysis of Pdgfrβ, Rfp, Notch2, and Notch3 expression in sorted RFP+ and RFP- iBAT SVF cells from P10 TM injected PDGFRβRFP mice (n=3 per group). *p<0.05, **p<0.01. Data are presented as means ± SEM. (B) Representative images of Oil Red O staining of differentiated P10 wild-type (WT) SVF cells, pretreated with either vehicle or Ly411,575 before differentiation. (C) Quantification of relative Oil Red O accumulation from images described in (B). ***p<0.001. Data are presented as means ± SEM. (D) PDGFRβRbpj (Pdgfrβ-CreERT2; Rosa26RFP; Rbpjfl/fl) mouse model. In vivo studies involved a single TM i.p. injection at P10, with analysis at P30. BATs were assessed for whole-mount RFP fluorescence and RFP IF staining. (E) Upper panel: experimental design: iBAT SVF cells were isolated from P10 PDGFRβRFP and PDGFRβRbpj mice and then treated with 4-OHT for 2 days. Lower panel: Western blot analysis of RBPJ and β-actin in 4-OHT treated SVF cells. (F) Quantification of western blot data from (E). **p<0.01. Data are presented as means ± SEM. (G) Representative images of IF staining of DAPI (blue), PLIN (green), and RFP (red) in various iBAT depots from mice described in (D). Scale bar, 50 μm. (H) Quantification of PLIN and RFP colocalization in BAT depots described in (G) (n=3–4 images). *p<0.05, **p<0.01. Data are presented as means ± SEM. (I) Representative image of IF staining of DAPI (blue) and UCP1(purple) of SVF brown differentiation from P10 PDGFRβRFP and PDGFRβRbpj mice. SVF cells were treated with 4-OHT for 2 days before differentiation. Scale bar, 50 μm (J) qRT-PCR analysis of Ucp1 expression from samples of (I) (n=3 per group). *p<0.05. Data are presented as means ± SEM.
Figure 6.
Figure 6.. Notch inhibition in PDGFRβ+ APCs prevents HFHS diet-induced impairment of glucose metabolism during postnatal stage
(A) Experimental Design. P10 PDGFRβRFP and PDGFRβRbpj mice received a single dose of Tamoxifen (TM) injection, followed by high-fat, high-sugar (HFHS) feeding for 20 days until P30. (B) Comparison of body weight gain in HFHS-fed mice relative to chow-fed counterparts (n>10 mice per group). *p<0.05. Data are presented as means ± SEM. (C) Glucose Tolerance Test (GTT) curve at P30 from mice described in (A) (n>10 mice per group). *p<0.05, **p<0.01, ***p<0.001, ****p<0.0001. Data are presented as means ± SEM. (D) Quantification of Area Under Curve (AUC) from GTT in (C). ***p<0.001. Data are presented as means ± SEM. (E) Representative images of H&E staining of liver tissues at P30 from mice described in (A). Scale bar, 50 μm. (F) Comparison of serum and liver triglyceride levels in PDGFRβRFP and PDGFRβRbpj mice described in (A). *p< 0.05, **p< 0.01. Data are presented as means ± SEM. (G) Representative images of IF staining of DAPI (blue), PLIN (green), and RFP (red) in BAT sections from mice described in (A). Scale bar, 50 μm. (H) Quantification of PLIN and RFP colocalization based on IF staining from (H) (n=3–4 images). *p<0.05, **p<0.01. Data are presented as means ± SEM. (I) iBAT tissue weights at P30 from mice described in (A) (n>10 per group). ****p<0.0001. Data are presented as means ± SEM. (J) Rectal body temperature measurements during cold challenge with fasting in mice described in (A) (n= 5, 4). *p<0.05, ****p<0.0001. Data are presented as means ± SEM. (K) qRT-PCR analysis of lipid metabolism-related gene expression from mice described in (A) (n=5 per group). *p<0.05. Data are presented as means ± SEM. (L) qRT-PCR analysis of glucose metabolism-related gene expression from mice described in (A) (n=5 per group). *p<0.05, **p<0.01. Data are presented as means ± SEM.
Figure 7.
Figure 7.. Notch inhibition in PDGFRβ+ APCs during development prevents juvenile obesity
(A) Experimental Design. TM injection at P10 PDGFRβRFP and PDGFRβRbpj mice, followed by HFHS feeding for 30 days from P30 to P60. (B) Body weight gain comparison from P30 in PDGFRβRFP and PDGFRβRbpj mice (n=6 mice per group). *p<0.05. Data are presented as means ± SEM. (C) Fat content at P60 from mice described in (A) (n=6 per group). **p<0.01. Data are presented as means ± SEM. (D) Lean body mass content at P60 from mice described in (A) (n=6 per group). *p<0.05. Data are presented as means ± SEM. (E) Fed blood glucose levels at P60 from mice described in (A) (n=6 per group). **p<0.01. Data are presented as means ± SEM. (F) GTT curve at P60 from mice described in (A) (n=6 per group). *p<0.05, **p<0.01, ***p<0.001. Data are presented as means ± SEM. (G) Quantification of AUC from GTT in (F) (n=6 per group). ***p<0.001. Data are presented as means ± SEM. (H) Adipose tissue weights at P60 from mice described in (A) (n=6 per group). *p<0.05, **p<0.01. Data are presented as means ± SEM. (I) Representative images of liver H&E staining from mice described in (A). Scale bar, 50 μm. (J) Representative images of IF staining of DAPI (blue), PLIN (green), and RFP (red) in BAT sections from mice described in (A). Scale bar, 50 μm. (K) qRT-PCR analysis of lipid metabolism-related genes from mice described in (A) (n=5 per group). *p<0.05. Data are presented as means ± SEM. (L) qRT-PCR analysis of glucose metabolism-related genes from mice described in (A) (n=5 per group). *p<0.05, **p<0.01. Data are presented as means ± SEM.

Update of

References

    1. Afshin A, Forouzanfar MH, Reitsma MB, Sur P, Estep K, Lee A, Marczak L, Mokdad AH, Moradi-Lakeh M, Naghavi M, et al. (2017). Health Effects of Overweight and Obesity in 195 Countries over 25 Years. N Engl J Med 377, 13–27. 10.1056/NEJMoa1614362. - DOI - PMC - PubMed
    1. Peng J, Lu M, Wang P, Peng Y, and Tang X. (2023). The global burden of metabolic disease in children and adolescents: Data from the Global Burden of Disease 2000–2019. Metabolism 148, 155691. 10.1016/j.metabol.2023.155691. - DOI - PubMed
    1. Chew NWS, Ng CH, Tan DJH, Kong G, Lin C, Chin YH, Lim WH, Huang DQ, Quek J, Fu CE, et al. (2023). The global burden of metabolic disease: Data from 2000 to 2019. Cell Metab 35, 414–428 e413. 10.1016/j.cmet.2023.02.003. - DOI - PubMed
    1. Rosen ED, and Spiegelman BM (2014). What we talk about when we talk about fat. Cell 156, 20–44. 10.1016/j.cell.2013.12.012. - DOI - PMC - PubMed
    1. Gesta S, Tseng YH, and Kahn CR (2007). Developmental origin of fat: tracking obesity to its source. Cell 131, 242–256. S0092–8674(07)01272-X [pii] 10.1016/j.cell.2007.10.004. - DOI - PubMed

Publication types

Associated data

LinkOut - more resources