. 2024 Jun 3;59(11):1457-1474.e5.
doi: 10.1016/j.devcel.2024.03.017. Epub 2024 Apr 2.

Three-dimensional imaging studies in mice identify cellular dynamics of skeletal muscle regeneration

Affiliations

Three-dimensional imaging studies in mice identify cellular dynamics of skeletal muscle regeneration

Brittany C Collins et al. Dev Cell. .

Abstract

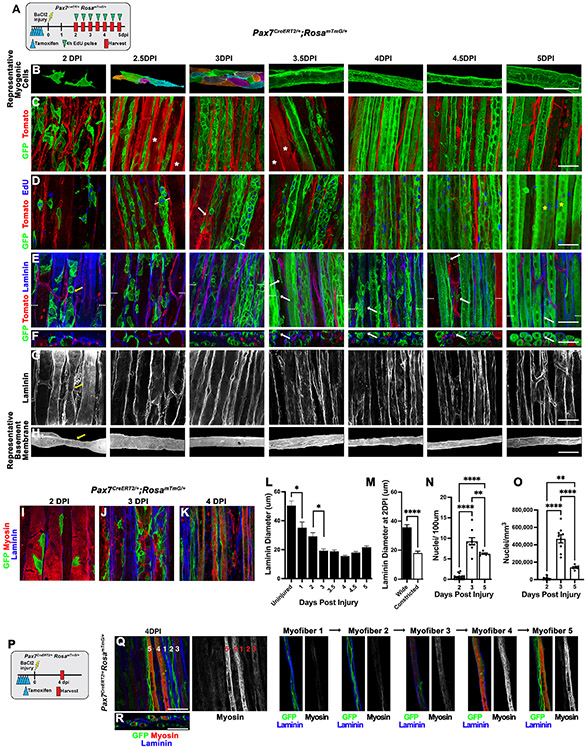
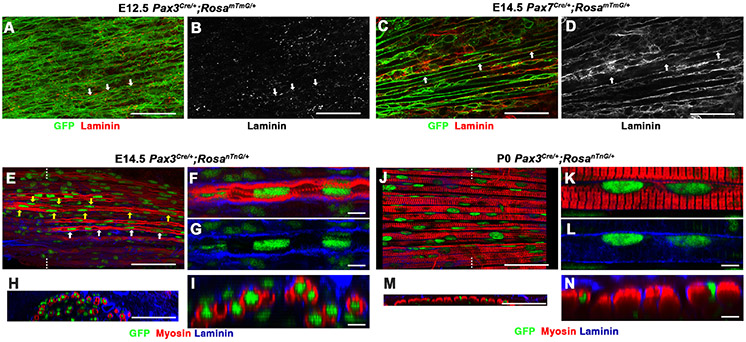
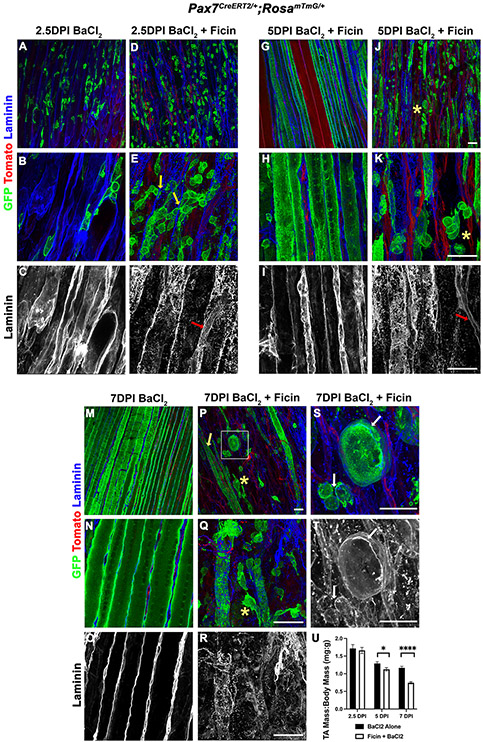
The function of many organs, including skeletal muscle, depends on their three-dimensional structure. Muscle regeneration therefore requires not only reestablishment of myofibers but also restoration of tissue architecture. Resident muscle stem cells (SCs) are essential for regeneration, but how SCs regenerate muscle architecture is largely unknown. We address this problem using genetic labeling of mouse SCs and whole-mount imaging to reconstruct, in three dimensions, muscle regeneration. Unexpectedly, we found that myofibers form via two distinct phases of fusion and the residual basement membrane of necrotic myofibers is critical for promoting fusion and orienting regenerated myofibers. Furthermore, the centralized myonuclei characteristic of regenerated myofibers are associated with myofibrillogenesis and endure months post injury. Finally, we elucidate two cellular mechanisms for the formation of branched myofibers, a pathology characteristic of diseased muscle. We provide a synthesis of the cellular events of regeneration and show that these differ from those used during development.

Keywords: basement membrane; fusion; macrophage; muscle; muscle stem cells; regeneration; satellite cells.


Conflict of interest statement

Declaration of interests The authors declare no competing interests.

Figures

Figure 1.
Figure 1.. Quiescent, Galert, and activated SCs are distinct in size and shape and activated SCs proliferate via planar divisions within residual BM tubes.
(A) Experimental design for labeling SCs, 0-1.5 DPI and Galert (2.5 DPI contralateral uninjured EDL). (B) TA mass during regeneration (n = 3-5 mice/DPI). (C-E) Number of GFP+ mononuclear myogenic cells in TA by FACS (n = 3-5 mice/DPI) (C-D) and counts on wholemount images of EDLs (n = 3-7 mice/DPI) (E). (F-K) Wholemount images of uninjured, Galert, 1 and 1.5 DPI EDL (n= ≥ 3 mice/DPI). (F) Representative segmented SCs. (G-H) Superficial view of GFP+ SCs and TOM+ uninjured myofibers (Uninjured and Galert columns), TOM+ degrading myofibers (*’s at 1 DPI), and TOM+ capillaries (all columns). (H) Laminin+ BM outlines uninjured myofibers, residual BM of injured myofibers, and surrounds capillaries. Dotted white lines indicate cross-section level shown in (I). White arrows in (G-I) show GFP+ SCs in close contact with TOM+ capillaries. Yellow arrows in (G-H) show representative TOM+ capillaries. (J) Laminin only view of scans in (H). (K) Representative segmented laminin+ BM of uninjured myofibers or residual BM of injured myofibers. (L) Cell diameter of GFP+ mononuclear myogenic cells via FACS of TA (n= 2-5 mice/DPI). (M) Cell volume determined using Fluorender on wholemount images of EDL (n=3-7 mice/DPI; n= 14-40 SCs/DPI). (N) Summed length of all cellular projections/cell, (O) average individual projection length, (P) distribution of SCs with 1-4 projections, and (Q) distribution of SCs with 1-6+ terminal ends of GFP+ SCs in uninjured or Galert (n=7 mice/DPI; n=36-42 cells/DPI). Representative SC with two projections (white arrows) and 5 terminal ends (yellow arrows). (R) Experimental design for labeling proliferative SCs. (S-T) Wholemount images of EdU+ GFP+ SCs at 1, 1.5, and 2 DPI (S), quantification of EdU+ GFP+ SCs (T), and representative GFP+ dividing SCs (U)(n=3-4 mice/DPI; n=547-2664 GFP+ SCs/DPI). (V-Y) Division angles of EdU+ GFP+ SCs 1-2 DPI. (V) Model of possible SC division angles; cell (a) represents planar division, cell (b) represents apical-basal division, and cell (c) represents typical cell observed in vivo. (W-Y) Quantification of SC division angles. Red dotted line indicates minimum X-Z division angle for designation of apical-basal division (n = 3-4 mice/DPI and 8-49 EDU+GFP+ SCs measured/DPI). Scale bars = 50um.
Figure 2.
Figure 2.. Regenerated myofibers form via a wave of density-dependent fusion 3.5-4.5 DPI followed by alignment of myonuclei by 5 DPI.
(A) Experimental design for labeling of SCs and their derivatives and wholemount images (B-H) of EDLs 2-5 DPI (n= ≥ 3 mice/DPI). (B) Representative segmented GFP+ myogenic cells or nascent myofibers. Individual cells pseudo-colored 2.5-3.0 DPI. (C) Superficial view of GFP+ myogenic cells regenerating myofibers, TOM+ uninjured myofibers with intact sarcomeres (white asterisks at 2.5 and 3.5 DPI), and TOM+ capillaries. (D) EdU labeling 4 H prior to harvest. At 2.5 and 3 DPI white lines show division angle of dividing myogenic cell. At 3 DPI white arrow shows damaged TOM+ myofiber being repaired by GFP+ myogenic cells. At 5 DPI only peripheral myonuclei are EdU+ (yellow asterisks) (E) Laminin outlines residual BM tubes and surrounds capillaries. Dotted white lines indicate level of cross-sections shown in (F). White arrows in (E-F) mark interstitial GFP myogenic cells residing outside BM tubes. (G) Laminin only of scans in (E). (H) Representative laminin+ BM tubes. Yellow arrows in (E, G, H) show a necked BM tube. (I) At 2 DPI GFP+ myogenic cells are confined to BM tubes where degrading myosin is absent. (J) At 3 DPI GFP+ myogenic cells expand around degrading myosin of damaged myofibers within BM tubes. (K) At 4 DPI sarcomeric myosin forms within GFP+ regenerated myofibers. (L) Diameter of laminin+ BM tubes of uninjured and injured myofibers 1-5 DPI (n=2-3 mice/DPI; n=4-6 laminin+ tubes/DPI; n=5 measurements/tube). (M) Comparison of wide and narrow diameters of necked laminin+ BM tubes at 2 DPI (n=3 mice; n=11 tubes). (N-O) Number of myonuclei per 100um length (N) or volume (O) of regenerating myofiber (n=3 mice/DPI; 3-8 myofibers/DPI). (P-R) Nascent GFP+ myofibers (experimental scheme, P) immunolabeled with myosin show formation of centralized chains is coincident with formation of organized sarcomeric myosin; representative progression from newly formed myofiber (1) to most mature myofiber (5). All images scale bars = 50um.
Figure 3.
Figure 3.. Myofibers enlarge by addition of peripheral nuclei, with centralized chains generated by 5 DPI persisting for months after regeneration.
(A) Experimental scheme for labeling SC-regenerated myofibers 7-21 DPI. (B-C) Wholemount images of EDLs 7, 14, and 21 DPI (n= ≥ 3 mice/DPI). (D) Diameter of uninjured and GFP+ regenerated myofibers (n=3-6 mice/DPI; n= 73-304 GFP+ myofibers/DPI; n= 3 measurements/myofiber). (E) Myonuclei/500 um length (n= 3 mice/DPI; n = 18 myofibers/DPI). Experimental scheme (F), wholemount images of EDLs from Pax7CreERT2/+;RosamTmG/+ or Pax7CreERT2/CreERT2;RosamTmG/+ mice (G-L), and quantification (M-N) of SC contribution when labeled at different DPI and assayed at 14 DPI (n=2-5 mice/DPI; n=50-214 myofibers/DPI). (O-T) GFP+ SCs contribute and fuse peripherally to nascent myofibers at 5 (green arrows, P-Q) and 7 DPI (S-T). (U-BB) SCs at 10 DPI contributing (green asterisks, V-X) or at 12 DPI contributed (yellow asterisks, AA-BB) peripheral EdU+ GFP+ myonuclei. A few EdU+ myonuclei are GFP− (red asterisk, X, AA), EdU+ non-myogenic nuclei (blue asterisks, V, AA), SCs with quiescent morphology (white arrows, X-Y, AA-BB) are present. (CC-HH) Chains of centralized myonuclei (white arrows, DD-EE and GG-HH) persist in regenerated myofibers 5 and 10 months post injury. (II-PP) Myofibers from EDLs 6 months post TAM +/− injury. TOM+ uninjured myofibers show only peripheral nuclei (II-KK). In GFP+ regenerated myofibers (LL-NN) 60% of myonuclei are centrally located (OO; n= 5 mice and n= 5 myofibers/mouse) and 98% of chains of myonuclei are surrounded by cytoplasm and centrally located (PP; n=5 mice and n=48-70 myofibers/mouse). Dotted white lines in (B, P, S, V, X, AA, DD, GG, JJ, MM) show level of cross-section in (C, Q, T, W, Y, BB, EE, HH, KK, NN). Images B-NN, scale bars = 50um.
Figure 4.
Figure 4.. Development of myofibers is distinct from regeneration; myogenesis begins in the absence of continuous BMs and myonuclei begin centralized and move peripherally.
(A-B) TA at E12.5 of Pax3Cre/+;RosamTmG/+ mice showing GFP+ forming myofibers with speckly laminin (white arrows). (C-D) TA at E14.5 of Pax7Cre/+;RosamTmG/+ mice showing areas of continuous laminin adjacent to GFP+ sarcolemma (white arrows show one myofiber with no laminin on left side, but laminin on right side). (E-N) Pax3Cre/+;RosanTnG/+ mice at E14.5 (E-I) or P0 (J-N) showing primary myofibers with single row of centralized nuclei (white arrows, E) or secondary myofibers with several rows of nuclei (yellow arrows, E). Myonuclei are peripheral by P0 (J-N). (H) and (M) are cross-sections of (E) and (J), respectively; location of cross-sections shown as white lines on (E) and (J). (F-G), (I), (K-L), and (N) are magnifications of (E), (H), (J), and (M), respectively. A-E, H, J, and M scale bars = 50um; F-G, I, K-L, and N scale bars = 5um.
Figure 5.
Figure 5.. Macrophages are essential to clear debris, enabling density-dependent myogenic cell fusion and preventing formation of branched myofibers.
(A) FACs quantification of macrophages and SCs during regeneration (n = 2-4 mice/DPI). (B) At 2.5 DPI CD68+ macrophages penetrated the BM tubes and reside adjacent to GFP+ myogenic cells (white arrows). (C) Experimental schemes for macrophage depletion. (D-F) At different DPIs and with early, late, or continuous clodrosome (or control encapsome) administration to TAs, quantification of macrophages via FACS (D), TA mass (E), or GFP+ mononuclear myogenic cells via FACS (F) (n= 2-7 mice/condition). (G-I) Macrophage depletion does not affect SC activation, but prevents normal BM shrinking. (n= 3 mice/condition; n=51-53 myofibers/condition) (J-O) At 4 DPI macrophage depletion leads to poorly fused GFP+ myogenic nascent myofibers (green arrows, J) with persistent TOM+ debris (red arrows, J) that are wider (J-K) (n=3 mice/condition; 65-83 myofibers/condition), within wider BM tubes (L-M) (n= 3 mice/condition; n=25-27 myofibers/condition). In controls most myofibers are GFP+ regenerated fibers with sarcomeric myosin (white arrows, N), while clodrosome treatment results in continued presence of necrotic fibers with disorganized myosin debris (yellow arrows, N) at 4 DPI (N-O, n = 3 mice/condition; 101-114 myofibers/condition). (P-U) At 7DPI early (P) or continuous (R) macrophage depletion causes aberrantly fused and branched myofibers (green arrows) with persistent TOM+ sarcolemma debris (red arrows), but such an effect is not seen with late clodrosome administration (Q). At 7 DPI branched or split myofibers pseudo colored in (S) and frequency of branching and loss of myofibers quantified in (T, U) (n=3-6 mice/condition; 197-655 myofibers/condition). (V-X) At 21DPI continuous clodrosome leads to more branched myofibers and fewer regenerated myofibers (n=5-6 mice/condition; n=387-646 myofibers/condition). Dotted white lines in G, J, P-R, X middle panel show level of cross-section in lower panel. Scale bars = 50um.
Figure 6.
Figure 6.. Residual BM tubes are critical for constraining SCs, promoting fusion, and aligning regenerating myofibers.
(A-F) Enzymatic degradation of the residual BM tubes (D-F) allows activated SCs to exit tubes (yellow arrows in E) as compared with control injury (A-C) in which SCs are sequestered in tubes at 2.5 DPI. After ficin treatment BM is quickly reestablished around capillaries (red arrow). (G-L) Myogenic cells fuse aberrantly (yellow asterisks) when BM tubes are disrupted (J-L) as compared with linear myofibers formed in the presence of BM tubes (G-I). Red arrow shows capillaries with reestablished BM. (M-T) Normally at 7 DPI linear myotubes with central chains have regenerated (M-O). After ficin treatment (P-T) myogenic cells continue to fuse aberrantly, resulting in dysmorphic (yellow asterisks) and branched myofibers (yellow arrow). Dysmorphic muscle begins to form new BM (white arrows, S-T). (U) Disruption of BM tubes leads to smaller muscles. N = 4-5 mice/timepoint. Images A, D, G, J, M, P scale bar = 50 um in J and P. Images B-C, E-F, H-I, K-L, N-O, Q-R scale bar = 50 um in K-L, Q-R. Images S-T scale bar = 50 um.
Figure 7.
Figure 7.. Model of cellular dynamics of regeneration.
1 DPI: Within residual BM, degradation of sarcolemma, macrophage entry and clearance of debris, and SC activation and proliferation. 2 DPI: Necking and shrinking of BM tube, within which macrophages clear debris and myogenic cells proliferate. 3 DPI: BM tube narrows and myogenic cells coalesce into columns. 4 DPI: BM tube narrowest and wave of density-dependent myocyte-myocyte fusion leads to myofibers with unaligned myonuclei. Some myogenic cells are found outside BM tubes. 5 DPI: Myofibers reestablished with myonuclei derived from myocyte-myocyte fusion positioned into centralized chains by forming sarcomeres. New BM forming as old one degrades. 10 DPI: Myofibers continue to enlarge via occasional myocyte-myofiber fusion events and addition of peripheral myonuclei. Quiescent SCs present in niche.

References

    1. Morrison SJ, and Kimble J (2006). Asymmetric and symmetric stem-cell divisions in development and cancer. Nature 441, 1068–1074. 10.1038/nature04956. - DOI - PubMed
    1. Dumont NA, Bentzinger CF, Sincennes MC, and Rudnicki MA (2015). Satellite Cells and Skeletal Muscle Regeneration. Compr Physiol 5, 1027–1059. 10.1002/cphy.c140068. - DOI - PubMed
    1. Relaix F, and Zammit PS (2012). Satellite cells are essential for skeletal muscle regeneration: the cell on the edge returns centre stage. Development 139, 2845–2856. 10.1242/dev.069088. - DOI - PubMed
    1. Hawke TJ, and Garry DJ (2001). Myogenic satellite cells: physiology to molecular biology. J Appl Physiol 91, 534–551. - PubMed
    1. Mauro A. (1961). Satellite cell of skeletal muscle fibers. J Biophys Biochem Cytol 9, 493–495. - PMC - PubMed

Publication types

LinkOut - more resources