. 2024 May 6;59(9):1110-1131.e22.
doi: 10.1016/j.devcel.2024.03.003. Epub 2024 Apr 2.

Lineage-tracing hematopoietic stem cell origins in vivo to efficiently make human HLF+ HOXA+ hematopoietic progenitors from pluripotent stem cells

Affiliations

Lineage-tracing hematopoietic stem cell origins in vivo to efficiently make human HLF+ HOXA+ hematopoietic progenitors from pluripotent stem cells

Jonas L Fowler et al. Dev Cell. .

Abstract

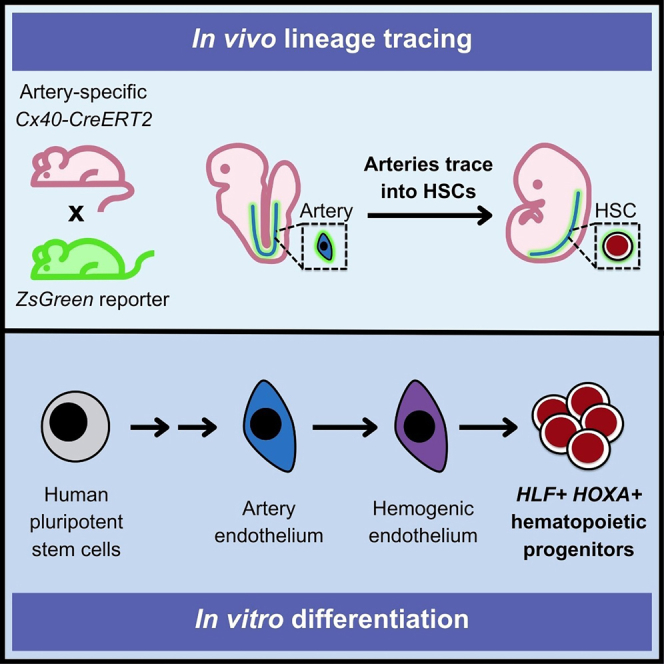
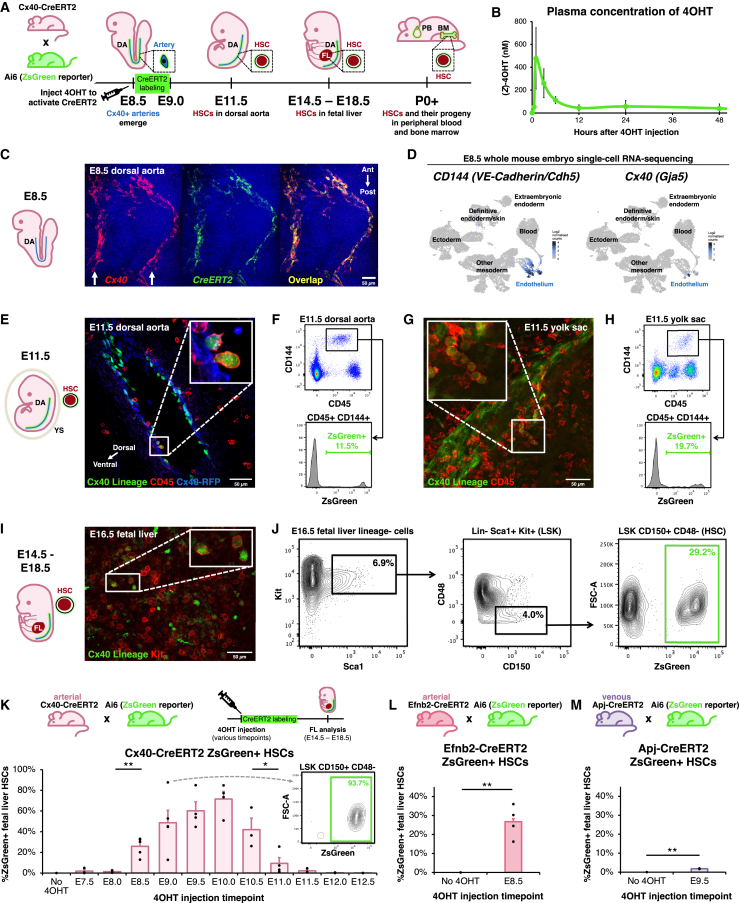
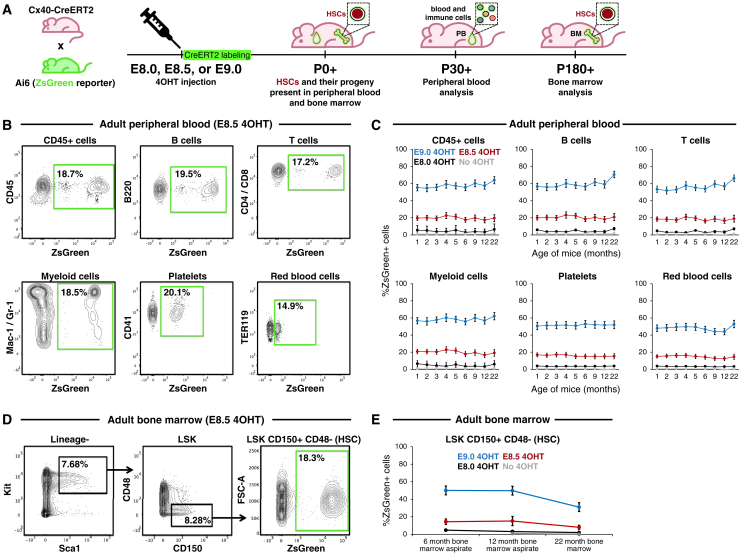
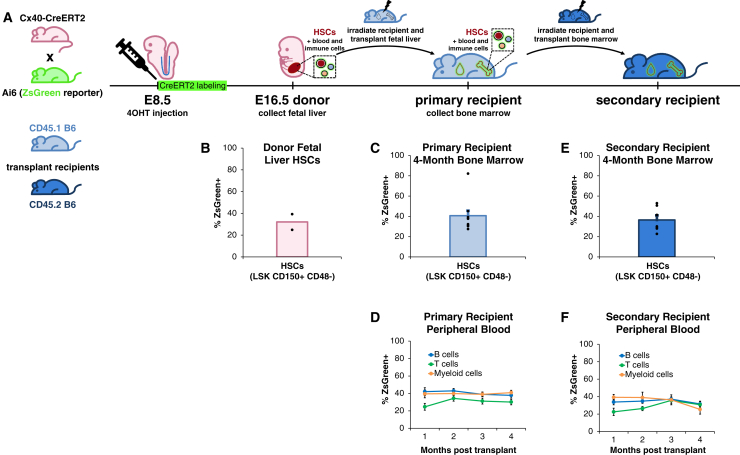
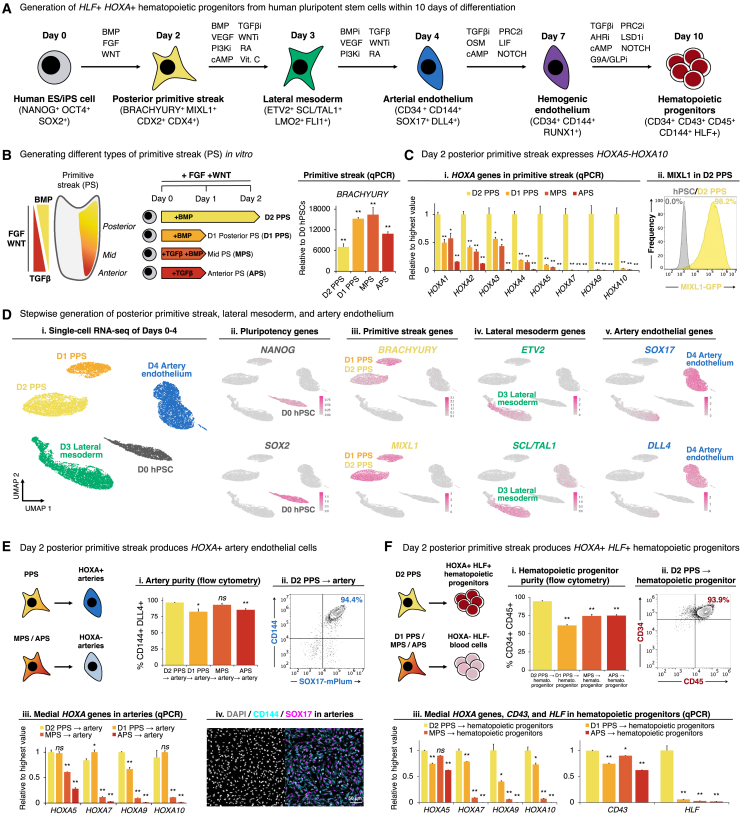
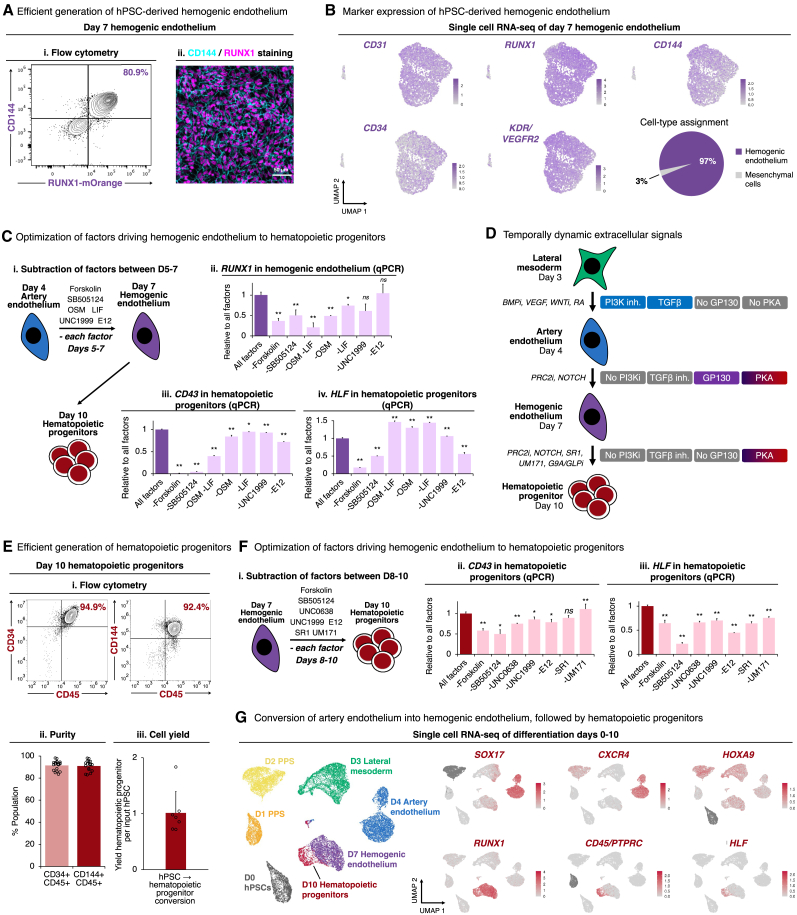
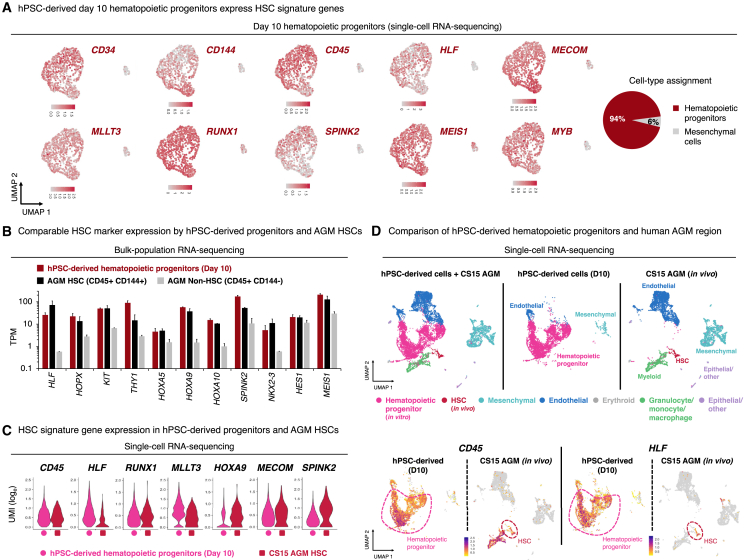
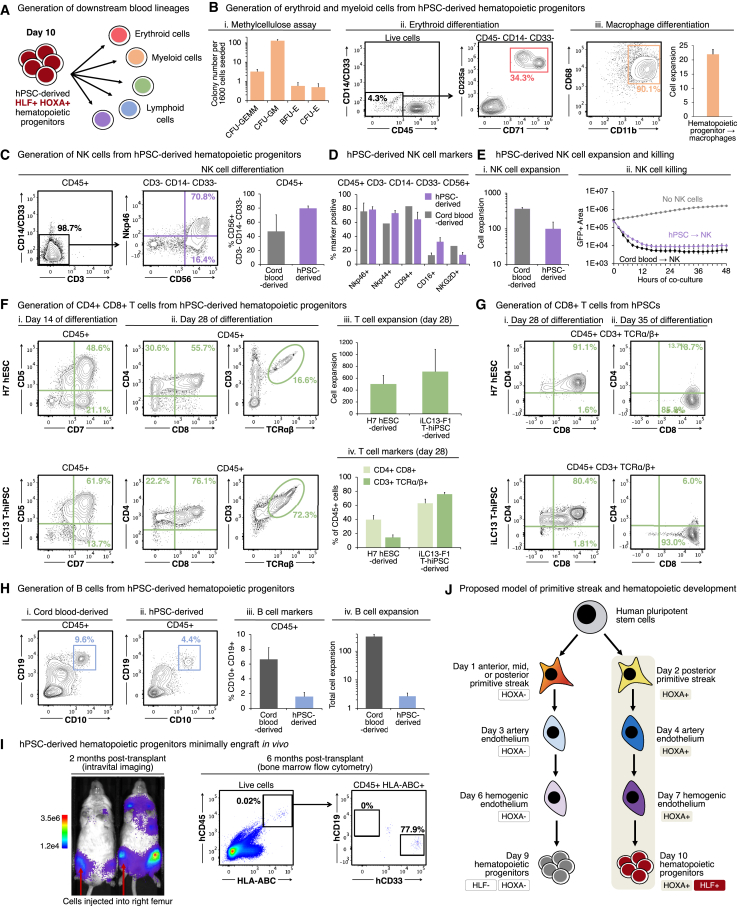
The developmental origin of blood-forming hematopoietic stem cells (HSCs) is a longstanding question. Here, our non-invasive genetic lineage tracing in mouse embryos pinpoints that artery endothelial cells generate HSCs. Arteries are transiently competent to generate HSCs for 2.5 days (∼E8.5-E11) but subsequently cease, delimiting a narrow time frame for HSC formation in vivo. Guided by the arterial origins of blood, we efficiently and rapidly differentiate human pluripotent stem cells (hPSCs) into posterior primitive streak, lateral mesoderm, artery endothelium, hemogenic endothelium, and >90% pure hematopoietic progenitors within 10 days. hPSC-derived hematopoietic progenitors generate T, B, NK, erythroid, and myeloid cells in vitro and, critically, express hallmark HSC transcription factors HLF and HOXA5-HOXA10, which were previously challenging to upregulate. We differentiated hPSCs into highly enriched HLF+ HOXA+ hematopoietic progenitors with near-stoichiometric efficiency by blocking formation of unwanted lineages at each differentiation step. hPSC-derived HLF+ HOXA+ hematopoietic progenitors could avail both basic research and cellular therapies.

Keywords: artery; developmental biology; hematopoietic stem cell; human pluripotent stem cell differentiation.


Conflict of interest statement

Declaration of interests Stanford University has filed patent applications related to blood and immune cell differentiation. J.L.F. is presently at Walking Fish Therapeutics, A.C. is presently at Orca Bio, and T.N. is presently at Century Therapeutics, but J.L.F., A.C., and T.N. contributed to this work while they were at Stanford University; none of these companies were involved in the present work.

Figures

None
Graphical abstract
Figure 1
Figure 1
Genetic lineage tracing reveals that artery endothelial cells generate HSCs in vivo (A) Experimental strategy. DA, dorsal aorta; FL, fetal liver; PB, peripheral blood; BM, bone marrow; E, embryonic day; P, postnatal day. (B) Mass spectrometry quantification of (Z)-4OHT levels in plasma of female adult Cx40-CreERT2 mice that intraperitoneally injected with (Z)-4OHT. (C) Cx40 and CreERT2 in situ staining of E8.5 Cx40-CreERT2 mouse embryos, using hybridization chain reaction v3.0 (HCR3). Arrows: paired dorsal aortae. Ant, anterior; post, posterior. (D) scRNA-seq of the entire E8.5 mouse embryo. (E–J) Arteries were lineage-traced in Cx40-CreERT2; Ai6 (ZsGreen reporter) embryos by administering 4OHT at E8.5. The Cx40-CreERT2 allele also encodes RFP, which was used to visualize Cx40+ cells. (E, G, and I) Immunostaining and (F, H, and J) flow cytometry of E11.5 dorsal aorta, E11.5 yolk sac, and E16.5 fetal liver was performed. (K) Arteries were lineage-traced in Cx40-CreERT2; Ai6 (ZsGreen reporter) embryos by administering a single 4OHT dose at the indicated times (E7.5–E12.5). Flow cytometry was performed to quantify artery-derived (i.e., ZsGreen+) HSCs in the E14.5–E18.5 fetal liver. Each dot: independent litter. For each time point, ≥8 independent embryos were analyzed. Inset: fetal liver HSCs labeled after E9.0 4OHT administration. (L) Arteries were lineage-traced in Efnb2-CreERT2; Ai6 (ZsGreen reporter) embryos by administering 4OHT at E8.5. Flow cytometry was performed to quantify ZsGreen+ E14.5–E18.5 fetal liver HSCs. (M) Veins and capillaries were lineage-traced in Apj-CreERT2; Ai6 (ZsGreen reporter) embryos by administering 4OHT at E9.5. Flow cytometry was performed to quantify ZsGreen+ E14.5–E18.5 fetal liver HSCs. Histograms depict the mean ± standard error of the mean (SEM). p < 0.05, ∗∗p < 0.01. Scale bars, 50 μm. Related to Figures S1 and S2 and Table S1.
Figure 2
Figure 2
Artery-derived HSCs are functional in vivo (A–E) Arteries were lineage-traced in Cx40-CreERT2; Ai6 (ZsGreen reporter) embryos by administering 4OHT at either E8.0, E8.5, or E9.0. After embryos developed into adults, flow cytometry was performed to quantify ZsGreen+ cells in (B) and (C) peripheral blood and (C) and (D) bone marrow HSCs in 1- to 22-month-old adult mice. Line graphs depict the mean ± SEM. Related to Figure S3.
Figure 3
Figure 3
Artery-derived HSCs are functional in vivo upon transplantation (A and B) Arteries were lineage-traced by administering 4OHT to E8.5 Cx40-CreERT2; Ai6 (ZsGreen reporter) embryos. B6, C57BL/6 mouse. (C and D) ZsGreen+ E16.5 fetal liver HSCs were (B) analyzed by flow cytometry and (C and D) transplanted into lethally irradiated primary recipient mice. 1–4 months post transplantation, flow cytometry was performed to quantify ZsGreen+ (C) peripheral blood cells and (D) bone marrow HSCs in primary recipients. (E and F) Bone marrow from primary recipient mice was transplanted into lethally irradiated secondary recipient mice. 1–4 months post transplantation, flow cytometry was performed to quantify ZsGreen+ (E) peripheral blood and (F) bone marrow HSCs in secondary recipients. Data depict the mean ± SEM. Each dot represents a single mouse. Related to Figure S4.
Figure 4
Figure 4
Differentiation of hPSCs into posterior primitive streak competent to subsequently generate HOXA+ artery ECs and HLF+ HOXA+ hematopoietic progenitors (A) Summary (this study). (B and C) qPCR of hPSCs differentiated into anterior primitive streak (day 1, “APS”), mid primitive streak (day 1, “MPS”), posterior primitive streak (day 1, “day-1 PPS”), or posterior primitive streak (day 2, “day-2 PPS”). (Cii) Flow cytometry of day-2 PPS generated from MIXL1-GFP hPSCs. (D) scRNA-seq of differentiated hPSCs. Colors in the left-most panel indicate differentiation day. (E and F) hPSCs were initially differentiated into APS, MPS, day-1 PPS, or day-2 PPS, and then further differentiated into (E) artery ECs or (F) hematopoietic progenitors, which were profiled by (Ei, Eii, Fi, and Fii) flow cytometry, (Eiii and Eiii) qPCR, and (Eiv and Fiv) immunostaining. Scale bars, 50 μm. Histograms depict the mean ± SEM. p < 0.05, ∗∗p <0.01, n.s., not significant. Related to Figure S5.
Figure 5
Figure 5
Differentiation of hPSCs into hemogenic ECs and subsequently HOXA+ HLF+ hematopoietic progenitors (A) Day-7 hemogenic ECs generated from (Ai) RUNX1-mOrange or (Aii) wild-type hPSCs, profiled by flow cytometry or immunostaining, respectively. Scale bars, 50 μm. (B) scRNA-seq of hPSC-derived day-7 hemogenic ECs. Entire population is shown, without preselecting cells. (C) Individual differentiation factors were withheld during differentiation of day-4 hPSC-derived artery ECs into hemogenic ECs over 3 days (Ci), followed by qPCR of day-7 hemogenic ECs (Cii) and day-10 hematopoietic progenitors derived from these hemogenic ECs (Ciii and Civ). (D) Summary (this study). (E) Flow cytometry (Ei and Eii) and absolute number/cell yield (Eiii) of day-10 hPSC-derived hematopoietic progenitors. Each dot: independent experiment. (F) Individual differentiation factors were withheld during differentiation of day-7 hPSC-derived hemogenic ECs into hematopoietic progenitors over 3 days, followed by qPCR of day-10 hematopoietic progenitors. (G) scRNA-seq of differentiated hPSCs. Colors in the left-most panel indicate differentiation day. Histograms depict the mean ± SEM. p < 0.05, ∗∗p < 0.01; n.s., not significant. Related to Figure S6.
Figure 6
Figure 6
hPSC-derived HLF+ HOXA+ hematopoietic progenitors express similar levels of hallmark HSC markers as human fetal dorsal aorta HSCs (A) scRNA-seq of day-10 hPSC-derived hematopoietic progenitors, showing gene expression (left) and clustering-based cell-type assignment (right). Entire population is shown, without preselecting cells. (B) Bulk-population RNA-seq comparison of day-10 hPSC-derived hematopoietic progenitors vs. CD45+ CD144+ HSCs vs. CD45+ CD144− non-HSCs from Carnegie stage 15/16 human embryo aorta-gonad-mesenephros (AGM) region. TPM, transcripts per million. (C and D) scRNA-seq of day-10 hPSC-derived hematopoietic progenitors, compared with (C) HSCs and (D) all cells originating from CS15 human embryo AGM. Histograms depict the mean ± SEM. Related to Figure S7.
Figure 7
Figure 7
hPSC-derived HLF+ HOXA+ hematopoietic progenitors generate lymphoid, myeloid, and erythroid cells in vitro (A) Summary (this study). (B) Day-10 hPSC-derived hematopoietic progenitors were differentiated into myeloerythroid cells (Bi), erythroid cells (Bii), or macrophages (Biii). Macrophage number/yield per input progenitor is also shown. (C–E) NK cells differentiated from day-10 hPSC-derived hematopoietic progenitors or cord blood CD34+ HSPCs. (C and D) Flow cytometry analysis, with subgating on indicated populations. (Ei) NK cell number/yield generated per input progenitor. (Eii) Live imaging of NK cells killing fluorescent OP9-DLL4-IRES-GFP cells. (F and G) T cells differentiated from wild-type H7 hESCs, iLC13-F1 T-hiPSCs, or cord blood CD34+ HSPCs. Flow cytometry analysis with pregating on indicated populations (e.g., CD45+), and T cell number/yield generated per input progenitor. (H) B cells differentiated from day 10 hPSC-derived hematopoietic progenitors or cord blood CD34+ HSPCs. (Hi–Hiii) Flow cytometry analysis and (Hiv) B cell number/yield generated per input progenitor. (I) H7 AkaLuciferase-expressing hPSC-derived day-10 hematopoietic progenitors were intrafemorally transplanted into NSG mice, followed by (Ii) bioluminescent imaging and (Iii) flow cytometry. (J) Developmental model (this study). Histograms depict the mean ± SEM. Related to Figure S7 and Video S1.

References

    1. Luo Q., Li H., Shan W., Wei C., Long Y., Cai S., Zeng X., Li X., Xu Y., Xu X., et al. Specific blood cells derived from pluripotent stem cells: an emerging field with great potential in clinical cell therapy. Stem Cells Int. 2021;2021 - PMC - PubMed
    1. Montel-Hagen A., Crooks G.M. From pluripotent stem cells to T cells. Exp. Hematol. 2019;71:24–31. - PubMed
    1. Xue D., Lu S., Zhang H., Zhang L., Dai Z., Kaufman D.S., Zhang J. Induced pluripotent stem cell-derived engineered T cells, natural killer cells, macrophages, and dendritic cells in immunotherapy. Trends Biotechnol. 2023;41:907–922. - PubMed
    1. Themeli M., Rivière I., Sadelain M. New cell sources for T cell engineering and adoptive immunotherapy. Cell Stem Cell. 2015;16:357–366. - PMC - PubMed
    1. Weissman I.L., Shizuru J.A. The origins of the identification and isolation of hematopoietic stem cells, and their capability to induce donor-specific transplantation tolerance and treat autoimmune diseases. Blood. 2008;112:3543–3553. - PMC - PubMed

Publication types

MeSH terms