Clinical Trial
. 2024 Jul 15;83(8):1018-1027.
doi: 10.1136/ard-2023-225445.

Type I interferon blockade with anifrolumab in patients with systemic lupus erythematosus modulates key immunopathological pathways in a gene expression and proteomic analysis of two phase 3 trials

Affiliations
Clinical Trial

Type I interferon blockade with anifrolumab in patients with systemic lupus erythematosus modulates key immunopathological pathways in a gene expression and proteomic analysis of two phase 3 trials

Tina Baker et al. Ann Rheum Dis. .

Abstract

Introduction: Anifrolumab is a type I interferon (IFN) receptor 1 (IFNAR1) blocking antibody approved for treating patients with systemic lupus erythematosus (SLE). Here, we investigated the immunomodulatory mechanisms of anifrolumab using longitudinal transcriptomic and proteomic analyses of the 52-week, randomised, phase 3 TULIP-1 and TULIP-2 trials.

Methods: Patients with moderate to severe SLE were enrolled in TULIP-1 and TULIP-2 and received intravenous anifrolumab or placebo alongside standard therapy. Whole-blood expression of 18 017 genes using genome-wide RNA sequencing (RNA-seq) (pooled TULIP; anifrolumab, n=244; placebo, n=258) and 184 plasma proteins using Olink and Simoa panels (TULIP-1; anifrolumab, n=124; placebo, n=132) were analysed. We compared treatment groups via gene set enrichment analysis using MetaBase pathway analysis, blood transcriptome modules, in silico deconvolution of RNA-seq and longitudinal linear mixed effect models for gene counts and protein levels.

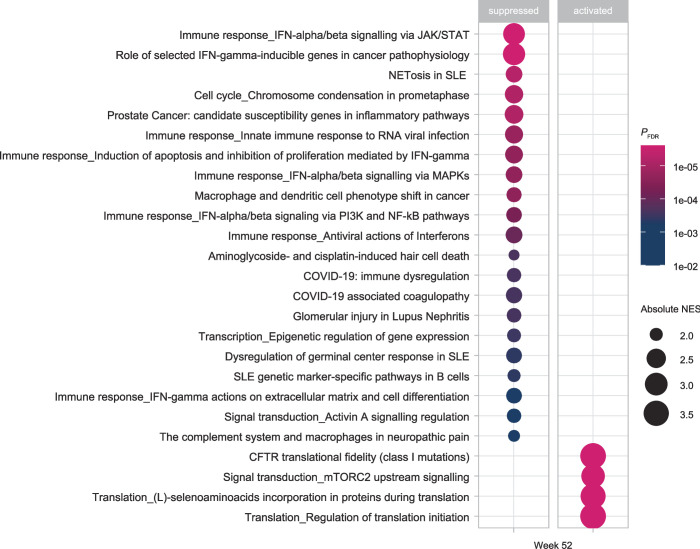
Results: Compared with placebo, anifrolumab modulated >2000 genes by week 24, with overlapping results at week 52, and 41 proteins by week 52. IFNAR1 blockade with anifrolumab downregulated multiple type I and II IFN-induced gene modules/pathways and type III IFN-λ protein levels, and impacted apoptosis-associated and neutrophil extracellular traps-(NET)osis-associated transcriptional pathways, innate cell activating chemokines and receptors, proinflammatory cytokines and B-cell activating cytokines. In silico deconvolution of RNA-seq data indicated an increase from baseline of mucosal-associated invariant and γδT cells and a decrease of monocytes following anifrolumab treatment.

Discussion: Type I IFN blockade with anifrolumab modulated multiple inflammatory pathways downstream of type I IFN signalling, including apoptotic, innate and adaptive mechanisms that play key roles in SLE immunopathogenesis.

Keywords: Autoimmune Diseases; Biological Therapy; Lupus Erythematosus, Systemic.


Conflict of interest statement

Competing interests: TB is an employee and stock holder of AstraZeneca; HS is an employee and stock holder of AstraZeneca; PJN was an employee of AstraZeneca at the time the study was being conducted and is an employee and stock holder of GSK; PGG is an employee and stock holder of AstraZeneca; MNL was an employee of AstraZeneca at the time the study was being conducted; MR was an employee and stock holder of AstraZeneca at the time the study was being conducted and is an employee and stock holder of GSK; WIW is an employee and stock holder of AstraZeneca; is applying for two patents (No. 17/999257; No. 18/556733); NF is an employee and stock holder of AstraZeneca; DM is an employee and stock holder of AstraZeneca; RT is an employee and stock holder of AstraZeneca; EFM received grants/contracts from AbbVie, Amgen, AstraZeneca, Biogen, BMS, Eli Lilly, EMD Serono, Genentech, GSK, Janssen, Novartis, Takeda and UCB; received consulting feed from AbbVie, AstraZeneca, Capella, Eli Lilly, EMD Serono, Galapagos, IGM, Novartis, Servier, Wolf, and Zenas; received payment/honoraria from AstraZeneca, BMS, GSK, and Roche; received support for meetings/travel from AstraZeneca and Roche; participated on Data Safety Monitoring/Advisory Boards of AstraZeneca, EMD Serono, Galapagos, Janssen, Novartis, and Takeda; is the Board Director of Rare Voices Australia and Exosome Biosciences Pty; RAF received grants/contracts, consulting fees, payment/honoraria, and support for attending meetings/travel from AstraZeneca and participated on a Data Safety Monitoring/Advisory Board of AstraZeneca; EMV received grants/contracts from AstraZeneca and Sandoz; consulting fees from AbbVie, AstraZeneca, CESAS, Elli Lilly, Novartis, Otsuka, Pfizer, Roche, UCB; payment/honoraria from AstraZeneca, Novastis and Otsuka; support for attending meetings/travel from Otsuka; participated on Data Safety Monitoring/Advisory Boards of Aurinia; is the General Secretary in SLEuro; CC is an employee and stock holder of AstraZeneca; AP is an employee and stockholder of AstraZeneca; HA-M was an employee and stock holder of AstraZeneca at the time the study was being conducted; PZB is an employee and stock holder of AstraZeneca; EC is an employee and stock holder of AstraZeneca.

Figures

Figure 1
Figure 1
Effects of anifrolumab treatment on gene regulation in TULIP-1 and TULIP-2. Linear mixed effect model (z-score) for the effect of anifrolumab versus placebo in TULIP-1 plotted against TULIP-2 at (A) week 24 and (B) week 52 and (C) in week 24 vs week 52 in the pooled TULIP-1 and TULIP-2.a Each gene (individual point) could be downregulated in both trials/time points with FDR-adjusted p≤0.05 (blue), upregulated in both trials/visits with FDR-adjusted p≤0.05 (red) or not significantly different between treatment arms (grey). (D) Volcano plot for the effect of anifrolumab versus placebo at weeks 24 (left) and 52 (right) in pooled TULIP-1 and TULIP-2 data. Negative log10 of nominal p value versus log2 fold change (FC) were calculated for each gene using a linear mixed effect model. Genes could be significantly upregulated (blue points right of vertical dash line, FDR-adjusted p<0.05 and log2 FC>0.5) or significantly downregulated (blue points left of vertical dash line, FDR-adjusted p<0.05 and log2 FC <−0.5) by anifrolumab 300 mg versus placebo, or not significantly different between anifrolumab 300 mg versus placebo groups (purple and grey points; FDR-adjusted p>0.05). For all panels, anifrolumab n=241 and placebo n=250. aDifferentially modulated genes in patients receiving anifrolumab versus placebo at week 24 or 52 can be found in online supplemental table S1. FC, fold change; FDR, false discovery rate; NS, not significant; SLE, systemic lupus erythematosus.
Figure 2
Figure 2
Pathway analysis for genes that were downregulated or upregulated by anifrolumab. The top 25 most significantly dysregulated pathways in patients receiving anifrolumab (n=241) vs placebo (n=250) at week 52 in pooled TULIP-1 and TULIP-2 data (PFDR≤0.001).a GSEA using the MetaBase pathway database was conducted on a list of genes ranked by the z-standard score calculated using a longitudinal linear mixed effect model. Each suppressed or activated pathway is represented by an individual point (larger size for greater absolute NES; lighter shade for greater significance of FDR-adjusted p value). aDifferentially regulated pathways in patients receiving anifrolumab versus placebo can be found in online supplemental table S2. FDR, false discovery rate; GSEA, gene set enrichment analysis; NES, normalised enrichment score; PFDR, FDR-adjusted p value; SLE, systemic lupus erythematosus.
Figure 3
Figure 3
Effect of anifrolumab on lymphocyte modules and peripheral blood lymphocyte count. (A) Gene set enrichment analysis of blood transcriptome modules at week 52 that were upregulated or downregulated by anifrolumab versus placebo, ordered by NES and categorised according to immune pathway (PFDR≤0.01).a (B) In-silico RNA-seq deconvolution for predicting cell type abundance performed by applying support vector regression; plotted for baseline, week 24 and week 52 for anifrolumab or placebo as mean estimated proportion ±95% CI, in reference to a signature matrix of 13 cell types from healthy individuals.b (C) Lymphocyte counts from a complete blood count assay, plotted as mean GI/L ±95% CI from baseline to week 52 for anifrolumab and placebo. For (A, B), anifrolumab n=241 and placebo n=250 .c aAnifrolumab 300 mg versus placebo on each blood transcriptome module can be found in online supplemental table S3. bIn-silico RNA-seq deconvolution data for all cell type predictions can be found in online supplemental table S4 and online supplemental figure S3. cLymphocyte counts for all time points can be found in online supplemental table S5. FDR, false discovery rate; MAIT, mucosal-associated invariant T; NES, normalised enrichment score; PFDR, FDR-adjusted p value.
Figure 4
Figure 4
Effect of anifrolumab treatment versus placebo on protein expression in the TULIP-1 trial. (A) Longitudinal linear mixed effect models comparing the 1-year trajectories of protein levels between patients receiving anifrolumab 300 mg versus placebo.a,b Proteins are ordered on the x-axis and coloured according to their FDR-adjusted p value. Mean log2 fold changes between the anifrolumab and placebo groups at week 52 were adjusted for baseline stratification factors. 41 of the 169 proteins tested had significantly different 1-year trajectories between anifrolumab and placebo (PFDR≤0.05). (B) Relative Normalised Protein eXpression (NPX) log2 scale (or pg/mL for IFN-λ) of the top 10 longitudinally impacted proteins on treatment with anifrolumab from baseline to week 52 (PFDR<0.00001).b For all panels, anifrolumab n=124 and placebo n=132. aProteins longitudinally modulated by anifrolumab 300 mg versus placebo can be found in online supplemental table S6. bRelative NPX of the top 10 longitudinally impacted proteins on treatment with anifrolumab from baseline to week 52 can be found in online supplemental table S7. CCL, chemokine (C-C motif) ligand; CXCL, chemokine (C-X-C motif) ligand; FC, fold change; FDR, false discovery rate; GNR, granulin precursor; IFNL, interferon-λ; IP, IFN-γ inducible protein; LAG, lymphocyte-activation gene; LGALS, galectin; LAMP, lysosomal associated membrane protein; MCP, Monocyte chemotactic protein; PFDR, FDR-adjusted p value; TRAIL-R, tumour necrosis factor-related apoptosis-inducing ligand-receptor; TNFRSF, TNF receptor superfamily.

References

    1. Caielli S, Wan Z, Pascual V. Systemic lupus erythematosus pathogenesis: interferon and beyond. Annu Rev Immunol 2023;41:533–60. 10.1146/annurev-immunol-101921-042422 - DOI - PubMed
    1. Gupta S, Kaplan MJ. Bite of the wolf: innate immune responses propagate autoimmunity in lupus. J Clin Invest 2021;131:e144918. 10.1172/JCI144918 - DOI - PMC - PubMed
    1. Ghodke-Puranik Y, Niewold TB. Genetics of the type I interferon pathway in systemic lupus erythematosus. Int J Clin Rheumatol 2013;8. 10.2217/ijr.13.58 - DOI - PMC - PubMed
    1. Brohawn PZ, Streicher K, Higgs BW, et al. . Type I interferon gene signature test-low and -high patients with systemic lupus erythematosus have distinct gene expression signatures. Lupus 2019;28:1524–33. 10.1177/0961203319885447 - DOI - PubMed
    1. Smith MA, Chiang C-C, Zerrouki K, et al. . Using the circulating proteome to assess type I interferon activity in systemic lupus erythematosus. Sci Rep 2020;10:4462. 10.1038/s41598-020-60563-9 - DOI - PMC - PubMed

Publication types