. 2024 May;300(5):107253.
doi: 10.1016/j.jbc.2024.107253. Epub 2024 Apr 1.

Homocysteine-induced sustained GluN2A NMDA receptor stimulation leads to mitochondrial ROS generation and neurotoxicity

Affiliations

Homocysteine-induced sustained GluN2A NMDA receptor stimulation leads to mitochondrial ROS generation and neurotoxicity

Satya Narayan Deep et al. J Biol Chem. 2024 May.

Abstract

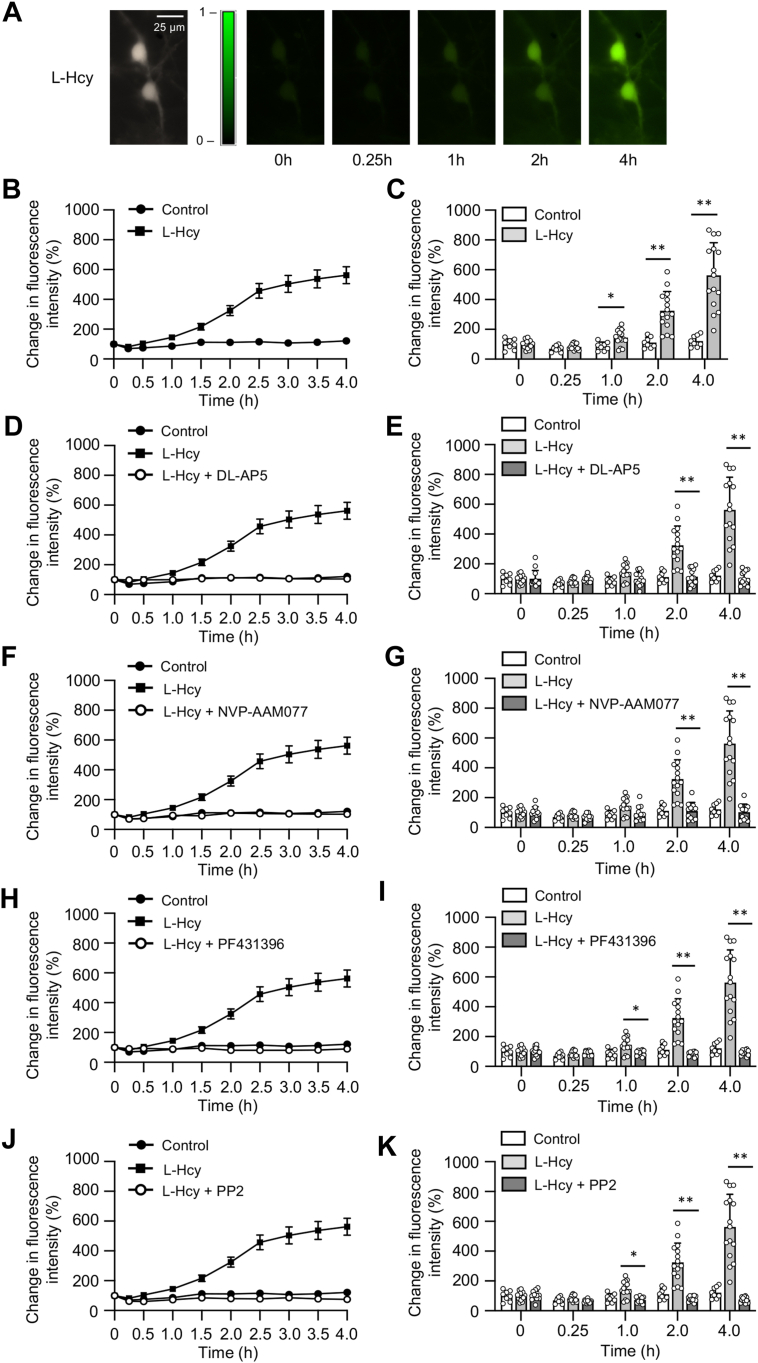
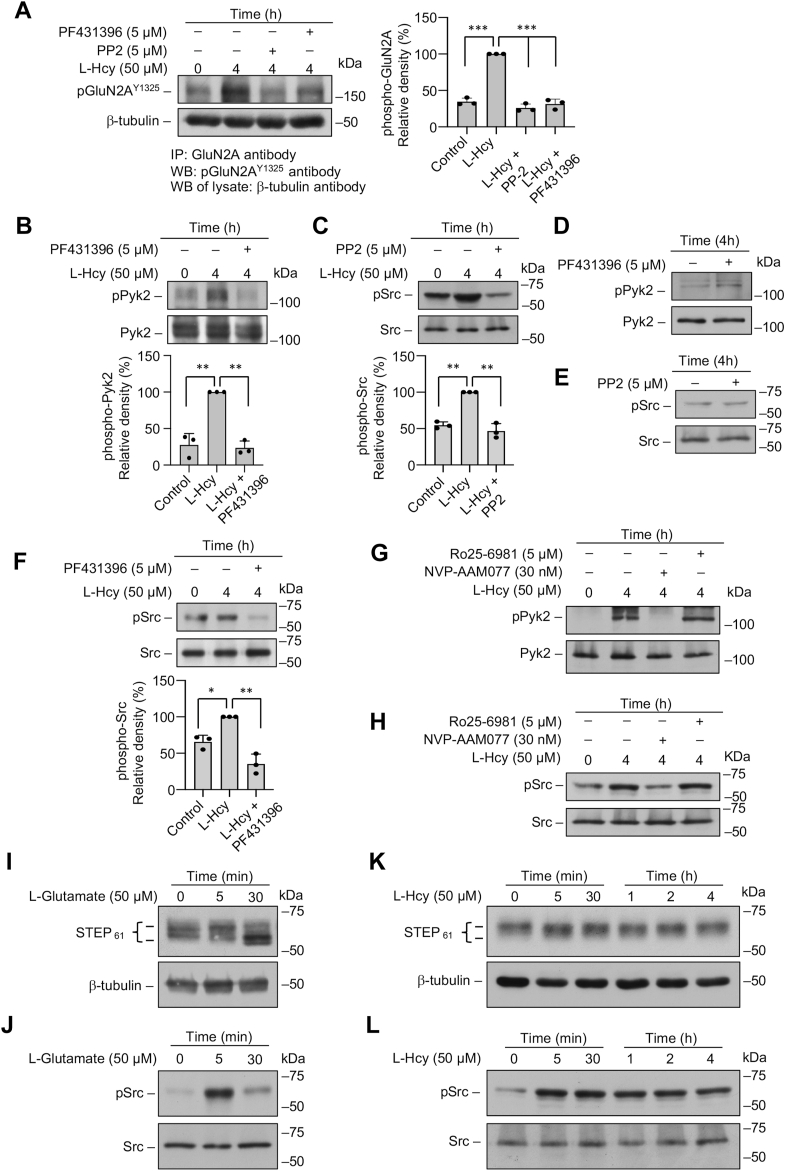
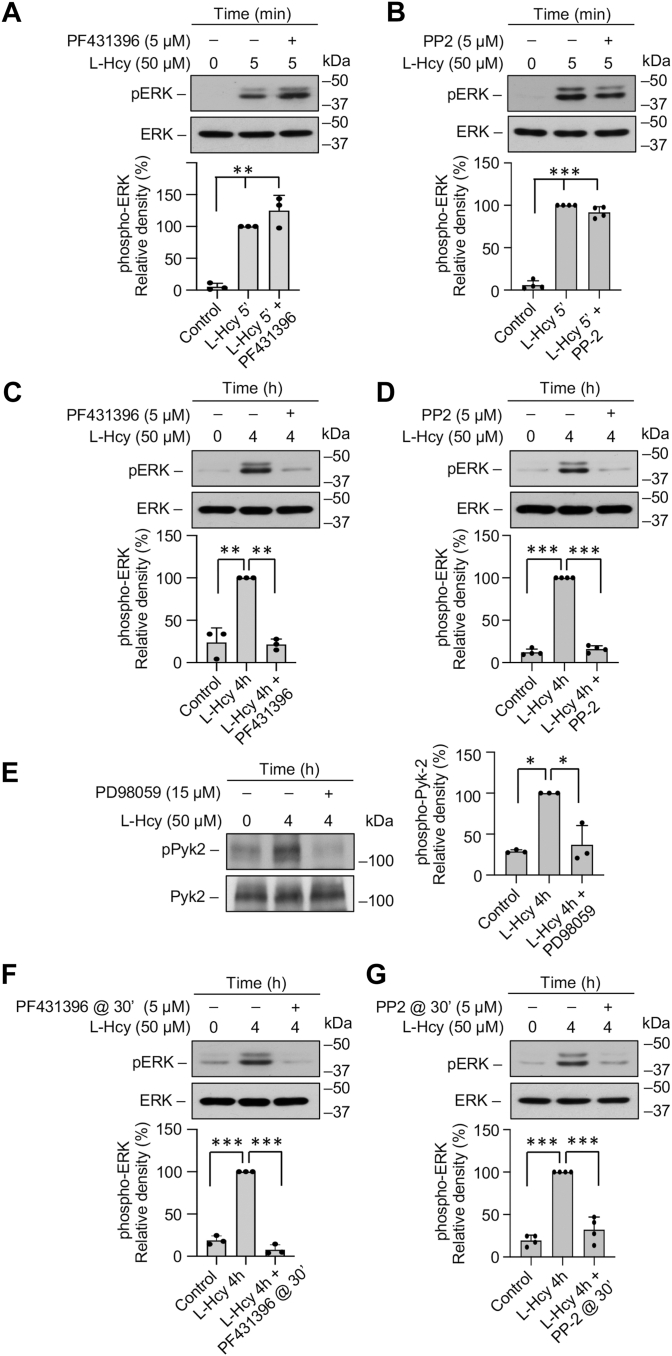
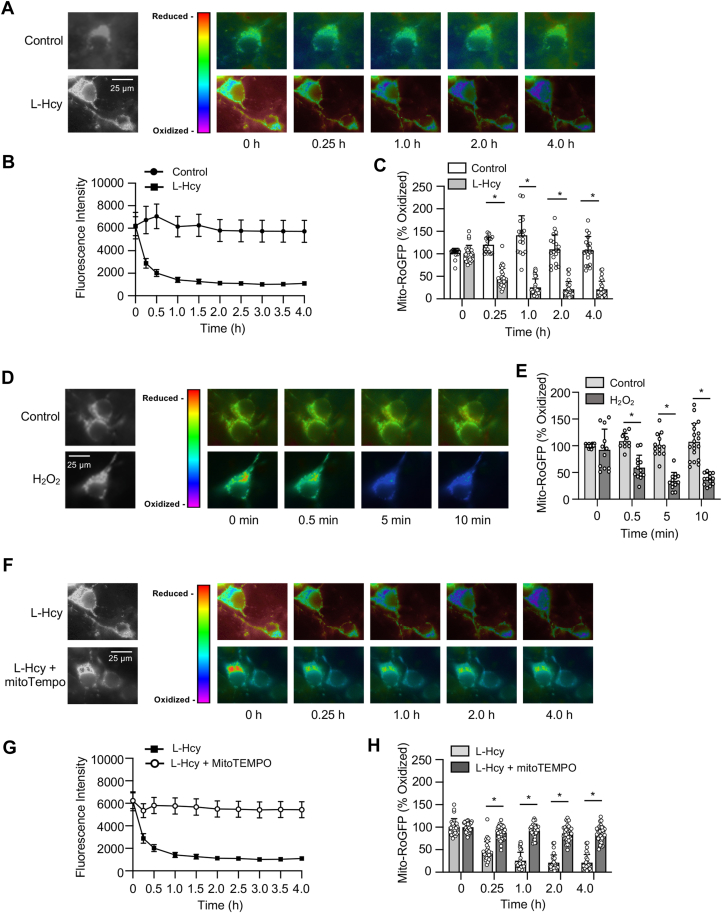
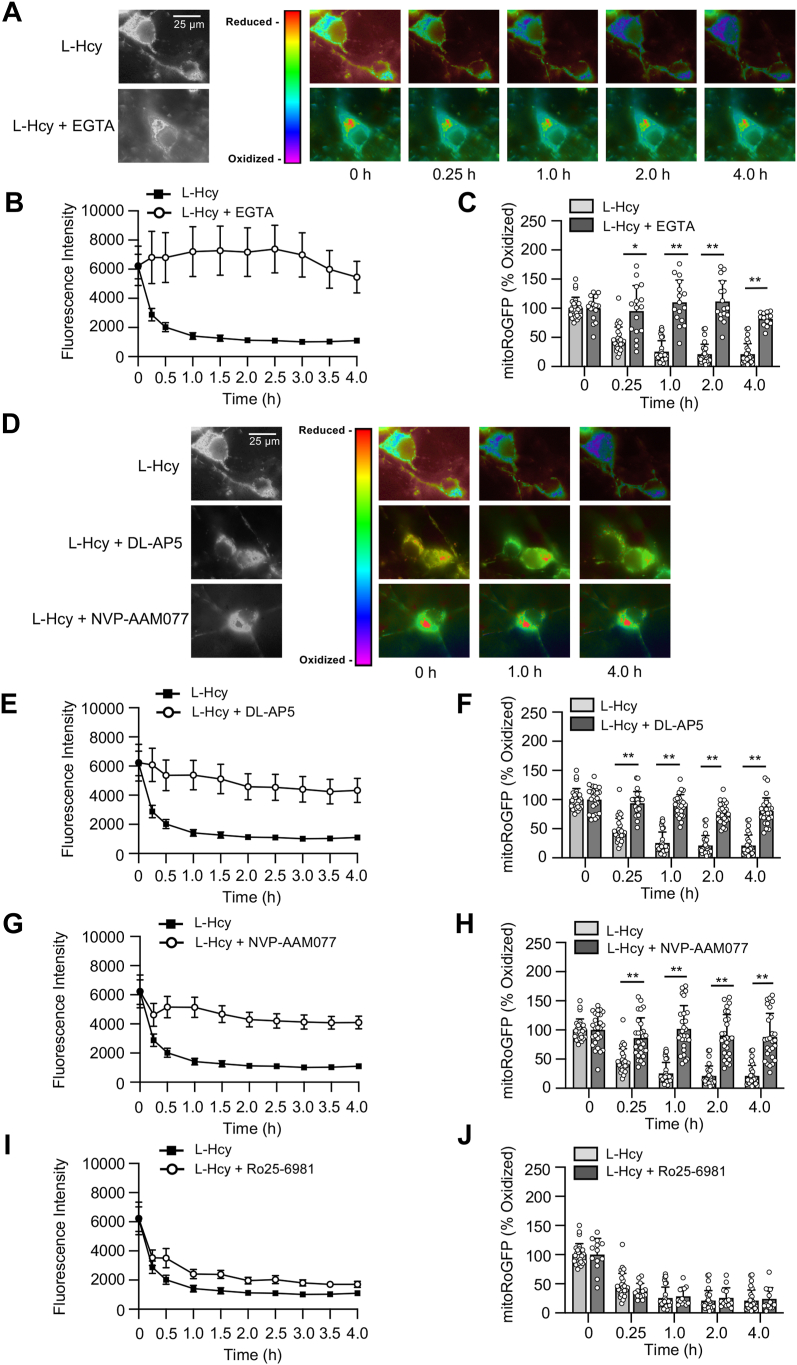
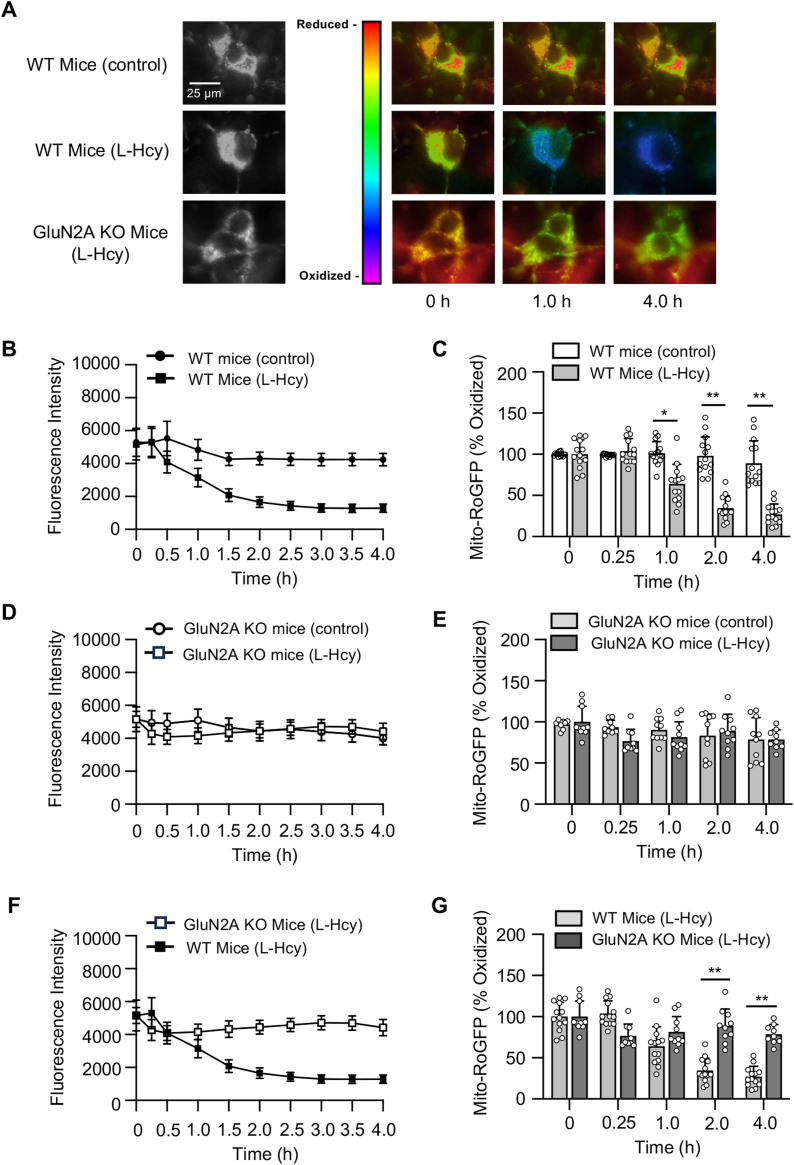
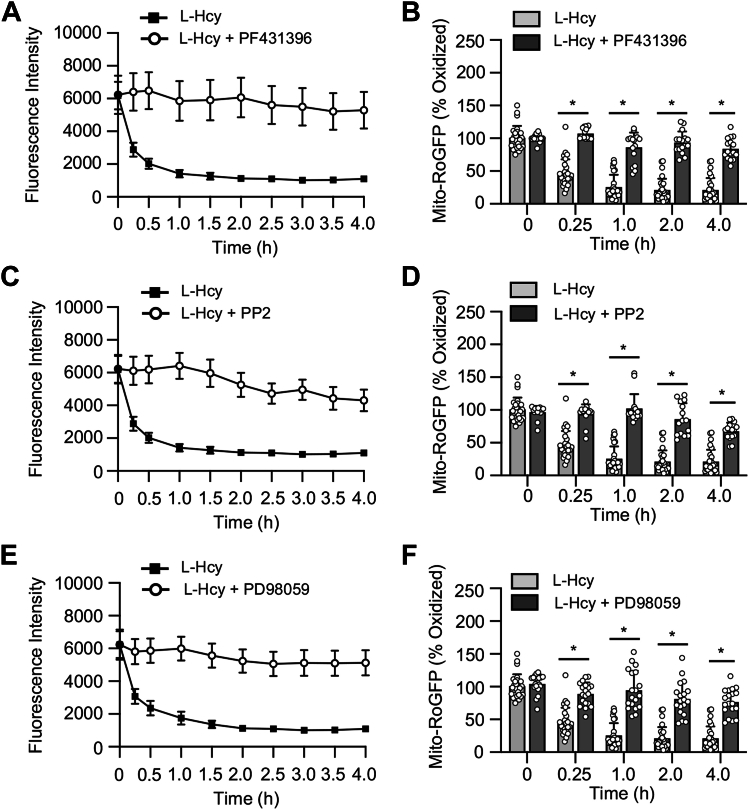
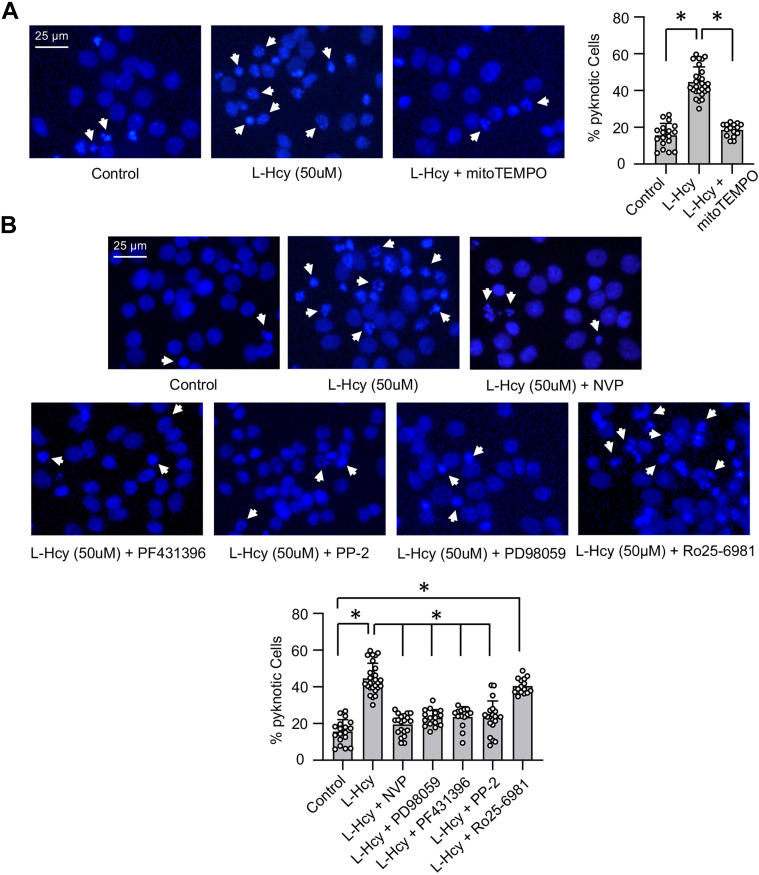
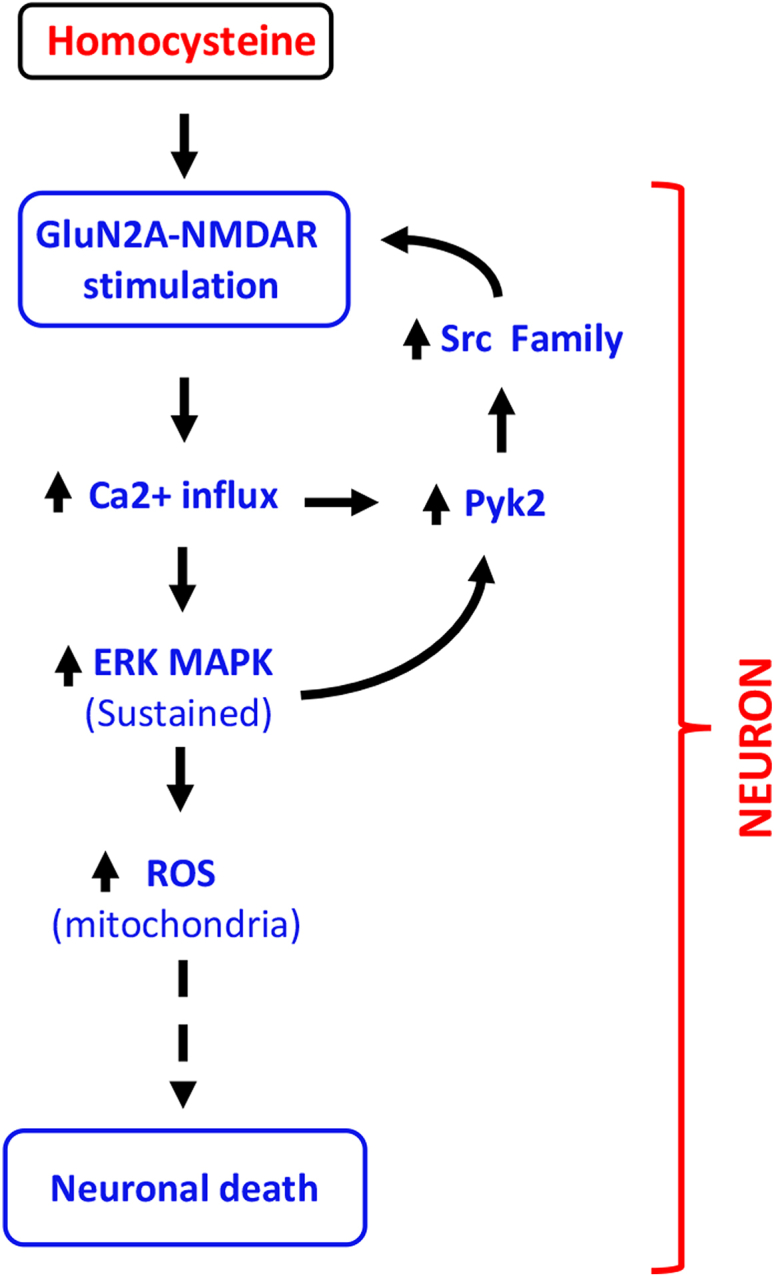
Homocysteine, a sulfur-containing amino acid derived from methionine metabolism, is a known agonist of N-methyl-D-aspartate receptor (NMDAR) and is involved in neurotoxicity. Our previous findings showed that neuronal exposure to elevated homocysteine levels leads to sustained low-level increase in intracellular Ca2+, which is dependent on GluN2A subunit-containing NMDAR (GluN2A-NMDAR) stimulation. These studies further showed a role of ERK MAPK in homocysteine-GluN2A-NMDAR-mediated neuronal death. However, the intracellular mechanisms associated with such sustained GluN2A-NMDAR stimulation and subsequent Ca2+ influx have remained unexplored. Using live-cell imaging with Fluo3-AM and biochemical approaches, we show that homocysteine-GluN2A NMDAR-induced initial Ca2+ influx triggers sequential phosphorylation and subsequent activation of the proline rich tyrosine kinase 2 (Pyk2) and Src family kinases, which in turn phosphorylates GluN2A-Tyr1325 residue of GluN2A-NMDARs to maintain channel activity. The continuity of this cycle of events leads to sustained Ca2+ influx through GluN2A-NMDAR. Our findings also show that lack of activation of the regulatory tyrosine phosphatase STEP, which can limit Pyk2 and Src family kinase activity further contributes to the maintenance of this cycle. Additional studies using live-cell imaging of neurons expressing a redox-sensitive GFP targeted to the mitochondrial matrix show that treatment with homocysteine leads to a progressive increase in mitochondrial reactive oxygen species generation, which is dependent on GluN2A-NMDAR-mediated sustained ERK MAPK activation. This later finding demonstrates a novel role of GluN2A-NMDAR in homocysteine-induced mitochondrial ROS generation and highlights the role of ERK MAPK as the intermediary signaling pathway between GluN2A-NMDAR stimulation and mitochondrial reactive oxygen species generation.

Keywords: Ca(2+) influx; ERK MAPK; GluN2A-NMDA receptor; Pyk2; Src family kinase; homocysteine; mitochondrial reactive oxygen species; neurotoxicity.


Conflict of interest statement

Conflict of interest The authors declare that they have no conflicts of interest with the contents of this article.

Figures

Figure 1
Figure 1
Role of Pyk2 and SFK in homocysteine-induced changes in intracellular Ca2+in neurons.A, representative micrographs of Fluo3-AM loaded neurons showing changes in intracellular Ca2+ over time measured at 484 nm, following exposure to L-homocysteine (50 μM). Both black and white (4 h) and false-color images (0–4 h) are shown. B, temporal profile of intracellular Ca2+ increase over time was assessed by measuring increase in Fluo3-AM fluorescence intensity (mean ± SE) in soma of L-Hcy–treated and L-Hcy–untreated (control) neurons. C, individual responses in neuronal soma showing the range of increase in intracellular Ca2+ at specific time points, following exposure to L-Hcy, expressed as mean ± SD. Two-way ANOVA followed by Bonferroni’s multiple-comparisons test shows significant effect (treatment effect: F (1, 21) = 33.42; p < 0.0001, time effect: F (1.629, 34.21) = 32.49; p < 0.0001, interaction: F (4, 84) = 23.09; p < 0.0001). D, F, H, and J, temporal profile of changes in intracellular Ca2+ in neurons treated with L-Hcy (50 μM) in the presence or absence of (D) NMDAR inhibitor DL-AP5 (200 μM); (F) GluN2A-NMDAR inhibitor NVP-AAM077 (30 nM); (H) Pyk2 inhibitor PF431396 (5 μM); or (J) SFK inhibitor PP2 (5 μM) expressed as mean ± SE. E, G, I, and K, quantitative analysis of individual response in neuronal soma showing the range of increase in intracellular Ca2+ at the specified time points, following treatment with L-Hcy and in the presence or absence of pharmacological inhibitors expressed as mean ± SD. Two-way ANOVA followed by Bonferroni’s multiple-comparisons test shows significant effect of treatment, time, and interaction in the presence of (E) NMDAR inhibitor DL-AP5 (treatment effect: F (2, 33) = 36.83; p < 0.0001, time effect: F (1.803, 59.50) = 33.62; p < 0.0001, interaction: F (8, 132) = 29.75; p < 0.0001), (G) GluN2A-NMDAR inhibitor NVP-AAM077 (treatment effect: F (2, 31) = 33.16; p < 0.0001, time effect: F (1.701, 52.74) = 33.69; p < 0.0001, interaction: F (8, 124) = 27.59; p < 0.0001), (I) Pyk2 inhibitor PF431396 (treatment effect: F (2, 32) = 43.50; p < 0.0001, time effect: F (1.662, 53.18) = 32.93; p < 0.0001, interaction: F (8, 128) = 32.33; p < 0.0001), and (K) SFK inhibitor PP2 (treatment effect: F (2, 32) = 47.81; p < 0.0001, time effect: F (1.663, 53.21) = 33.83; p < 0.0001, interaction: F (8, 128) = 32.13; p < 0.0001). Post hoc analysis shows ∗p < 0.01 and ∗∗p < 0.0001 between the treatment groups at the given time points. Values are mean ± SD. Data points represent individual biological replicates. NMDAR, N-methyl-D-aspartate subtype of glutamate receptor; SFK, Src family kinase.
Figure 2
Figure 2
Homocysteine mediated increase in Pyk2 and SFK phosphorylation leads to GluN2A-NMDAR phosphorylation in neurons.AF, rat neuron cultures were treated with 50 μM L-homocysteine (L-Hcy, 4 h) in the presence and absence of Pyk2 inhibitor PF431396 (5 μM) or SFK inhibitor PP2 (5 μM). A, GluN2A-subunit of NMDAR was immunoprecipitated from total cell lysate using anti-GluN2A antibody, and the immune complexes were processed for immunoblot analysis using anti-pGluN2AY1325 antibody (upper panel). Total cell lysates were immunoblotted with anti-β-tubulin antibody to ensure equal input protein for immunoprecipitation (lower panel). One-way ANOVA revealed significant main effect of treatment (F (3, 8) = 146.3; p < 0.0001). BF, total cell lysates were processed for immunoblot analysis using (B and D) anti-phospho-Pyk2 Y402 (pPyk2) and anti-Pyk2 antibodies or (C, E, and F) anti-phospho-Src Y416 (pSrc) and anti-Src antibodies. B, C, and F, one-way ANOVA revealed significant main effect of treatment in the presence of (B) Pyk2 inhibitor: F (2, 6) = 50.27; p = 0.0002, (C) SFK inhibitor: F (2, 6) = 59.18; p = 0.0001, and (F) Pyk2 inhibitor: F (2, 6) = 34.94; p = 0.0005. G and H, rat neuron cultures were treated with 50 μM L-Hcy (4 h) in the presence and absence of GluN2A-NMDAR inhibitor NVP-AAM077 (30 nM) or GluN2B-NMDAR inhibitor Ro25-6981 (5 μM). Total cell lysates were processed for immunoblot analysis using (G) anti-pPyk2 and anti-Pyk2 antibodies or (H) anti-pSrc and anti-Src antibodies. IL, rat neuron cultures were treated with either (I and J) 50 μM L-Glutamate (0 min, 5 min, and 30 min) or (K and L) 50 μM L-Hcy (0 min, 5 min, 0.5 h, 1 h, 2 h, and 4 h). Total cell lysates were processed for immunoblot analysis using (I and K) anti-STEP and anti-tubulin antibodies or (J and L) anti-pSrc and anti-Src antibodies. A, B, C, and E, post hoc analysis by Bonferroni’s multiple-comparisons test shows ∗p < 0.01, ∗∗p < 0.001, and ∗∗∗p < 0.001 between the treatment groups. Values are mean ± SD. Data points represent individual biological replicates. NMDAR, N-methyl-D-aspartate subtype of glutamate receptor; SFK, Src family kinase.
Figure 3
Figure 3
Homocysteine-induced delayed phosphorylation of ERK MAPK is dependent on Pyk2 and SFK activation.AG, rat neuron cultures were treated with 50 μM of L-homocysteine (L-Hcy) for (A and B) 5 min or (CG) 4 h. L-Hcy treatment was carried out in the presence or absence of (A and C) Pyk2 inhibitor PF431396 (5 μM); (B and D) SFK inhibitor PP2 (5 μM); or (E) ERK MAPK inhibitor PD98059 (10 μM). In some experiments (F), Pyk2 inhibitor PF431396 or (G) SFK inhibitor PP2 was added 30 min after the onset of L-Hcy treatment. Immunoblot analysis was performed using (A, B, C, D, F, and G) anti-p-ERK and p-ERK antibodies or (E) anti-pPyk2 and anti-Pyk2 antibodies. One-way ANOVA revealed significant main effect of treatment in the presence of (A) Pyk2 inhibitor: F (2, 6) = 58.46; p = 0.0001 (B) SFK inhibitor: F (2, 9) = 471.2; p < 0.0001, (C) Pyk2 inhibitor: F (2, 6) = 54.12; p = 0.0001, (D) SFK inhibitor: F (2, 9) = 1038; p < 0.0001, (E) ERK MAPK inhibitor: F (2, 6) = 24.69; p = 0.0013, (F) Pyk2 inhibitor: F (2, 6) = 376.0; p < 0.0001, and (G) SFK inhibitor: F (2, 9) = 86.79; p < 0.0001. Post hoc analysis by Bonferroni’s multiple-comparisons test shows ∗p < 0.01, ∗∗p < 0.001, and ∗∗∗p < 0.0001 between the treatment groups. Values are mean ± SD. Data points represent individual biological replicates. SFK, Src family kinase.
Figure 4
Figure 4
Homocysteine leads to progressive increase in mitochondrial ROS generation.AE, rat neuronal cultures expressing mito-RoGFP were treated with 50 μM of L-homocysteine (L-Hcy, 4 h) or 50 μM H2O2 (10 min), and loss of fluorescence signal was recorded (excitation 484 nm) at the specified times. A and D, representative photomicrographs (black and white, and false-color images) showing temporal loss of fluorescence signal of mito-RoGFP with (A) L-Hcy or (D) H2O2 treatment indicating generation of mitochondrial ROS. The representative photomicrographs displaying changes in fluorescence intensity of mito-RoGFP following L-Hcy treatment in Figure 4A has also been incorporated in (F), and Figure 5, A and D (as a positive control) for side-by-side visual comparison of the effects of pharmacological inhibitors on L-Hcy–induced changes in fluorescence intensity of mito-RoGFP. B, temporal changes in fluorescence intensity (arbitrary units) in control and L-Hcy–treated neurons-expressing mito-RoGFP (mean ± SE). C and E, quantitative analysis of the percentage decrease in fluorescence intensity of oxidized mito-RoGFP signal in individual cells following L-Hcy or H2O2 treatment compared to untreated control cells expressed as mean ± SD. Two-way ANOVA followed by Bonferroni’s multiple-comparisons test shows significant effect of treatment, time, and interaction in the presence L-Hcy (treatment effect: F (1, 44) = 192.2; p < 0.0001, time effect: F (1.891, 81.32) = 34.38; p < 0.0001, interaction: F (4, 172) = 66.21; p < 0.0001), and H2O2 (treatment effect: F (1, 30) = 77.37; p < 0.0001, time effect: F (3, 74) = 10.69; p < 0.0001, interaction: F (3, 74) = 15.09; p < 0.0001). FH, neurons-expressing mito-RoGFP were treated with 50 μM of L-Hcy in the presence or absence of mitoTEMPO (5 μM) for 4 h. F, representative photomicrographs (black and white, and false-color images) showing temporal changes in fluorescence intensity of mito-RoGFP. G, temporal changes in mito-RoGFP fluorescence intensity (arbitrary units) over time and (H) quantitative analysis of percentage increase in reduced mito-RoGFP signal at the specified time points. Two-way ANOVA followed by Bonferroni’s multiple-comparisons test shows significant effect of treatment, time, and interaction (Treatment effect: F (1, 62) = 244.4; p < 0.0001, Time effect: F (1.826, 113.2) = 144.7; p < 0.0001, Interaction: F (4, 248) = 77.31; p < 0.0001). Post hoc analysis shows ∗p < 0.0001 between the treatment groups at the given time point. Data points represent individual biological replicates. ROS, reactive oxygen species; SFK, Src family kinase.
Figure 5
Figure 5
Homocysteine-induced mitochondrial ROS generation is dependent on GluN2A-NMDAR.AJ, rat neuronal cultures expressing mito-RoGFP were treated with 50 μM of L-homocysteine (L-Hcy, 4 h) in the presence or absence of (AC) EGTA (2.5 μM), (DF) DL-AP5 (200 μM), (D, G, and H) NVP-AAM077 (30 nM), or (I and J) Ro25-6951 (5 μM). A and D, representative photomicrographs (black and white, and false-color images) showing temporal changes in fluorescence intensity of mito-RoGFP. B, E, and G, temporal changes in mito-RoGFP fluorescence intensity (arbitrary units) over time in the presence of (B) EGTA, (E) DL-APV, and (G) NVP-AAM077 expressed as mean ± SE. C, F, and H, quantitative analysis (two-way ANOVA followed by Bonferroni’s multiple-comparisons test) of the percentage increase in fluorescence intensity of reduced mito-RoGFP signal in the presence of (C) EGTA, (F) DL-APV, and (H) NVP-AAM077 expressed as mean ± SD. Data shows significant effect of treatment, time, and interaction in the presence EGTA (treatment effect: F (1, 41) = 125.8; p < 0.0001, time effect: F (2.026, 81.54) = 26.76; p < 0.0001, interaction: F (4, 161) = 30.22; p < 0.0001), DL-APV (treatment effect: F (1, 51) = 179.7; p < 0.0001, time effect: F (2.033, 102.2) = 81.99; p < 0.0001, interaction: F (4, 201) = 31.93; p < 0.0001) and NVP-AAM077 (treatment effect: F (1, 52) = 87.34; p < 0.0001, time effect: F (1.518, 78.93) = 34.10; p < 0.0001, interaction: F (4, 208) = 24.11; p < 0.0001). I, temporal profile of changes in mito-RoGFP fluorescence intensity (arbitrary units) in the presence of Ro25-6951 expressed as mean ± SE and (J) quantitative analysis of percentage change in fluorescence intensity of oxidized mito-RoGFP signal at the given time points does not show significant effect of treatment and interaction in the presence Ro25-6981(treatment effect: F (1, 38) = 0.0008; p = 0.9775, Time effect: F (1.604, 60.96) = 158.1; p < 0.0001, interaction: F (4, 152) = 1.09; p = 0.3593). Post hoc analysis shows ∗p < 0.01 and ∗∗p < 0.0001 between the treatment groups at the given time point. Data points represent individual biological replicates. Mito-RoGFP, mitochondria-targeted redox-sensitive GFP; NMDAR, N-methyl-D-aspartate subtype of glutamate receptor; ROS, reactive oxygen species.
Figure 6
Figure 6
Knockdown of GluN2A subunit blocks homocysteine-induced mitochondrial ROS generation.AG, neuronal cultures from WT and GluN2A KO mice–expressing mito-RoGFP were treated with or without 50 μM of L-homocysteine (L-Hcy, 4 h) and changes in fluorescence signal of mito-RoGFP was recorded at the specified time points. A, representative photomicrographs (black and white, and false-color images) showing temporal changes in fluorescence intensity of mito-RoGFP. B, D, and F, temporal profile of changes in mito-RoGFP fluorescence intensity (arbitrary units) over time in (B) WT control and L-Hcy–treated WT neurons, (D) GluN2A-KO control and L-Hcy–treated GluN2A-KO neurons, and (F) L-Hcy–treated WT and L-Hcy–treated GluN2A KO neurons expressed as mean ± SE. C, E, and G, quantitative analysis of the percentage change in fluorescence intensity of oxidized mito-RoGFP signal at the given time points in (C) L-Hcy–treated WT neurons compared to vehicle-treated WT neurons (control), (E) L-Hcy–treated GluN2A-KO neurons compared to vehicle-treated GluN2A-KO neurons (control), and (G) L-Hcy–treated WT neurons compared to L-Hcy–treated GluN2A KO neurons (control) expressed as mean ± SD. Two-way ANOVA followed by Bonferroni’s multiple-comparisons test shows significant effect of treatment, time, and interaction in (C) treatment effect: (F (1, 25) = 51.48; p < 0.0001), time effect: (F (2.744, 68.61) = 50.05; p < 0.0001), interaction: (F (4, 100) = 35.31; p < 0.0001) and (G) treatment effect: (F (1, 21) = 18.05; p = 0.0004), time effect: (F (2.924, 59.94) = 35.68; p < 0.0001), interaction: (F (4, 82) = 28.32; p < 0.0001). E, two-way ANOVA followed by Bonferroni’s multiple-comparisons test does not show significant effect of treatment and interaction (treatment effect: F (1, 18) = 0.498; p = 0.4894, time effect: F (4, 69) = 4.946; p = 0.0015, interaction: F (4, 69) = 2.412; p = 0.0572). Post hoc analysis shows ∗p < 0.001 and ∗∗p < 0.0001 between the treatment groups at the given time point. Data points represent individual biological replicates. Mito-RoGFP, mitochondria-targeted redox-sensitive GFP; ROS, reactive oxygen species.
Figure 7
Figure 7
Homocysteine-induced mitochondrial ROS generation comprises a feedback loop involving activation of ERK MAPK. Rat neuronal cultures expressing mito-RoGFP were treated with 50 μM of L-homocysteine (L-Hcy, 4 h) in the presence or absence (A and B) Pyk2 inhibitor PF431396, (C and D) SFK inhibitor PP2, or (E and F) ERK MAPK inhibitor PD98059 (15 μM). A, C, and E, temporal profile of changes in mito-RoGFP fluorescence intensity (arbitrary units) over time expressed as mean ± SE. B, D, and F, quantitative analysis (two-way ANOVA followed by Bonferroni’s multiple-comparisons test) of the percentage change in fluorescence intensity of oxidized mito-RoGFP signal at the given time points expressed as mean ± SD. Data shows significant effect of treatment, time, and interaction in the presence of PF431396 (treatment effect: F (1, 41) = 195.8; p < 0.0001, time effect: F (2.487, 102) = 74.82; p < 0.0001, interaction: F (4, 164) = 39.80; p < 0.0001), PP2 (treatment effect: F (1, 40) = 165.9; p < 0.0001, time effect: F (2.730, 109.2) = 62.13; p < 0.0001, interaction: F (4, 160) = 34.37; p < 0.0001) and PD98059 (treatment effect: F (1, 45) = 117.2; p < 0.0001, time effect: F (1.937, 84.74) = 81.53; p < 0.0001, interaction: F (4, 175) = 29.47; p < 0.0001). Post hoc analysis shows ∗p < 0.0001 between the treatment groups at the given time point. Data points represent individual biological replicates. Mito-RoGFP, mitochondria-targeted redox-sensitive GFP; ROS, reactive oxygen species; SFK, Src family kinase.
Figure 8
Figure 8
Homocysteine-GluN2A-NMDAR–induced neurotoxicity involves Pyk2 and SFK activation and mitochondrial ROS generation.A and B, rat neuronal cultures were treated with 50 μM of L-homocysteine (L-Hcy) for 18 h in the presence of (A) mitoTEMPO (5 μM); (B) NVP-AAM077 (30 nM), PD98059 (15 μM), PF431396 (5 μM), PP2 (5 μM), or Ro25-6981 (5 μM). Representative photomicrographs of neurons stained with nuclear stain Hoechst 33342 (blue) showing pyknotic DNA (indicated with arrows). The percentage of neurons with pyknotic nuclei are expressed as mean ± SD. One-way ANOVA reveal significant main effect of treatment on cell death in the presence of (A) mitoTEMPO: F (2, 57) = 124.8; p < 0.0001 and (B) other pharmacological inhibitors: F (6, 123) = 55.95; p < 0.0001. Post hoc analysis by Bonferroni’s multiple-comparisons test shows ∗p < 0.0001 between the treatment groups. Data points represent individual biological replicates. NMDAR, N-methyl-D-aspartate subtype of glutamate receptor; ROS, reactive oxygen species; SFK, Src family kinase.
Figure 9
Figure 9
Schematic representation of homocysteine-GluN2A-NMDAR–mediated intracellular signaling. Homocysteine-mediated GluN2A-NMDAR stimulation leads to initial Ca2+ influx, triggering sequential activation of Pyk2 and Src family kinase. This in turn leads to phosphorylation of GluN2A-NMDAR-Tyr1325, thereby enhancing channel activity and further influx of Ca2+. The GluN2A-NMDAR–mediated initial influx of Ca2+ also leads to sustained activation of ERK MAPK that causes mitochondrial ROS generation. The sustained ERK MAPK activation also promotes Pyk2/Src kinase activation further contributing to the cycle of signaling events that eventually results to neuronal death. NMDAR, N-methyl-D-aspartate subtype of glutamate receptor; ROS, reactive oxygen species; SFK, Src family kinase.

References

    1. Hardingham G.E., Fukunaga Y., Bading H. Extrasynaptic NMDARs oppose synaptic NMDARs by triggering CREB shut-off and cell death pathways. Nat. Neurosci. 2002;5:405–414. - PubMed
    1. Kim M.J., Dunah A.W., Wang Y.T., Sheng M. Differential roles of NR2A- and NR2B-containing NMDA receptors in Ras-ERK signaling and AMPA receptor trafficking. Neuron. 2005;46:745–760. - PubMed
    1. Li B., Chen N., Luo T., Otsu Y., Murphy T.H., Raymond L.A. Differential regulation of synaptic and extra-synaptic NMDA receptors. Nat. Neurosci. 2002;5:833–834. - PubMed
    1. Liu Y., Wong T.P., Aarts M., Rooyakkers A., Liu L., Lai T.W., et al. NMDA receptor subunits have differential roles in mediating excitotoxic neuronal death both in vitro and in vivo. J. Neurosci. 2007;27:2846–2857. - PMC - PubMed
    1. Zhang S.J., Steijaert M.N., Lau D., Schutz G., Delucinge-Vivier C., Descombes P., et al. Decoding NMDA receptor signaling: identification of genomic programs specifying neuronal survival and death. Neuron. 2007;53:549–562. - PubMed

Publication types