. 2024 Apr 3;15(1):2866.
doi: 10.1038/s41467-024-46625-w.

Shared inflammatory glial cell signature after stab wound injury, revealed by spatial, temporal, and cell-type-specific profiling of the murine cerebral cortex

Affiliations

Shared inflammatory glial cell signature after stab wound injury, revealed by spatial, temporal, and cell-type-specific profiling of the murine cerebral cortex

Christina Koupourtidou et al. Nat Commun. .

Abstract

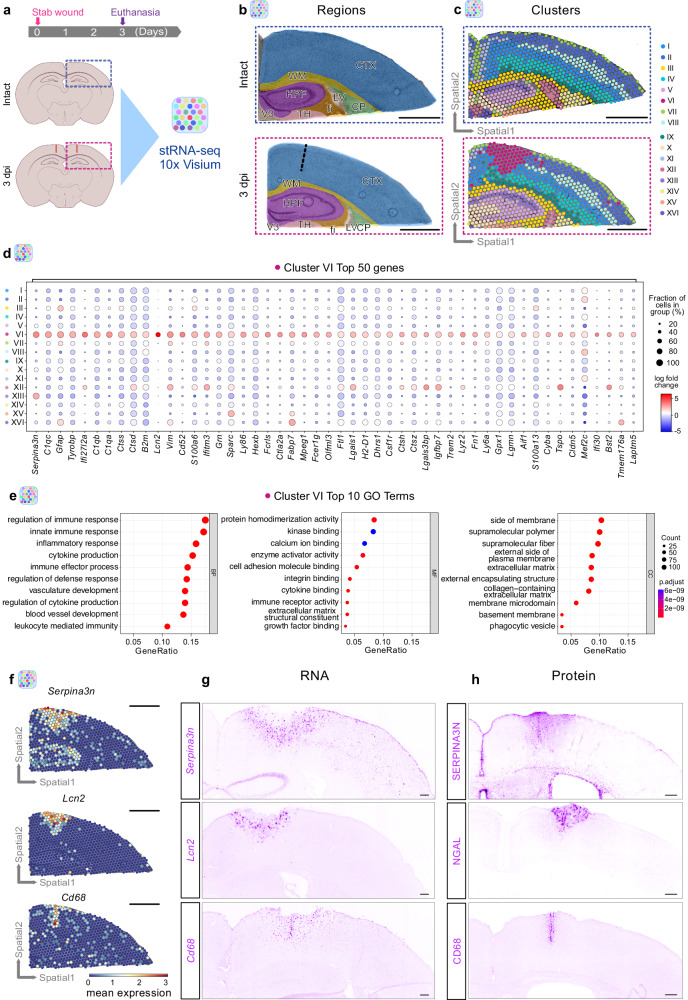
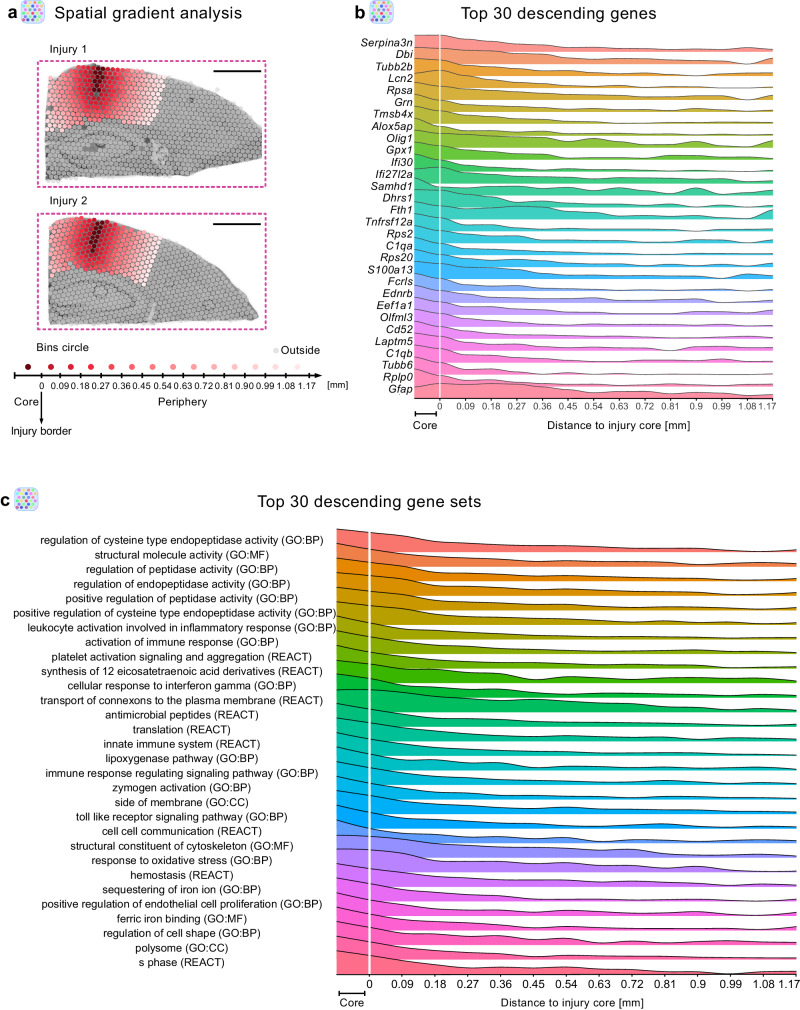
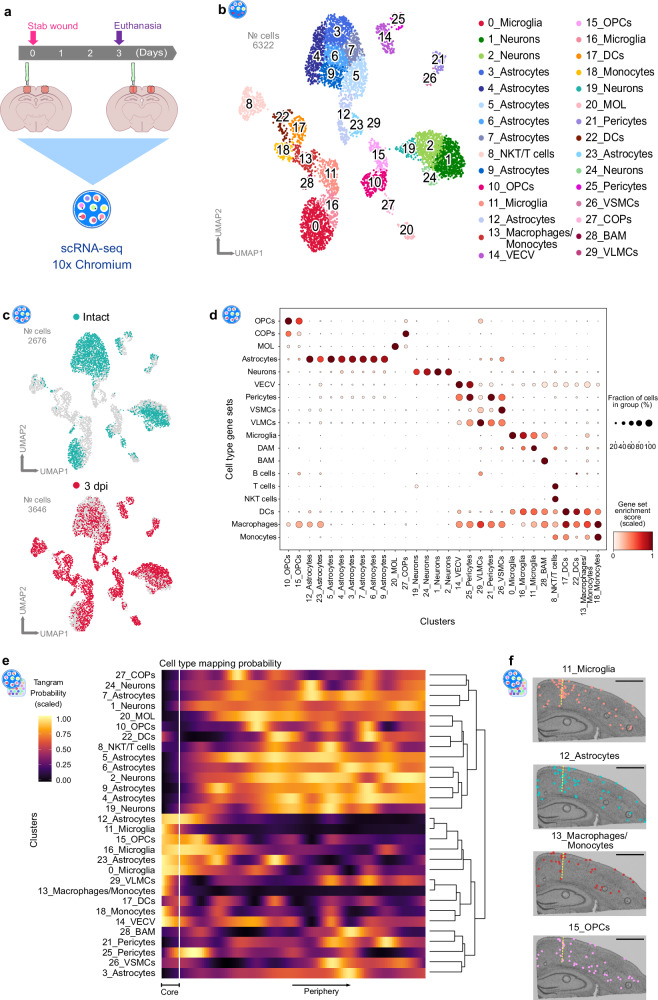
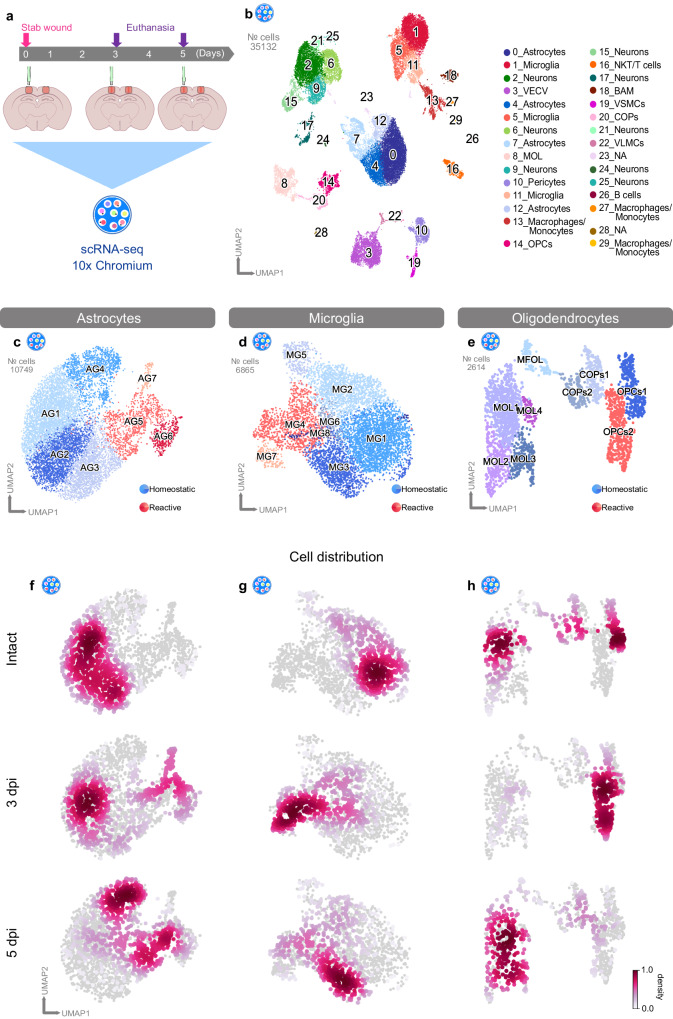
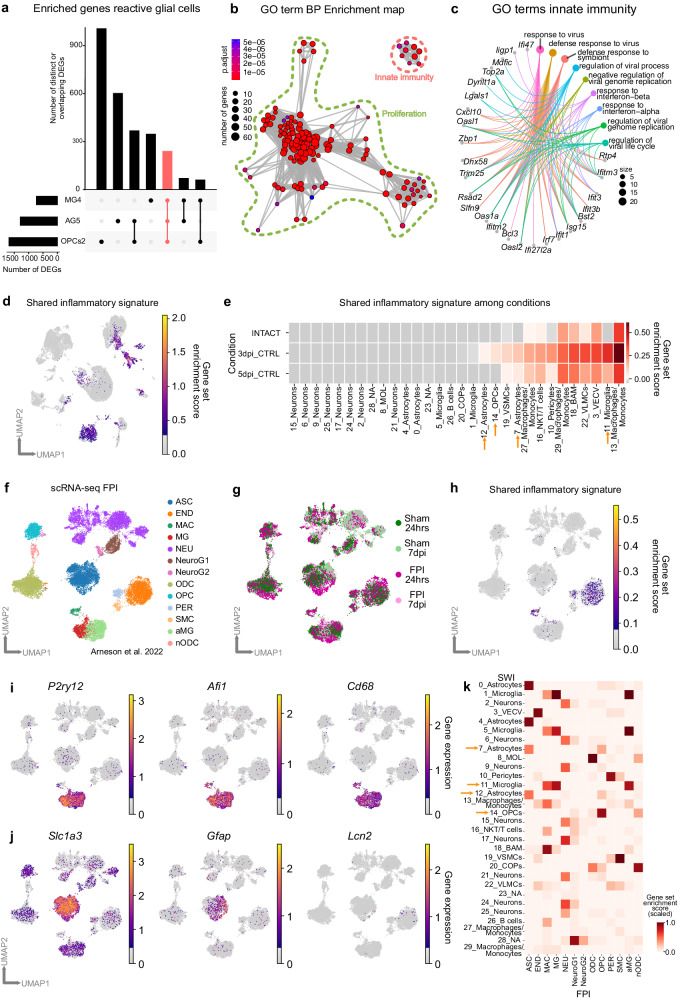
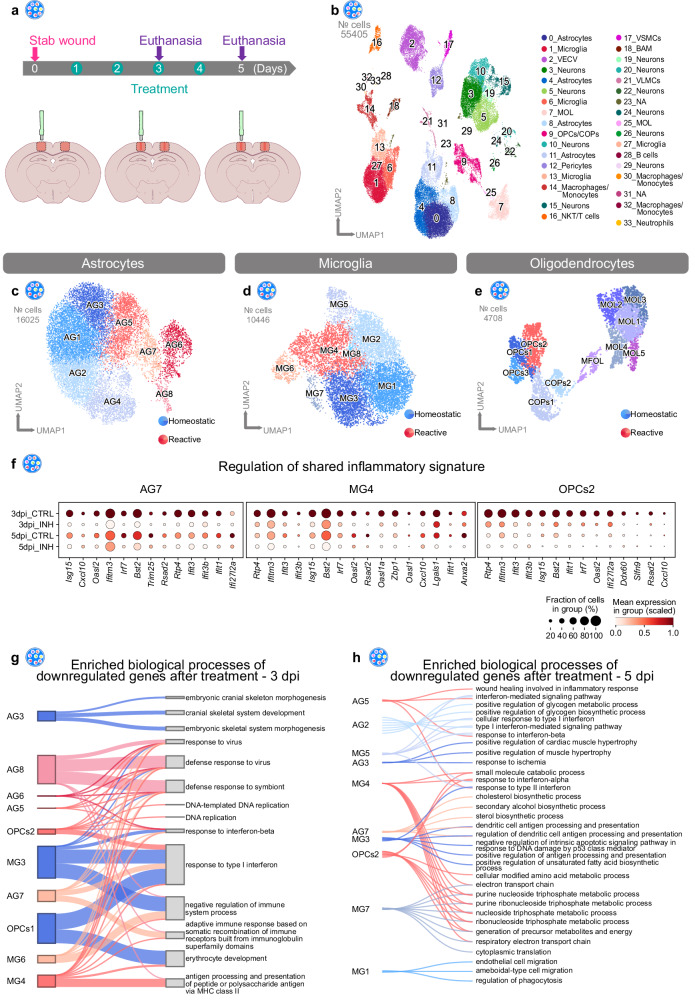
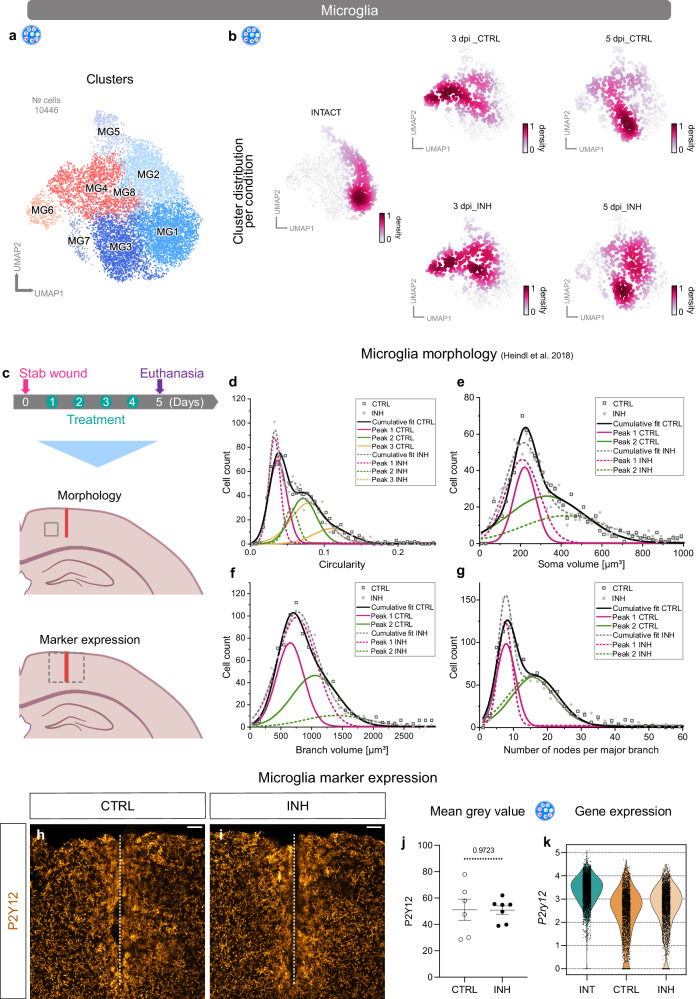
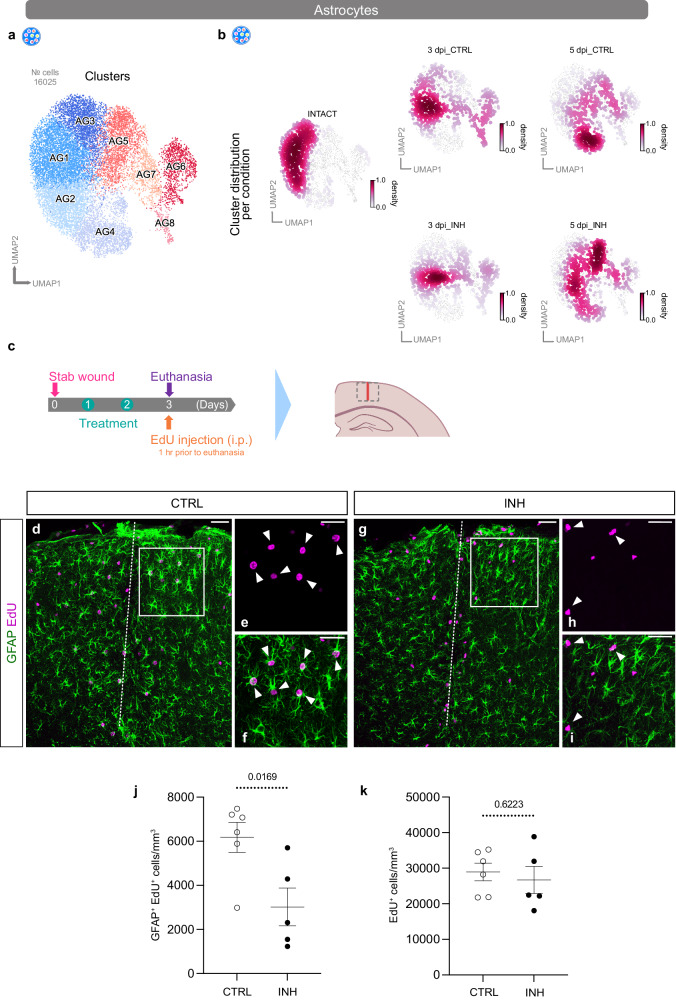
Traumatic brain injury leads to a highly orchestrated immune- and glial cell response partially responsible for long-lasting disability and the development of secondary neurodegenerative diseases. A holistic understanding of the mechanisms controlling the responses of specific cell types and their crosstalk is required to develop an efficient strategy for better regeneration. Here, we combine spatial and single-cell transcriptomics to chart the transcriptomic signature of the injured male murine cerebral cortex, and identify specific states of different glial cells contributing to this signature. Interestingly, distinct glial cells share a large fraction of injury-regulated genes, including inflammatory programs downstream of the innate immune-associated pathways Cxcr3 and Tlr1/2. Systemic manipulation of these pathways decreases the reactivity state of glial cells associated with poor regeneration. The functional relevance of the discovered shared signature of glial cells highlights the importance of our resource enabling comprehensive analysis of early events after brain injury.


Conflict of interest statement

The authors declare the following competing interests: F.T. consults for Immunai Inc., Singularity Bio B.V., CytoReason Ltd, and Omniscope Ltd, and has ownership interest in Dermagnostix GmbH and Cellarity. All other authors declare no competing interests.

Figures

Fig. 1
Fig. 1. Spatially resolved transcriptomic changes induced by stab wound injury.
a Experimental scheme to conduct spatial transcriptomics in intact and stab wound-injured mouse cerebral cortices (3 dpi). Brains were manually resected, and selected areas highlighted in blue or red dashed boxes were positioned on 10x Visium capture areas. b Brain sections of both conditions contain cortical, hippocampal, and white matter regions. The black dashed line indicates the injury core. c Clustering of gene expression data on spatial coordinates based on highly variable genes and subsequent dimensionality reduction. d Dot plot illustrating the expression of the 50 most enriched genes in the injury-induced cluster VI. e Dot plots depicting GO terms over-represented in cluster VI significantly enriched genes (pval < 0.05, log2 fold change >1, method t-test overestimated_variance). Significance of GO terms was determined by performing GO enrichment analysis on gene sets. Spatial transcriptomic analysis (ae) is based on n = 1 animal per condition over 1 experiment, with two sections being captured. f Gene expression of cluster VI-enriched genes Serpina3n, Lcn2, and Cd68 in spatial context. g, h Images depicting expression of Serpina3n, Lcn2, and Cd68 at the RNA (g) and protein level (h) in stab wound-injured cerebral cortices at 3 dpi (n = 3 animals). All images are full z-projections of confocal z-stacks. Scale bars: b, c, f: 1 mm, g, h: 150 μm. stRNA-seq spatial transcriptomics, CTX cerebral cortex, WM white matter, HPF hippocampal formation, LV lateral ventricle, CP caudoputamen, V3 third ventricle, TH thalamus, fi fimbria, dpi days post-injury, BP biological processes, MF molecular functions, CC cellular components, GO gene ontology.
Fig. 2
Fig. 2. Stab wound injury elicits distinct gene expression patterning along a spatial gradient.
a Paradigm for spatial transcriptomic gradient analysis on stab wound-injured mouse cerebral cortices (3 dpi) using the SPATA2 pipeline. Spatial gradient analysis was conducted only in cortical areas; from the injury core (dark red spots) toward the periphery (light pink) within 13 concentric circle bins. All other areas (gray spots) were neglected. b Ridge plot depicting the expression of the 30 most descending genes along the gradient, depicted as mean expression in two injuries (injury 1 and 2). c Ridge plot displaying the top 30 most descending gene sets along the gradient, depicted as mean expression in two injuries (injury 1 and 2). stRNAseq data are based on n = 1 animal over 1 experiment with two injured hemispheres being captured. Scale bars 1 mm. BP biological processes, MF molecular functions, CC cellular components, GO gene ontology, REACT reactome.
Fig. 3
Fig. 3. Combination of spatial and single-cell transcriptomics identifies cellular populations contributing to distinct transcriptional responses at the injury site.
a Experimental scheme to conduct single-cell RNA-sequencing of intact and stab wound-injured cerebral cortices (3 dpi) with the 10x Genomics platform. Red masked areas on brain schemes indicate biopsy areas used for the analysis. b UMAP plot illustrating 6322 single cells distributed among 30 distinct clusters. Clusters are color-coded and annotated according to their transcriptional identities. c UMAP plot depicting the distribution of cells isolated from intact (green) and injured (red) cerebral cortices. d Dot plot indicating strong correlation of post hoc cluster annotation with established cell-type-specific gene sets (Supplementary Table 3). e, f 3 dpi scRNA-seq cluster localization along the spatial gradient (Fig. 2), based on probabilistic mapping with Tangram (e) and single-cell deconvolution (f) in a spatial context. scRNAseq data shown in this figure are derived from n = 3 intact animals over 1 experiment (1 scRNAseq libray) and n = 3 3dpi animals over 1 experiment (2 scRNAseq libraries). stRNAseq data are based on n = 1 animal over 1 experiment with two injured hemispheres being captured. Scale bars in (f): 1 mm. scRNA-seq single-cell transcriptomics, UMAP uniform manifold approximation and projection, dpi days post-injury, OPCs oligodendrocyte progenitor cells, COPs committed oligodendrocyte progenitors, MOL mature oligodendrocytes, VECV vascular endothelial cells (venous), VSMCs vascular smooth muscle cells, VLMCs vascular and leptomeningeal cells, DAM disease-associated microglia, BAM border-associated macrophages, NKT cells natural killer T cells, DCs dendritic cells.
Fig. 4
Fig. 4. Stab wound injury induces defined transcriptional changes in glial subpopulations.
a Experimental scheme for single-cell RNA-sequencing of intact and stab wound-injured cerebral cortices (3 and 5 dpi) with the 10x Chromium platform. Red masked areas on brain schemes indicate biopsy areas used for the analysis. b UMAP embedding of integrated and batch-corrected single-cell transcriptomes of 35132 cells distributed among 30 distinct clusters. Clusters were color-coded and annotated on the basis of their transcriptional identities. ce UMAPs depicting subclustering of astrocytes (7 clusters) (c), microglia (8 clusters) (d), and oligodendrocytes (9 clusters) (e). Cells were further assigned to homeostatic (blue) or reactive (red) clusters according to cell origin (Supplementary Fig. 6) and distinct marker expression. fh UMAPs illustrating cell distributions at all time points (intact, 3 dpi, and 5 dpi) among subclusters of astrocytes (f), microglia (g), and oligodendrocytes (h). Data were downsampled to an equal number of cells between time points for each cell type. Data shown in this figure are derived from n = 12 intact animals over 3 independent experiments (5 scRNAseq libraries), n = 3 3dpi animals over 1 experiment (2 scRNAseq libraries), and n = 9 5dpi animals over 3 independent experiments (3 scRNAseq libraries). scRNA-seq single-cell transcriptomics, UMAP uniform manifold approximation and projection, dpi days post-injury, OPCs oligodendrocyte progenitor cells, COPs committed oligodendrocyte progenitors, MOL mature oligodendrocytes, VECV vascular endothelial cells (venous), VSMCs vascular smooth muscle cells, VLMCs vascular and leptomeningeal cells, BAM border-associated macrophages, NKT cells natural killer T cells, NA not available.
Fig. 5
Fig. 5. Stab wound injury induces common transcriptional changes in reactive glial subpopulations characterizing a specific reactive state.
a UpSet plot depicting unique (single points) or overlapping (connected points) DEGs (pval < 0.05, log2 fold change >1.6, method t-test overestimated_variance). Vertical bars indicate the number of unique or shared genes between clusters. b GO term network analysis of the 241 commonly shared genes, associating shared DEGs with the biological processes of proliferation (green dashed line) and innate immunity (orange dashed line). Significance determined by method GO enrichment analysis on gene sets. c Chord diagram illustrating innate immunity GO terms from panel (b) and the corresponding genes. d UMAP plot depicting localization of the gene set score related to the shared inflammatory signature shown in panel (c) among all cell clusters from Fig. 4b. e Heatmap depicting the shared inflammatory signature gene set score. Data shown in panels (a)–(e) are derived from n = 12 intact animals over 3 independent experiments (5 scRNAseq libraries), n = 3 3dpi animals over 1 experiment (2 scRNAseq libraries), and n = 9 5dpi animals over 3 independent experiments (3 scRNAseq libraries). f UMAP plot illustrating single cells distributed among 13 distinct clusters in the FPI dataset. Clusters are annotated according to Arneson et al.. g UMAP plot depicting the distribution of cells isolated from Sham (green) and FPI (purple) cerebral cortices at 24 h or 7 dpi. h UMAP plot depicting the localization of the gene set score related to the shared inflammatory signature from panel (c). i, j UMAPs highlighting expression of example marker genes to identify reactive microglial (i) and astrocytic clusters (j). k Heatmap displaying cluster similarity of SWI (y-axis) and FPI datasets (x-axis). Orange arrows highlighting clusters of interest. DEGs differentially expressed genes, GO gene ontology, BP biological processes, UMAP uniform manifold approximation and projection, CTRL stab wound-injured control animals, dpi days post-injury, COPs committed oligodendrocyte progenitors, MOL mature oligodendrocytes, VECV vascular endothelial cells (venous), VSMCs vascular smooth muscle cells, VLMCs vascular and leptomeningeal cells, BAM border-associated macrophages, NKT cells natural killer T cells, NA not available, ASC astrocytes, END endothelial, MAC macrophages, MG microglia, NEU neurons, NeuroG1 neurogenesis1, NeuroG2 neurogenesis2, ODC oligodendrocytes, OPC oligodendrocyte precursor, PER pericytes, SMC smooth muscle cells, aMG activated microglia, nODC new oligodendrocytes, hrs hours, FPI fluid percussion injury, SWI stab wound injury.
Fig. 6
Fig. 6. The Cxcr3 and Tlr1/2 pathways orchestrate the innate immune response shared among reactive glial cells.
a Experimental scheme for single-cell RNA-sequencing of intact, stab wound-injured control (3/5 dpi_CTRL) and stab wound-injured inhibitor-treated (3/5 dpi_INH) cerebral cortices with the 10x Chromium platform. Red masked areas on brain schemes indicate biopsy areas used for the analysis. b UMAP embedding of integrated and batch-corrected single-cell transcriptomes of 55405 cells. Cells were distributed among 34 distinct clusters, color-coded, and annotated according to their transcriptional identities. ce UMAPs illustrating subclustering of astrocytes (8 clusters) (c), microglia (8 clusters) (d), and oligodendrocytes (11 clusters) (e). Cells were further assigned to homeostatic (blue), or reactive (red) clusters according to cell origin (Supplementary Fig. 11). f Dot plots depict decreased expression of various shared inflammatory genes from Fig. 5c in the reactive glial clusters AG7, MG4, and OPCs2 after inhibitor treatment. g, h Shankey diagram of GO terms linked to glial subclusters illustrating common and unique downregulated biological processes in response to Cxcr3 and Tlr1/2 pathway inhibition at 3 dpi (g) and 5 dpi (h). Only the top 3 biological process GO terms (based on adjusted p-value) are illustrated for each glial subcluster and the entire list of GO terms is shown in Supplementary Data 7. Line width indicates the adjusted p-value. Significance was determined by performing GO enrichment analysis on gene sets. Data shown in this figure are derived from n = 12 intact animals over 3 independent experiments (5 scRNAseq libraries), n = 3 3dpi CTRL animals over 1 experiment (2 scRNAseq libraries), n = 3 3dpi INH animals over 1 experiment (2 scRNAseq libraries), n = 9 5dpi CTRL animals over 3 independent experiments (3 scRNAseq libraries) and n = 6 5dpi INH animals over 2 independent experiments (3 scRNAseq libraries). UMAP uniform manifold approximation and projection, dpi days post-injury, OPCs oligodendrocyte progenitor cells, COPs committed oligodendrocyte progenitors, MOL mature oligodendrocytes, VECV vascular endothelial cells (venous), VSMCs vascular smooth muscle cells, VLMCs vascular and leptomeningeal cells, BAM border-associated macrophages, NKT cells natural killer T cells, NA not available, CTRL stab wound-injured control animals, INH stab wound-injured inhibitor-treated animals.
Fig. 7
Fig. 7. Microglial reactivity following Cxcr3 and Tlr1/2 pathway inhibition.
a, b UMAPs illustrating subclusters of microglia (a) and cell distributions (b) among those subclusters at all time points (intact, 3 dpi, and 5 dpi) and conditions (CTRL and INH). Data shown in (b) are downsampled to an equal number of cells between time points and conditions. Data shown in panels (a) and (b) are derived from n = 12 intact animals over 3 independent experiments (5 scRNAseq libraries), n = 3 3dpi CTRL animals over 1 experiment (2 scRNAseq libraries), n = 3 3dpi INH animals over 1 experiment (2 scRNAseq libraries), n = 9 5dpi CTRL animals over 3 independent experiments (3 scRNAseq libraries) and n = 6 5dpi INH animals over 2 independent experiments (3 scRNAseq libraries). c Experimental paradigm to assess microglial reactivity. Gray boxes on the mouse brain schemes highlight the analyzed areas. Red lines indicate the injury cores. dg Plots depicting the distribution of microglial circularity (d), soma volume (e), branch volume (f), and number of nodes per major branch (g) of nCTRL = 6 and nINH = 5 animals. Source data are provided as Source Data file. Data are fitted with multiple peak functions. The fit parameters are depicted in Supplementary Data 8 for each fit. h, i Representative images of P2Y12 staining in CTRL (h) and INH-treated (i) mice. Dashed white lines indicate the injury core. All images are full z-projections of confocal z-stacks. j Dot plot depicting the mean gray value of P2Y12+ signal in the injury vicinity of CTRL and INH-treated mice at 5 dpi. Data are shown as mean ± standard error of the mean. Each data point represents one animal. Source data are provided as Source Data file. Statistics have been derived from nCTRL = 6 and nINH = 7 animals. p-values were determined with unpaired t-test (two-tailed). k Violin plots depicting expression levels of P2ry12 in microglia (scRNA-seq) in intact, 5 dpi CTRL and 5 dpi INH condition. Data are derived derived from n = 12 intact animals over 3 independent experiments (5 scRNAseq libraries), n = 9 5dpi CTRL animals over 3 independent experiments (3 scRNAseq libraries) and n = 6 5dpi INH animals over 2 independent experiments (3 scRNAseq libraries). Scale bars: h, i: 50 μm. UMAP uniform manifold approximation and projection, dpi days post-injury, CTRL stab wound-injured control animals, INH stab wound-injured inhibitor-treated animals, INT intact.
Fig. 8
Fig. 8. Proliferation of reactive astrocytes is decreased after Cxcr3 and Tlr1/2 pathway inhibition.
a, b UMAPs illustrating subclusters of astrocytes (a) and cell distributions (b) among those subclusters at all time points (intact, 3 dpi, and 5 dpi) and conditions (CTRL and INH). Data in (b) are downsampled to an equal number of cells between time points and conditions. Data are derived from n = 12 intact animals over 3 independent experiments (5 scRNAseq libraries), n = 3 3dpi CTRL animals over 1 experiment (2 scRNAseq libraries), n = 3 3dpi INH animals over 1 experiment (2 scRNAseq libraries), n = 9 5dpi CTRL animals over 3 independent experiments (3 scRNAseq libraries) and n = 6 5dpi INH animals over 2 independent experiments (3 scRNAseq libraries). c Experimental paradigm for assessing astrocyte proliferation. The dashed gray box on mouse brain scheme indicates the analyzed area. The red line indicates the injury core. d, e Representative overview images of proliferating GFAP+ (green) and EdU+ (magenta) astrocytes in CTRL (d) and INH-treated (e) animals. White dashed lines highlight injury cores. Micrographs (e, f, h, i) are magnifications of white boxed areas in (d) and (g), respectively. White arrowheads in micrographs indicate colocalization of EdU (e, h) with GFAP+ astrocytes (f, i). All images are full z-projections of confocal z-stacks. j, k Dot plots depicting density of proliferating (GFAP+ and EdU+) astrocytes (j) and total density of proliferating (EdU+) cells (k) in CTRL and INH-treated animals. Data are shown as mean ± standard error of the mean. Each data point represents one animal. Source data are provided as Source Data file. Statistics in (j) and (k) have been derived from nCTRL = 6 and nINH = 5 animals. p-values were determined with unpaired t-test (two-tailed). Scale bars: d, g: 50 μm, e, i: 20 μm. UMAP uniform manifold approximation and projection, dpi days post-injury, EdU 5-ethinyl-2′-deoxyuridine, i.p. intraperitoneal injection, CTRL stab wound-injured control animals, INH stab wound-injured inhibitor-treated animals.

References

    1. Majdan M, et al. Years of life lost due to traumatic brain injury in Europe: a cross-sectional analysis of 16 countries. PLoS Med. 2017;14:e1002331. doi: 10.1371/journal.pmed.1002331. - DOI - PMC - PubMed
    1. Blennow K, et al. Traumatic brain injuries. Nat. Rev. Dis. Primers. 2016;2:1–19. doi: 10.1038/nrdp.2016.84. - DOI - PubMed
    1. Mira RG, Lira M, Cerpa W. Traumatic brain injury: mechanisms of glial response. Front. Physiol. 2021;12:740939. doi: 10.3389/fphys.2021.740939. - DOI - PMC - PubMed
    1. Puntambekar SS, Saber M, Lamb BT, Kokiko-Cochran ON. Cellular players that shape evolving pathology and neurodegeneration following traumatic brain injury. Brain Behav. Immun. 2018;71:9–17. doi: 10.1016/j.bbi.2018.03.033. - DOI - PubMed
    1. Maas AI, Stocchetti N, Bullock R. Moderate and severe traumatic brain injury in adults. Lancet Neurol. 2008;7:728–741. doi: 10.1016/S1474-4422(08)70164-9. - DOI - PubMed

Substances