. 2024 Apr 3;15(1):2884.
doi: 10.1038/s41467-024-46975-5.

Global spatiotemporal synchronizing structures of spontaneous neural activities in different cell types

Affiliations

Global spatiotemporal synchronizing structures of spontaneous neural activities in different cell types

Liang Shi et al. Nat Commun. .

Abstract

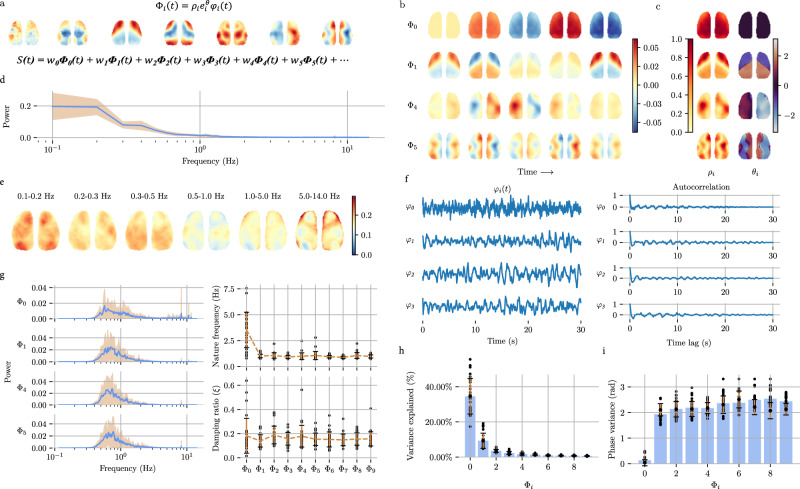
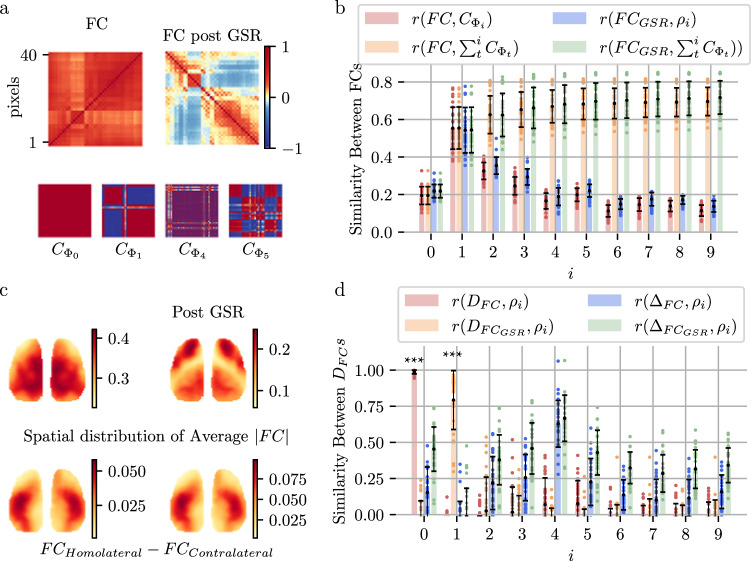
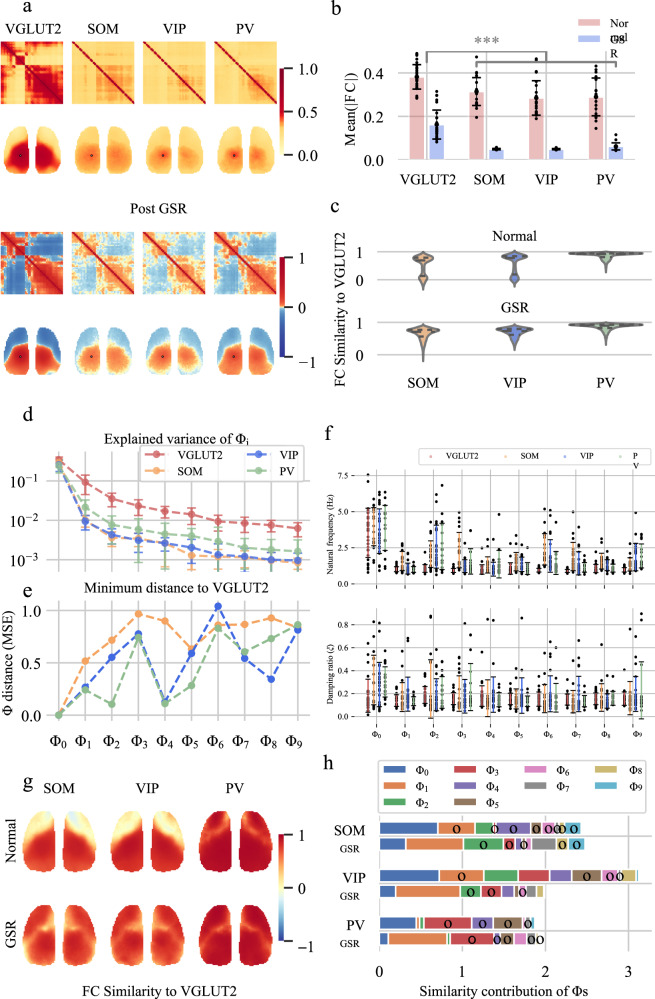
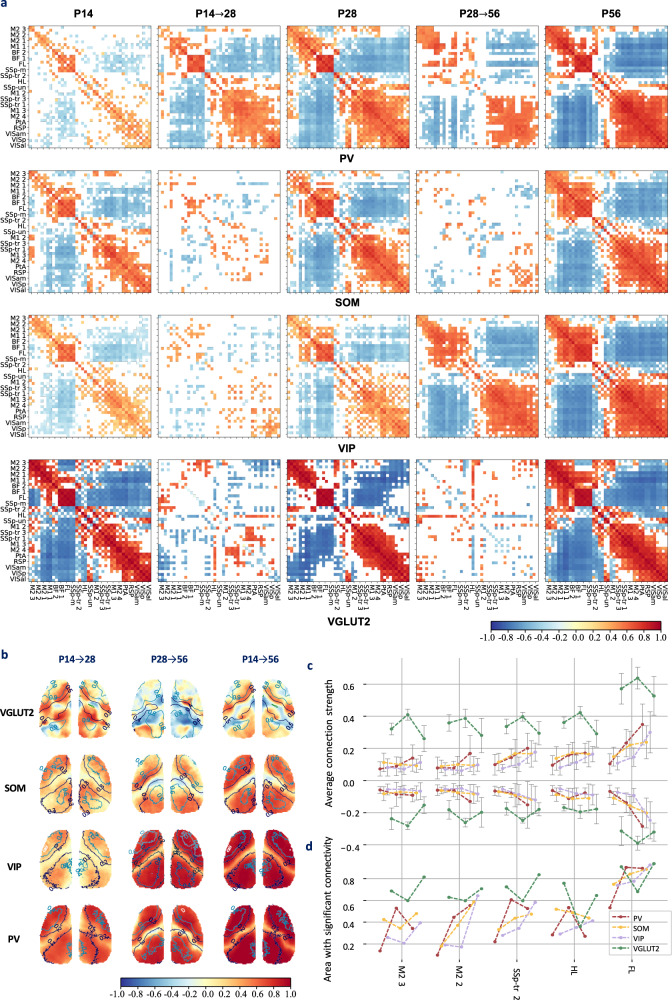
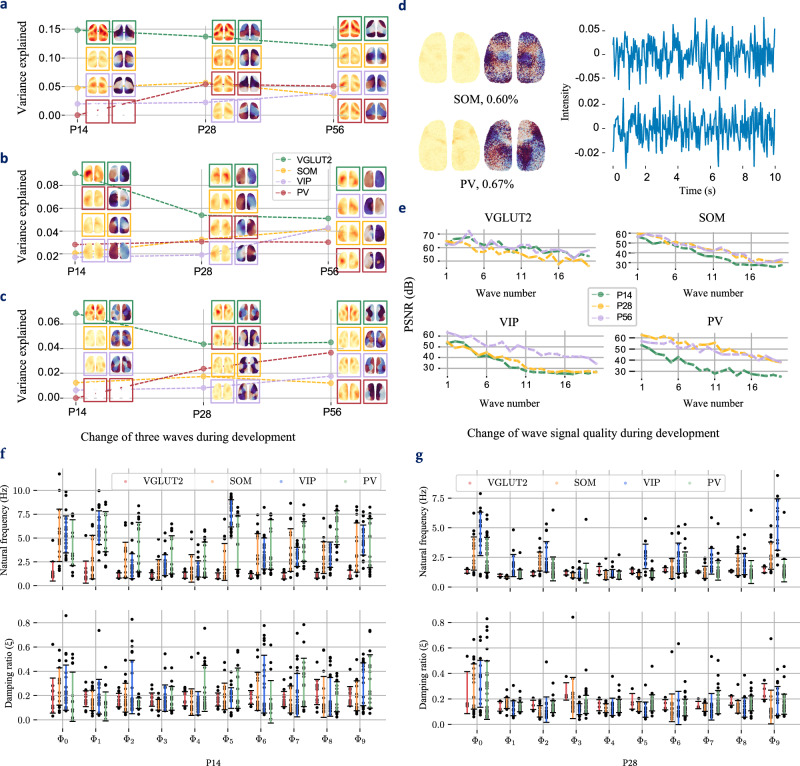
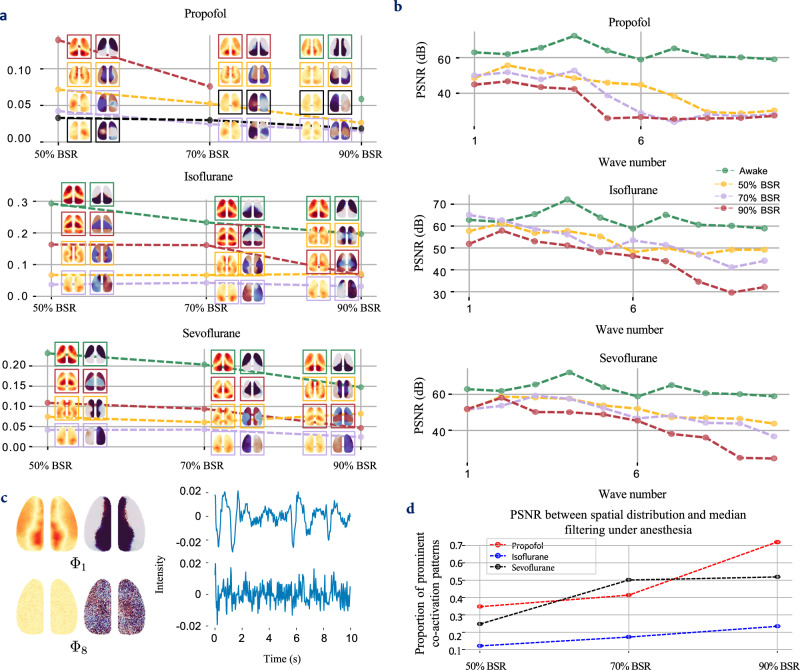
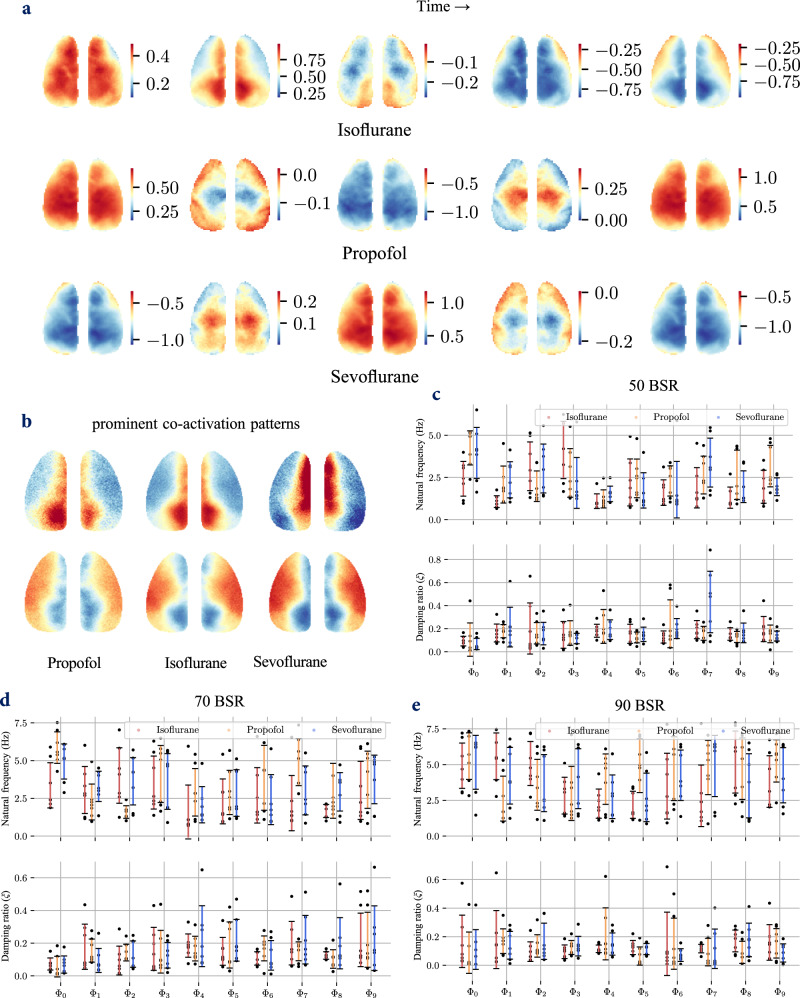
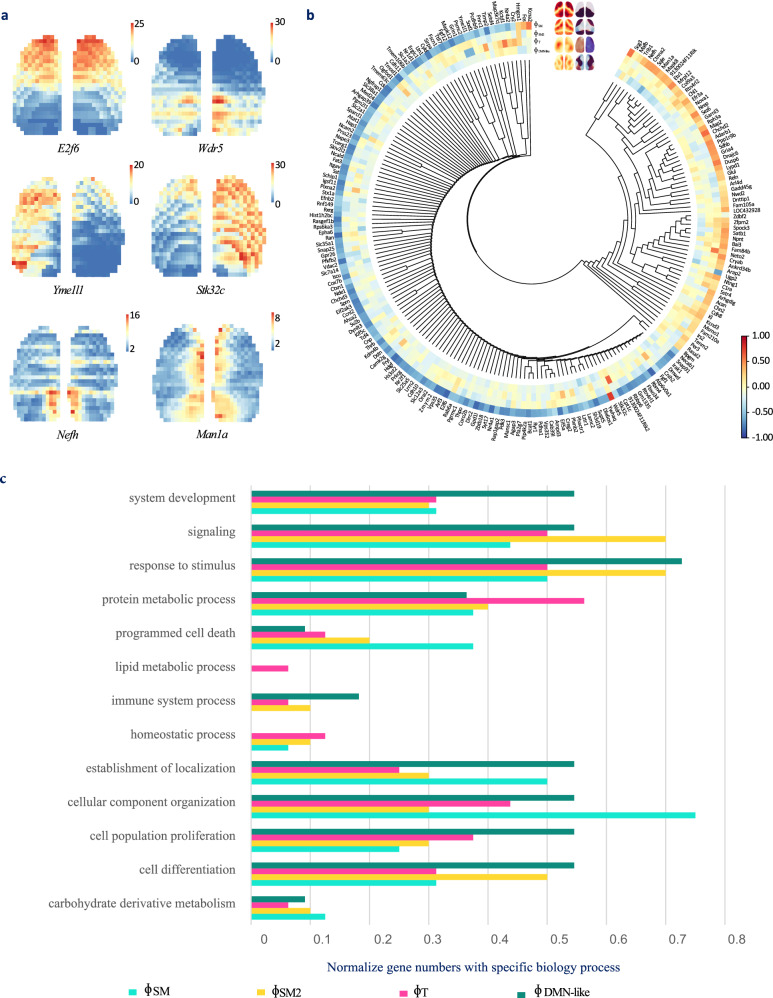
Increasing evidence has revealed the large-scale nonstationary synchronizations as traveling waves in spontaneous neural activity. However, the interplay of various cell types in fine-tuning these spatiotemporal patters remains unclear. Here, we performed comprehensive exploration of spatiotemporal synchronizing structures across different cell types, states (awake, anesthesia, motion) and developmental axis in male mice. We found traveling waves in glutamatergic neurons exhibited greater variety than those in GABAergic neurons. Moreover, the synchronizing structures of GABAergic neurons converged toward those of glutamatergic neurons during development, but the evolution of waves exhibited varying timelines for different sub-type interneurons. Functional connectivity arises from both standing and traveling waves, and negative connections can be elucidated by the spatial propagation of waves. In addition, some traveling waves were correlated with the spatial distribution of gene expression. Our findings offer further insights into the neural underpinnings of traveling waves, functional connectivity, and resting-state networks, with cell-type specificity and developmental perspectives.


Conflict of interest statement

The authors declare no competing interests.

Figures

Fig. 1
Fig. 1. Large-scale neural activity is organized by standing and traveling waves (VGLUT2, P56).
a Fluorescent signals St of neural activity can be decomposed into linear superpositions of standing and traveling waves Φit distributed throughout the cortex; these signals are extracted from spontaneous neural activity in VGLUT2 neurons at P56. The weight wi is the eigenvalue of Φi, wiφi gives the principal component “scores”, and wiρieθi/ntime1 gives the principal component “loadings”. b Spatiotemporal patterns (over one cycle) of waves Φ0,Φ1,Φ4,Φ5, showcasing only significant waves identified in the subsequent text. c Spatial distributions of waves Φ0,Φ1,Φ4,Φ5. ρ: Intensity distribution. θ: Phase distribution (time lag) in rad. d The power spectral density (PSD) of the fluorescence signal (pixel averaged, normalized to unit energy). e Spatial maps of spectral power in 6 nonoverlapping frequency bands, with pixels normalized to unit energy. f Waveforms φit (first 30 s in 180 s acquisition) and autocorrelation functions of waves Φ0,Φ1,Φ4,Φ5. g Unit-energy PSDs of φ0,φ1,φ4,φ5, with interexperimental variability (shaded). Natural frequencies (f) and damping ratios (ξ) of the 10 strongest waves. The error bars represent the mean ± standard error across the experiments. 23 experiments over n=10 male mice. h The proportion of the 10 strongest waves, measured by the variance ratio of each wave relative to the original signal. The error bars represent the mean  ±  standard error across the experiments. 23 experiments over n=10 male mice. Source data are provided as a Source Data file. i The spatial distribution uniformity of the 10 strongest waves, measured by the circle variance θi. The error bars represent the mean  ±  standard error across the experiments. 23 experiments over n=10 male mice. Source data are provided as a Source Data file.
Fig. 2
Fig. 2. FC as a linear superposition of zero-lag and time-lag synchronization structures.
a FC matrices were calculated for the original fluorescent signals (FC), GSR-regressed signals (FCGSR), and time courses reconstructed from Φ0 (CΦ0), Φ1 (CΦ1), Φ4 (CΦ4) and Φ5 (CΦ5). While the values differ considerably, the FC matrix and FCGSR matrix display a remarkable correlation (r=0.93±0.03), suggesting a shared underlying trend in their relative positioning. b Similarities of the FC and FCGSR maps with CΦi, including individual waves and their linear superpositions (t=0iwtCΦt), measured by the Pearson correlation coefficient. The error bars represent the mean  ±  standard error across the experiments. 23 experiments over n=10 male mice. Source data are provided as a Source Data file. c Spatial distributions of pixel-averaged FC(DFC) and FCGSR (DFCGSR) with their hemispheric differences (ΔFC, ΔFCGSR). The hemispheric differences were calculated by the pixel average of FCHomolateralFCContralateral. d Similarities between the spatial distribution of FC (DFC, DFCGSR) and the intensity distributions of standing/traveling waves (10 strongest waves, ρi, as shown in Fig. 1c), as measured by the Pearson correlation coefficient; only positive correlations are shown. DFC and ρ0, DFCGSR and ρ1, ΔFC exhibited significantly greater pairwise similarities than those of all the other combinations (Fisher’s z-transformed two-sided t-tests, p=109, p=6.88×10⁶ after FDR correction with a threshold of 0.05). The error bars represent the mean  ±  standard error across the experiments. 23 experiments over n=10 male mice. Source data are provided as a Source Data file.
Fig. 3
Fig. 3. The four types of neurons exhibit similar FC patterns at P56.
a FC matrix and FCGSR matrix and FC and FCGSR maps from seed point SSP-tr 3 of four types of neurons (VGLUT2, SOM, VIP, and PV). b The average of FC and FCGSR in the VGLUT2 neurons are significantly larger than those in the GABAergic neurons (Fisher’s z-transformed two-sided t-tests, FC:p=4.8×10⁴, FCGSR:p=5.3×10⁷, after FDR correction with a threshold of 0.05). The error bars represent the mean  ±  standard error across the experiments. (23 experiments over n=10 VGLUT2 male mice. 17 experiments over n=13 PV male mice. 20 experiments over n=10 SOM male mice. 24 experiments over n=10 VIP male mice.) c Violin plot of similarities between the FC of GABAergic neurons and that of VGLUT2 neurons at P56, measured by the Pearson correlation coefficient Si=PearsonCVGLUT2i,jforj=1, 2,CGABAergici,jforj=1, 2,, where Ci,j is the Pearson correlation coefficient between the signals of pixels i and j. The similarities during development are shown in Supplementary Fig. 2b. d Variance explained by the top 10 waves in GABAergic and VGLUT2 neurons at P56. The error bars represent the mean  ±  standard error across the experiments. (23 experiments over n=10 VGLUT2 male mice. 17 experiments over n=13 PV male mice. 20 experiments over n=10 SOM male mice. 24 experiments over n=10 VIP male mice.) e Degree of similarity between waves from VGLUT2 and GABAergic neurons at P56, quantified by the minimum mean squared error (MSE) of the correlation matrices from a specific wave to all waves in VGLUT2. A lower MSE indicates greater similarity. f Natural frequencies (f) and damping ratios (ξ) of the 10 strongest waves from four types of neurons. The error bars represent the mean  ±  standard error across the experiments. (23 experiments over n=10 VGLUT2 male mice. 17 experiments over n=13 PV male mice. 20 experiments over n=10 SOM male mice. 24 experiments over n=10 VIP male mice.) Source data are provided as a Source Data file. g The spatial distribution of FC similarities between VGLUT2 and GABAergic neurons at P56 was measured by the Pearson correlation coefficient, as shown in Fig. 3c. The spatial distributions of FC similarities during development are shown in Supplementary Fig. 2a. h The similarity between FC similarity to VGLUT2 and spatial distributions (ρi) of waves measured by Pearson correlation coefficients. The black circles denote negative correlations.
Fig. 4
Fig. 4. The developmental processes of FC are cell type and region specific.
a Significant seed-seed FC post-GSR and changes in four types of neurons across three developmental stages, with diagonal entries representing the short-range FC and changes (p < 0.05, Fisher’s z-transformed two-sided t-tests, after FDR correction with a threshold of 0.05). Changes between P14 and P56 are shown in Supplementary Fig. 2a. b The spatial distribution of changes in the average FC post-GSR during development, measured by the difference in pixel averages of correlation coefficients. The contour shows the spatial distribution of Φ1. c Trends in the average FC at 5 seed points during development. The positive connections and negative connections are averaged separately and are shown in the top and bottom panels, respectively. The error bars represent the mean  ±  standard error across the experiments. (P14: 13 experiments over n=6 VGLUT2 male mice. 17 experiments over n=6 PV male mice. 16 experiments over n=16 SOM male mice. 23 experiments over n=5 VIP male mice. P28: 8 experiments over n=4 VGLUT2 male mice. 32 experiments over n=7 PV male mice. 19 experiments over n=6 SOM male mice. 17 experiments over n=7 VIP male mice. P56: 23 experiments over n=10 VGLUT2 male mice. 17 experiments over n=13 PV male mice. 20 experiments over n=10 SOM male mice. 24 experiments over n=10 VIP male mice.) d Area of regions with significant connections at 5 seed points.
Fig. 5
Fig. 5. Spatial variations in waves during development.
ac Changes in ΦSM2, ΦT and ΦDMNlike in the four neuron types at three developmental stages (relative to post-GSR). The dashed lines show the changes in the corresponding wave proportions during development, and the images show the changes in the corresponding wave spatial distributions. d Spatial distributions and waveforms (first 30 s in 180 s acquisition) of “low-quality” waves. e Changes in wave quality during development, measured by the PSNR between the spatial distribution and its median filtering. The qualities of the 20 strongest waves are presented. f-g Natural frequencies (f) and damping ratios (ξ) of the 10 strongest waves from four types of neurons at P14 and P28. The error bars represent the mean  ±  standard error across the experiments. (P14: 13 experiments over n=6 VGLUT2 male mice. 17 experiments over n=6 PV male mice. 16 experiments over n=16 SOM male mice. 23 experiments over n=5 VIP male mice. P28: 8 experiments over n=4 VGLUT2 male mice. 32 experiments over n=7 PV male mice. 19 experiments over n=6 SOM male mice. 17 experiments over n=7 VIP male mice. P56: 23 experiments over n=10 VGLUT2 male mice. 17 experiments over n=13 PV male mice. 20 experiments over n=10 SOM male mice. 24 experiments over n=10 VIP male mice.) Source data are provided as a Source Data file.
Fig. 6
Fig. 6. Waves during movement extracted by CPCA.
a Spatial distributions of the waves ΦG and ΦSM during movement (running on plate) in four types of neurons. b Changes in wave quality during movement, measured by the PSNR between the spatial distribution and its median filtering. The qualities of the 10 strongest waves are presented. c Spatial distribution and correlation matrix of Φ4 during movement.
Fig. 7
Fig. 7. Traveling waves in VGLUT2 neurons vary under anesthesia.
a Changes in the ΦSM, ΦSM2, ΦT and ΦDMNlike waves of four cell types (post-GSR, relative) under anesthesia are illustrated, with different waves represented by different colors. The dashed lines show how the proportions of these waves change as the burst suppression ratio (BSR) increases, while the images depict the corresponding changes in their spatial distributions. b Changes in wave quality under anesthesia, measured by the PSNR between the spatial distribution and median filtering. ΦSM disappeared under Propofol anesthesia under 90% BSR (red line). c Spatial distributions and waveforms (first 30 s in 180 s acquisition) of Φ1 and Φ8 (propofol, 90% BSR). Φ8 is a low-quality wave. d Proportions of prominent coactivation patterns (CAPs) across different BSRs.
Fig. 8
Fig. 8. Standing waves and frequency characteristics of VGLUT2 neurons under anesthesia.
a Spatiotemporal patterns of the ΦG wave under anesthesia at a BSR of 90%. b Prominent coactivation patterns in the anesthetized state (90% BSR). ce Natural frequencies (f) and damping ratios (ξ) of the 10 strongest waves from VGLUT2 neurons at BSR levels of 50%, 70% and 90%. The error bars represent the mean  ±  standard error across the experiments. n=7 male mice examined over 9 independent experiments; Source data are provided as a Source Data file.
Fig. 9
Fig. 9. Gene expression associated with traveling waves.
a Spatial distribution of gene expression in the cortex that shows patterns similar to those of waves. The colors indicate the intensity of gene expression on the cortex surface. b Similarity between the spatial distribution of gene expression and the spatial distribution of the ΦSM, ΦSM2, ΦT and ΦDMNlike waves illustrated by a gene coexpression tree, measured by the correlation coefficient. The colors in the heatmap show the correlation coefficients. Source data are provided as a Source Data file. c Biological processes associated with genes that are correlated with traveling waves.

Similar articles

Cited by

  • Optogenetic Brain-Computer Interfaces.
    Tang F, Yan F, Zhong Y, Li J, Gong H, Li X. Tang F, et al. Bioengineering (Basel). 2024 Aug 12;11(8):821. doi: 10.3390/bioengineering11080821. Bioengineering (Basel). 2024. PMID: 39199779 Free PMC article. Review.

References

    1. Wekselblatt JB, Flister ED, Piscopo DM, Niell CM. Large-scale imaging of cortical dynamics during sensory perception and behavior. J. Neurophysiol. 2016;115:2852–2866. doi: 10.1152/jn.01056.2015. - DOI - PMC - PubMed
    1. Makino H, et al. Transformation of cortex-wide emergent properties during motor learning. Neuron. 2017;94:880–890.e8. doi: 10.1016/j.neuron.2017.04.015. - DOI - PMC - PubMed
    1. Musall S, Kaufman MT, Juavinett AL, Gluf S, Churchland AK. Single-trial neural dynamics are dominated by richly varied movements. Nat. Neurosci. 2019;22:1677–1686. doi: 10.1038/s41593-019-0502-4. - DOI - PMC - PubMed
    1. Barson D, et al. Simultaneous mesoscopic and two-photon imaging of neuronal activity in cortical circuits. Nat. Methods. 2020;17:107–113. doi: 10.1038/s41592-019-0625-2. - DOI - PMC - PubMed
    1. Gallero-Salas Y, et al. Sensory and behavioral components of neocortical signal flow in discrimination tasks with short-term memory. Neuron. 2021;109:135–148.e6. doi: 10.1016/j.neuron.2020.10.017. - DOI - PubMed

LinkOut - more resources