. 2024 Apr 3;15(1):2860.
doi: 10.1038/s41467-024-47271-y.

Spatial transcriptomics reveals discrete tumour microenvironments and autocrine loops within ovarian cancer subclones

Affiliations

Spatial transcriptomics reveals discrete tumour microenvironments and autocrine loops within ovarian cancer subclones

Elena Denisenko et al. Nat Commun. .

Abstract

High-grade serous ovarian carcinoma (HGSOC) is genetically unstable and characterised by the presence of subclones with distinct genotypes. Intratumoural heterogeneity is linked to recurrence, chemotherapy resistance, and poor prognosis. Here, we use spatial transcriptomics to identify HGSOC subclones and study their association with infiltrating cell populations. Visium spatial transcriptomics reveals multiple tumour subclones with different copy number alterations present within individual tumour sections. These subclones differentially express various ligands and receptors and are predicted to differentially associate with different stromal and immune cell populations. In one sample, CosMx single molecule imaging reveals subclones differentially associating with immune cell populations, fibroblasts, and endothelial cells. Cell-to-cell communication analysis identifies subclone-specific signalling to stromal and immune cells and multiple subclone-specific autocrine loops. Our study highlights the high degree of subclonal heterogeneity in HGSOC and suggests that subclone-specific ligand and receptor expression patterns likely modulate how HGSOC cells interact with their local microenvironment.


Conflict of interest statement

Paul A. Cohen reports speakers’ honoraria from AstraZeneca and Seqirus, and consultancy fees and stock in Clinic IQ Pty Ltd. Emily Killingbeck is an employee of NanoString Technologies and holds NanoString stock or stock options. All other authors declare no competing interests.

Figures

Fig. 1
Fig. 1. Graphical overview of the Visium data generated for eight HGSOC samples.
a Hematoxylin (blue) and eosin (red) stained tissue sections. Patient IDs are shown for each section. Scale bar = 1 mm. b Gene expression-based clustering of the Visium data. Expression profiles for spots are clustered and then mapped back onto the tissue sections. Cluster colours are randomly assigned. c Tumour cell enrichment weights calculated using RCTD. Spots with tumour cell enrichment are shown in red. d CNA-based clusters. Blue, red, and yellow spots correspond to putative tumour subclones, grey spots are non-malignant regions with RCTD tumour scores <0.15, green and pink correspond to border regions. e Histopathological expert annotation of the tissue sections using QuPath. Red corresponds to malignant cells, green corresponds to stroma. Scale bar = 1 mm. Note that the colours shown in b are arbitrary but highlight that unsupervised clustering of the expression data using Seurat (b), and clustering of inferCNV profiles (d) identified clusters with spatial patterns that largely reflected the morphology shown in a and the pathology shown in e. Supplementary Fig. S19 shows Sankey diagrams and statistics summarising the relationship between the clusters shown in (b) and (d).
Fig. 2
Fig. 2. Copy number analysis reveals three tumour subclones with spatially restricted patterns in patient 1.
a Projection of spot clusters identified by inferCNV onto the tissue section. P1.background corresponds to the set of spots used as a reference for inferCNV, P1.1, P1.2, and P1.3 are three putative tumour subclones, P1.4 and P1.5 are probable tumour border clusters. Scale bar = 1 mm. b Heatmap generated by inferCNV showing inferred CNA profiles of Visium spots for five clusters. c High-confidence CNAs identified by Hidden Markov and Bayesian latent mixture modelling within inferCNV for the five clusters. d Adjacent tissue section showing areas collected for low pass whole genome sequencing (WGS). Colours of ellipses correspond to the colours of clusters in a. Scale bar = 1 mm. e IchorCNA CNA profiles for selected chromosomes confirming high-confidence CNAs predicted by inferCNV. See Supplementary Fig. S13 for the genome-wide view. Three tumour subclones and non-malignant tissue (P1.background) are shown with two or three replicates each, corresponding to tissue fragments in (d). f Representative tissue areas for the three subclones. Hematoxylin (blue) and eosin (red) staining (HnE) and histopathological expert annotation using QuPath are shown, red corresponds to malignant cells, green corresponds to stroma. Location of these areas on the tissue is shown by rectangles in (a). Scale bar = 0.1 mm.
Fig. 3
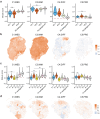
Fig. 3. Variations in HGSOC molecular subtype signatures.
a Distribution of Module scores for the four molecular subtype signatures in each of the CNA-based clusters in patient 5. b Spatial distribution of Module scores for the four molecular subtype signatures in patient 5. c Distribution of Module scores for the four molecular subtype signatures in each of the CNA-based clusters in patient 1. d Spatial distribution of Module scores for the four molecular subtype signatures in patient 1. The labels shown correspond to the mesenchymal (C1.MES), immunoreactive (C2.IMM), differentiated (C4.DIF), and proliferative (C5.PRO) subtypes respectively; IMM and DIF are associated with good outcomes while MES and PRO are associated with poor outcomes. For (a) and (c), black lines are medians, red dotted lines show the value if all spots are combined as a pseudo-bulk. ns and bars indicate seven pairs of clusters where there was no significant difference in the module score; all other pairwise comparisons returned significant results, significance was determined using two-sided Mann-Whitney U test with Benjamini-Hochberg correction and 0.05 threshold. Source Data for panels (a) and (c) are provided.
Fig. 4
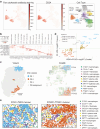
Fig. 4. Single cell resolution spatial analysis of HGSOC.
CosMx SMI data shown is from a serial section of that profiled by Visium for patient 5. a UMAP representations of the cells identified in the CosMx data. (left) Mean fluorescence intensity within a given cell for pan cytokeratin antibody staining, (centre) Expression of CD24 - a HGSOC marker, (right) Cell type annotations. b Marker genes used for cell cluster annotation. c Spatial overview comparing CNA clusters identified by Visium and cell types identified by CosMx SMI. Scale bar = 1 mm. d Scatterplot comparing log2FC of genes identified as differentially expressed in the Visium and CosMx analyses (using two-sided non-parametric Wilcoxon rank sum test in Seurat, with Bonferroni adjustment). The Visium and CosMx data were significantly correlated (Spearman’s correlation coefficient of 0.82 and p-value < 2.2e−16). e Closeup of two CosMx fields of view (FOVs) containing PIGR + (left) and PTGS1 + (right) subclones. The corresponding FOVs are highlighted in c in blue and red, respectively.
Fig. 5
Fig. 5. Subclonal microenvironment and ligand and receptor analyses.
Using squidpy we surveyed the cell types neighbouring each cell type at 3 different distances (Supplementary Data 9). a Neighbouring cells at the shortest radius of 110 pixels (median of 3 neighbouring cells). Rows indicate query cell type. Columns are neighbouring cell types. Numbers in cells are the percentage across each row. Green indicates maximum value per row. Residual proportions after removing homotypic tumour cell-tumour cell neighbours are also shown. Enriched and depleted cell populations are indicated with e and d, respectively. b Cell neighbourhood analyses showing seven cell populations that each contribute at least 3% of the neighbouring non-tumour cells at three distances yielding medians of 3, 30 and 100 neighbouring cells, respectively. Populations significantly more abundant near the PIGR+ and PTGS1+ clones are indicated in blue and with *, and in pink with #, respectively. Ligand-receptors signalling between tumour subclones and cells in their microenvironment involving: c Ligands up-regulated in the PIGR+ subclone, d Ligands up-regulated in the PTGS1+ subclone, e Receptors up-regulated in the PIGR+ subclone, f Receptors up-regulated in the PTGS1+ subclone. Secreted ligands and plasma membrane ligands are indicated by red and blue bars, respectively. Magma palette used; dark pixels indicate strongest signalling and white indicates no signalling. Autocrine loops are indicated with a. Receptors and ligands needed to be detected in ≥ 10% of cells from a cell type to be shown. Note: only 281 of 828 ligands and 229 of 691 receptors in connectomeDB2020 are covered on the CosMx platform, thus many subclone-specific signalling events are likely missed in this analysis.

References

    1. Sung H, et al. Global Cancer Statistics 2020: GLOBOCAN Estimates of Incidence and Mortality Worldwide for 36 Cancers in 185 Countries. CA Cancer J. Clin. 2021;71:209–249. doi: 10.3322/caac.21660. - DOI - PubMed
    1. Bowtell DD, et al. Rethinking ovarian cancer II: reducing mortality from high-grade serous ovarian cancer. Nat. Rev. Cancer. 2015;15:668–679. doi: 10.1038/nrc4019. - DOI - PMC - PubMed
    1. Zhang S, et al. Both fallopian tube and ovarian surface epithelium are cells-of-origin for high-grade serous ovarian carcinoma. Nat. Commun. 2019;10:5367. doi: 10.1038/s41467-019-13116-2. - DOI - PMC - PubMed
    1. Labidi-Galy SI, et al. High grade serous ovarian carcinomas originate in the fallopian tube. Nat. Commun. 2017;8:1093. doi: 10.1038/s41467-017-00962-1. - DOI - PMC - PubMed
    1. Cancer Genome Atlas Research Network. Integrated genomic analyses of ovarian carcinoma. Nature474, 609–615 (2011). - PMC - PubMed