. 2024 Apr 3;15(1):2880.
doi: 10.1038/s41467-024-46947-9.

Genomic language model predicts protein co-regulation and function

Affiliations

Genomic language model predicts protein co-regulation and function

Yunha Hwang et al. Nat Commun. .

Abstract

Deciphering the relationship between a gene and its genomic context is fundamental to understanding and engineering biological systems. Machine learning has shown promise in learning latent relationships underlying the sequence-structure-function paradigm from massive protein sequence datasets. However, to date, limited attempts have been made in extending this continuum to include higher order genomic context information. Evolutionary processes dictate the specificity of genomic contexts in which a gene is found across phylogenetic distances, and these emergent genomic patterns can be leveraged to uncover functional relationships between gene products. Here, we train a genomic language model (gLM) on millions of metagenomic scaffolds to learn the latent functional and regulatory relationships between genes. gLM learns contextualized protein embeddings that capture the genomic context as well as the protein sequence itself, and encode biologically meaningful and functionally relevant information (e.g. enzymatic function, taxonomy). Our analysis of the attention patterns demonstrates that gLM is learning co-regulated functional modules (i.e. operons). Our findings illustrate that gLM's unsupervised deep learning of the metagenomic corpus is an effective and promising approach to encode functional semantics and regulatory syntax of genes in their genomic contexts and uncover complex relationships between genes in a genomic region.


Conflict of interest statement

A provisional patent (App. Serial No.: 63/491,019) on this work was filed by Harvard University with YH and SO as inventors. The remaining authors declare no competing interests.

Figures

Fig. 1
Fig. 1. gLM training and inference schematics.
A For training, contigs (contiguous genomic sequences) containing up to 30 genes are first translated into proteins, which are subsequently embedded using a protein language model (pLM) encoder (ESM2). Masked inputs are generated by random masking at 15% probability and genomic language model (gLM; a transformer encoder) is trained to make four predictions for each masked protein, with associated likelihoods. Training loss is calculated on both the prediction and likelihoods. B At inference time, inputs are generated from a contig using ESM2 output. Contextualized protein embeddings (hidden layers of gLM) and attention patterns are used for various downstream tasks. See Supplementary Fig. 1 for detailed schematics. Source data are provided as a Source Data file.
Fig. 2
Fig. 2. Contextualized protein embedding analysis and comparison with concepts in natural language modeling.
A A word upon contextualization can be mapped to embedding space. For many words, the semantic meaning varies in different types of literature, and therefore their contextualized embeddings cluster with source text type. Figure was created for qualitative visualization. B The input protein embedding (output of ESM2 and context-free protein embedding) is the same across all occurrences of the protein in the database. Upon contextualization with gLM, contextualized protein embeddings of the same protein (last hidden layer of gLM at inference time) cluster with biome type, analogous to the source text type in natural language (A). Contextualization of 30 other multi-biome MGYPs can be found in Supplementary Fig. 3. C A word’s meaning upon contextualization varies across a continuous spectrum and can be ambiguous even with contextualization (e.g. double entendre). D Reaction 1, carried out by the MCR complex, either backward (Methanotrophy) or forward (Methanogenesis). E Principal Component Analysis (PCA) of context-free protein embeddings of McrA sequences in genomes (total explained variances = 0.56), colored by metabolic classification of the organism (ANME, methanogen) based on previous studies and labeled by class-level taxonomy. F PCA of contextualized McrA embeddings (total explained variance = 0.68), where gLM embeddings cluster with the direction of Reaction 1 that the MCR complex is likely to carry out. G Geometric relationship between contextualized protein embeddings based on the semantic closeness of words. H Input (context-free) protein embeddings of Cas1, Cas2, lipopolysaccharide synthases (LPS) and polyketide synthases (PKS) showing clustering based on structural and sequence similarity. I Clustering of contextualized protein embeddings where phage defense proteins cluster (Cas1 and Cas2) and biosynthetic gene products cluster (lipopolysaccharide synthases [LPS] and polyketide synthases [PKS]). Source data are provided as a Source Data file.
Fig. 3
Fig. 3. Contextualization of gene function.
A Linear probe enzyme commission (EC) number classification accuracy for pLM (ESM2) representations and gLM (1st hidden layer) representations. Data are presented as mean values +/- standard deviation over five technical replicates. B F1-score comparisons of statistically significant (t-test, two-sided, Benjamini/Hochberg corrected p value < 0.05, technical replicates = 5) differences in performance of pLM- and gLM-based EC number linear probes. EC classes are ordered with the largest gain with contextualization on the left to the largest loss with contextualization on the right. Data are presented as mean values +/- standard deviation. Adjusted p-value (with two significant figures) for each class is specified above the bars. C Precision-Recall curves of pLM- and gLM-based EC number linear probes. D Histogram of variance (# bins = 100) calculated using contextualized embeddings (gLM; orange) and contig-averaged pLM (blue) embeddings of MGYPs that occur at least 100 times in the database. Histograms for unannotated and annotated fraction of the MGYPs are plotted separately and bars are not stacked. Annotated examples in the long right tail include phage proteins and transposases, reflecting their ability to self-mobilize (see annotations of top tens most variant genes in Supplementary Table 4). Source data are provided as a Source Data file.
Fig. 4
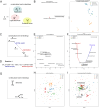
Fig. 4. Attention analysis.
A Correlation coefficients (Pearson’s rho) between attention heads across layers and operons. Darker color corresponds to stronger correlation with previously identified operons. Attention patterns of the second layer-seventh head [L2-H7] is most strongly correlated with the operons. B Three random examples of contigs and predicted operonic relationship between neighboring proteins. Proteins are listed in the order they are encoded in the contig. Ground truth E.coli K-12 operons (top row), raw attention scores in the attention head [L2-H7] most correlated with operons (middle row) and logistic regression prediction using all attention heads (last row) where false positive predictions (or possibly misannotated ground truths in the case of flagellar proteins in the first example) are marked in red. C Five-fold cross-validation precision-recall curves of logistic regression trained using all operons and attention heads. D AAA+ regulator associations characterized using attention-based prediction of operons (Extended Fig. 11A) corresponding to labeled examples in panels E and F. E ESM2 generated input protein embeddings of AAA+ regulator proteins that are structural homologs to TnsC (grey and red; using Foldseek). Structural homologs of TnsC with confirmed involvement in Tn7-like transposons upon manual inspection were designated “TnsC-like AAA+ (manually inspected)” and are colored red. Other MGYP proteins annotated as “TnsC” against the UniRef90 database (orange) were added as positive controls for TnsC function. NuoA (NADH-quinone oxidoreductase subunit A; purple) were added as structural and functional negative controls. DnaB helicases (blues) were added as functional negative controls, as these proteins have similar folds to TnsC but are not associated with transposition. F Combined input protein and context embeddings of genes in panel E. These embeddings are generated through concatenation of pLM (ESM2) embeddings and context (last layer of gLM) embeddings. Negative controls (NuoA and DnaB helicases) form distinct clusters in both E and F. Numbered labels in grey boxes indicate the AAA+ proteins with various functional association predictions listed in panel D and Supplementary Fig. 7. Raw distance based clustering of the embeddings are shown in Supplementary Fig. 8. Source data are provided as a Source Data file.
Fig. 5
Fig. 5. Potential for transfer learning.
A ModA and ModC interaction (protein data bank structure 2ONK) B UMAP projection of predictions (orange) and labels (blues) of paralogs (ModAC shown in A), where correct predictions are colored in green. C Predicted embeddings are colored based on the predicted confidence. Out of distribution predictions and predictions closer to the mean are generally of lower confidence, while correct predictions are of higher confidence. D, E Random 30-gene contigs from representative bacterial (“bac”) and archaeal (“arch”) genomes and reference viral (“vir”) genomes were embedded by mean-pooling ESM2 protein embeddings (context-free contig embeddings, D) and by mean-pooling the last hidden layer of gLM (contextualized contig embeddings, E). F Micro-averaged precision-recall curves and average precisions for logistic regression classifiers trained using context-free contig embeddings (grey lines) and contextualized contig embeddings (colored lines) for class-level taxonomy classification task. Each line represents a fold in stratified k-fold cross-validation (k = 5). Class-level taxonomy for each contig is shown in Supplementary Fig. 9A, B and the confusion matrices for logistic regression classifiers are shown in Supplementary Fig. 9C, D. Source data are provided as a Source Data file.

Similar articles

Cited by

References

    1. Redfern OC, Dessailly B, Orengo CA. Exploring the structure and function paradigm. Curr. Opin. Struct. Biol. 2008;18:394–402. doi: 10.1016/j.sbi.2008.05.007. - DOI - PMC - PubMed
    1. Jumper J, et al. Highly accurate protein structure prediction with AlphaFold. Nature. 2021;596:583–589. doi: 10.1038/s41586-021-03819-2. - DOI - PMC - PubMed
    1. Baek M, et al. Accurate prediction of protein structures and interactions using a three-track neural network. Science. 2021;373:871–876. doi: 10.1126/science.abj8754. - DOI - PMC - PubMed
    1. Rives, A. et al. Biological structure and function emerge from scaling unsupervised learning to 250 million protein sequences. Proc. Natl. Acad. Sci. USA. 118, e2016239118 (2021). - PMC - PubMed
    1. Elnaggar, A. et al. ProtTrans: Toward Understanding the Language of Life Through Self-Supervised Learning. IEEE Trans. Pattern Anal. Mach. Intell. 44, 7112–7127 (2022). - PubMed