. 2024 Apr 3;15(1):2879.
doi: 10.1038/s41467-024-47012-1.

Loss of CREBBP and KMT2D cooperate to accelerate lymphomagenesis and shape the lymphoma immune microenvironment

Affiliations

Loss of CREBBP and KMT2D cooperate to accelerate lymphomagenesis and shape the lymphoma immune microenvironment

Jie Li et al. Nat Commun. .

Abstract

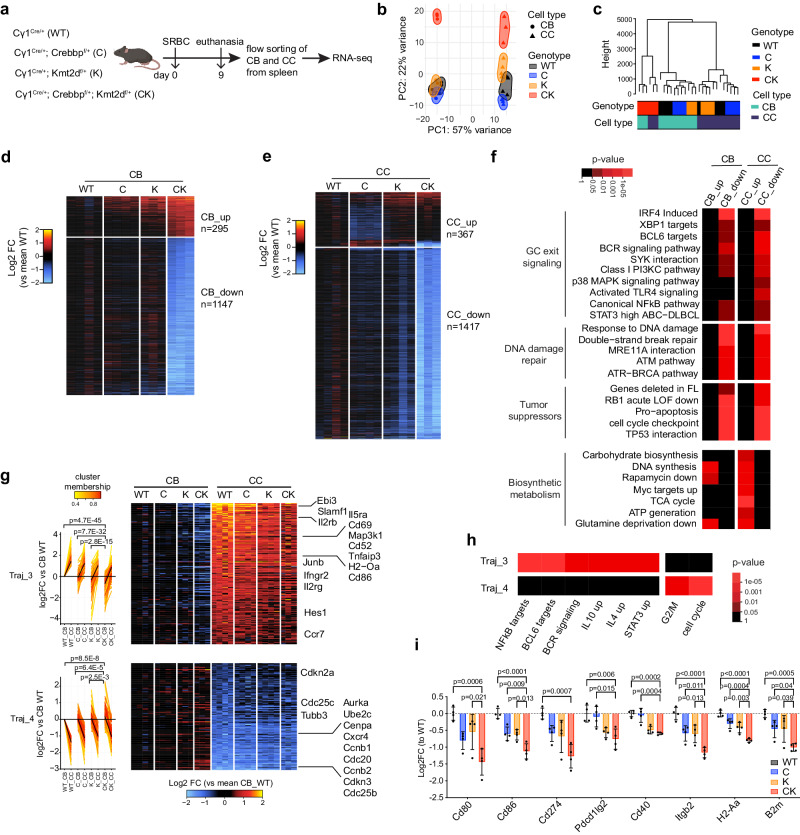
Despite regulating overlapping gene enhancers and pathways, CREBBP and KMT2D mutations recurrently co-occur in germinal center (GC) B cell-derived lymphomas, suggesting potential oncogenic cooperation. Herein, we report that combined haploinsufficiency of Crebbp and Kmt2d induces a more severe mouse lymphoma phenotype (vs either allele alone) and unexpectedly confers an immune evasive microenvironment manifesting as CD8+ T-cell exhaustion and reduced infiltration. This is linked to profound repression of immune synapse genes that mediate crosstalk with T-cells, resulting in aberrant GC B cell fate decisions. From the epigenetic perspective, we observe interaction and mutually dependent binding and function of CREBBP and KMT2D on chromatin. Their combined deficiency preferentially impairs activation of immune synapse-responsive super-enhancers, pointing to a particular dependency for both co-activators at these specialized regulatory elements. Together, our data provide an example where chromatin modifier mutations cooperatively shape and induce an immune-evasive microenvironment to facilitate lymphomagenesis.


Conflict of interest statement

A.M.M. has research funding from Janssen, Epizyme and Daiichi Sankyo. A.M.M. has consulted for Exo Therapeutics, Treeline Biosciences, Astra Zeneca, Epizyme. C.S. has performed consultancy for Seattle Genetics, AbbVie, and Bayer and has received research funding from Bristol Myers Squibb, Epizyme and Trillium Therapeutics Inc. D.W.S. has received honoria from Abbvie, AstraZeneca, Incyte and Janssen and research funding from Janssen and Roche. C.E.M. is a cofounder and board member for Biotia and Onegevity Health as well as an advisor or grantee for Abbvie, ArcBio, Daiichi Sankyo, DNA Genotek, Tempus Labs, and Whole Biome. O.W. has research funding from Incyte and serves in the advisory board of BeiGene. T.J.P. has provided consultation for AstraZeneca, Chrysalis Biomedical Advisors, Merck, and SAGA Diagnostics (compensated); and receives research support (institutional) from AstraZeneca and Roche/Genentech. T.J.P. is an inventor on patents of the CapIG-seq and CapTCR-seq methods held by the University Health Network. R.Z. is inventor on patent applications related to work on GITR, PD-1 and CTLA-4. R.Z. is scientific advisory board member of iTEOS Therapeutics, and receives grant support from AstraZeneca and Bristol Myers Squibb. The remaining authors declare no competing interests.

Figures

Fig. 1
Fig. 1. Combined CREBBP and KMT2D haploinsufficiency accelerates murine lymphomagenesis, featuring a CD8+ T cell-depleted microenvironment.
a Experimental scheme for murine lymphomagenesis. BMT recipients: 8-weeks, female C57BL/6J mice. b Mouse spleen/body weight ratio. Mean ± SD, left to right: n = 6/8/8/8/8 and 6/7/7/7/7 mice. c Representative H&E and B220 IHC images of mouse spleen and lung sections. Scale bars: 200 pixels in spleen and 380 pixels in lung. d FACS analysis showing the frequency of splenic GC B cells (CD38-FAS+). Mean ± SD, n = 4 mice per genotype. e Mutation burden at IgH-VJ558-JH4 region in mouse lymphoma cells. n = 36 clones per genotype. f Kaplan–Meier survival curve of the lymphomagenic mice. n  =  20 mice per group. g, h FACS analysis showing the frequency of splenic (g) CD4+ and (h) CD8+ T cells. Mean ± SD, n = 4 mice per genotype. i, j FACS analysis showing the frequency of splenic naïve/CM/effector CD8 at day 116 (i) or exhausted CD8 (TCF1-TOX+) at day 116 and 235 (j). Mean ± SD, n = 4 mice per genotype. k Representative CD4 and CD8 IHC images of spleen sections. Scale bar = 200 pixels. l IHC based quantification of CD8+ cell frequency within B220+ B cell follicles. Mean ± SD, n = 7 mice per genotype. m Representative CD8 IHC images of human FL tissue microarrays (TMAs). Scale bar = 100 pixels. n CD8+ cell percentage among overall cellularity in human FL TMAs (left to right: n = 23, 43, 53, 109). Kruskal–Wallis test followed by Dunn’s multiple comparisons test. The box middle line marks the median. The vertical size of box denotes the interquartile range (IQR). The upper and lower hinges correspond to the 25th and 75th percentiles. The upper and lower whiskers extend to the maximum and minimum values that are within 1.5 × IQR from the hinges. o A summary of lymphoma microenvironment change in BCL2 + CK vs BCL2. Up and down arrows indicate population increase or decrease respectively in BCL2 + CK vs BCL2. CD8cm/eff/act/ex: central memory/effector/activated/exhausted CD8. P values were determined using ordinary one-way ANOVA followed by Tukey–Kramer’s multiple comparisons test (b, d, gj, l), two-tailed Wilcoxon rank sum test (e), two-tailed log-rank test (f). Source data are provided as a Source Data file.
Fig. 2
Fig. 2. CREBBP and KMT2D haploinsufficiency cooperatively induces hyperplastic GCs with superior fitness.
a Experimental scheme for GC characterization (results shown in bh). 8-weeks, female C57BL/6J background mice were used. b, d, h FACS analysis showing the frequency of splenic total B cells (b, B220+), GC B cells (d, CD38-FAS+), and (h) CB (CXCR4hiCD86lo) / CC (CXCR4loCD86hi) ratios. Mean ± SD, left to right: n = 2/5/5/5/5 (b, d) or 3/4/4/4 (h) mice. c Representative FACS plots showing the gating strategy and relative frequency of splenic GC B cells, CB and CC. e B220 (green), Ki67 (red), and DAPI (blue) IF images of spleen sections. Bottom images show the zoom-in of outlined areas in top images. Scale bars: 1000 um (top), 200 um (bottom). fg Quantification of (f) GC area (left to right: n = 119, 91, 122, 95 GCs) and (g) relative GC number normalized to spleen section area (mean ± SD, n = 5 mice per genotype). i Experimental design for fitness study (results shown in jm). BMT recipients: 8-weeks, female B6.SJL mice. j Representative FACS plots showing the gating strategy and relative frequency of indicated splenic cell types (left to right: total B, GC B, EdU+ GC B cells). WT and CK-derived cells were separated as CD45.1/2 and CD45.2/2, respectively. k FACS data showing the proportion of WT and CK-derived splenic total B cells. Each pair of connected dots represents a mouse (n = 7 mice). l, m FACS data showing the ratio of WT or CK-derived GC B cell percentage to their respective parental total B cell percentage (l) or EdU+ GC B cell percentage to their respective parental total GC B cell percentage (m). Each pair of connected dots represents a mouse (n = 7 mice). P values were determined using ordinary one-way ANOVA followed by Tukey-Kramer’s post-test (d, g, h), Kruskal–Wallis test followed by Dunn’s multiple comparisons test (f), two-tailed paired Student’s t test (km). Source data are provided as a Source Data file.
Fig. 3
Fig. 3. RNA-seq reveals cooperative perturbation of intra-GC transcriptional transitions by CREBBP and KMT2D haploinsufficiency.
a Experimental scheme for RNA-seq profiling of CB and CC (results shown in bh). 8-weeks, female C57BL/6J background mice were used. b PCA of RNA-seq datasets. WT/C/K/CK: n = 4/4/3/3 mice (CB), n = 4/4/4/3 mice (CC). c Dendrogram showing the hierarchical clustering result of RNA-seq datasets using the top 10% most variable genes, the Manhattan distance and ward.D2 linkage. d, e Heatmap showing the relative expression levels of the union differentially expressed genes (DEGs) as log2FC (vs mean WT expression) for each genotype in (d) CB and (e) CC. Union DEGs include DEGs defined in at least one pair-wise comparison using WT as control with a significance cut-off of padj < 0.01, |log2FC| > 0.58. Scale factors, based on single-cell RNA-seq UMI counts, were applied to account for total mRNA difference. Each column represents one mouse dataset. f Pathway enrichment analysis for CK vs WT DEGs using Parametric Analysis of Gene Set Enrichment (PAGE). g Fuzzy c-means clustering of RNA-seq datasets identified 8 clusters (named as Traj_1 to Traj_8) with distinct trajectory patterns, Traj_3 and Traj_4 are shown: line plot (left) and heatmap (right) of log2FC expression (vs mean of WT CB). Black lines in the line plot are cluster centroid; genes are colored by the degree of cluster membership. A linear regression model was fit for log2FC expression compared to WT as a function of cell type (CB or CC), genotype (C, K, or CK), and interaction of cell type and genotype. The corresponding p values for the coefficients are shown. h Pathway enrichment analysis using PAGE for Traj_3 and Traj_4 genes. i, RT-qPCR of indicated genes in sorted GC B cells for each genotype (n = 4 mice per genotype). qPCR signal was normalized as log2FC (vs mean WT) and presented as mean ± SEM. P values were calculated by one-tailed hypergeometric test (f, h) and ordinary one-way ANOVA followed by Tukey–Kramer’s multiple comparisons test (i). Source data are provided as a Source Data file.
Fig. 4
Fig. 4. CREBBP and KMT2D haploinsufficiency cooperatively skews the GC B cell fate toward CB over exit differentiation into MB and PC.
ae Single-cell RNA-seq profiling of splenic B220+IgD cells sorted from SRBC-immunized mice (8-weeks, female, C57BL/6J background) at day 10. a UMAP plot showing identified cell types, with GC B cell subtypes color highlighted. b Seurat dot plot showing the average expression and percent of cells expressing the indicated gene signatures in different GC B subtypes. c Bar plot depicting the proportion of different GC B subtypes in each genotype. d Cell density plot showing the distribution of different GC B subtypes along a Slingshot pseudotime axis anchored at CB. e Top, gene signature module scores were plotted for each cell along the pseudotime axis, with a best fit spline curve representing the average score. Gray bands represent 95% confidence intervals. Bottom, differential expression was shown as a delta spline plot across pseudotime and colored based on statistical significance for each bin. f, g FACS analysis showing the relative abundance of MB (f, n = 5 mice per genotype) or PC (g, left to right: n = 5/5/4/5 mice) vs GC B cells at day 10 post-SRBC (mean ± SD). h Experimental scheme for CD40L blocking assay (results shown in i, j n = 5 mice per group). i FACS data showing the ratio of WT, C, K or CK-derived GC B cell percentage to their respective parental total B cell percentage in either control IgG or CD40L blocking antibody treated mice. Each pair of connected dots represents a mouse, two-tailed paired Student’s t test. j GCB (CD45%) / B cell (CD45%) ratio fold change (i.e., C/WT, K/WT, and CK/WT) in either control IgG or CD40L blocking antibody treated mice, mean ± SD, two-tailed unpaired Student’s t test. k Graphical representation depicting the cell state transitions within GC. Upward and downward black arrows indicate cell abundance increase and decrease respectively in CK vs WT. P values were determined using two-tailed Fisher’s exact test (c), two-tailed Wilcoxon rank sum test (d, e), ordinary one-way ANOVA followed by Tukey–Kramer’s post-test (f, g). Source data are provided as a Source Data file.
Fig. 5
Fig. 5. CREBBP and KMT2D haploinsufficiency cooperatively disrupts dynamic enhancer accessibility remodeling required for intra-GC cell state transitions.
a, b PCA plot (a) and Dendrogram showing the hierarchical clustering (b) of mouse GC B cell ATAC-seq datasets. WT/C/K/CK: n = 4/4/4/5 mice (8 weeks, female, C57BL/6J background). c K-means clustered heatmap showing the relative ATAC-seq read density of the union differentially accessible peaks (DAPs). Union DAPs include DAPs (padj < 0.01) defined in at least one pair-wise comparison using WT as control. d Aggregate (median) ATAC-seq read intensity plot around peak center (±2kb) for each cluster. e Odds ratio (OR)-based association analysis between each DAP cluster and indicated genomic features. f Genomic feature distribution of indicated DAP bins. g GSEA using CK_Loss target genes (GREAT) as gene set against a ranked CB RNA-seq gene list (CK vs WT). NES, normalized enrichment score. h, i GSEA using ATAC-seq peaks in TADs containing CK downregulated genes in (h) CC or (i) CB as peak set against ranked ATAC-seq peak list (CK vs WT). j Dot plot showing TF motifs enriched at closing ATAC-seq peaks in C, K or CK relative to WT (n = 1125, 4393, 10777 peaks respectively). A multivariate TF regulatory potential model was employed to identify the enriched TFs. Dots are colored by accessibility remodeling score and sized by −log10(padj). k t-SNE plot showing eight distinct clusters (C1–C8) among union histone mark and ATAC-seq peaks. l t-SNE plot of indicated relative (log2FC) ATAC-seq read density. m Heatmaps showing median read density of the indicated histone marks or ATAC-seq (left), or relative (median log2FC) ATAC-seq (middle) and RNA-seq (right) signal for each cluster. Distance to TSS plot shows the distance of union peaks to their closest TSSs. n GSEA using ATAC-seq peaks in TADs containing Trajectory_3 genes (Fig. 3g) as peak set against ranked ATAC-seq peak list (CK vs WT). P values were calculated by two-tailed Fisher’s exact test (e), an empirical phenotype-based permutation test and adjusted for gene set size and multiple hypotheses testing (gi, n), two-tailed Student’s t test and BH-adjusted for multiple comparisons (j). Source data are provided as a Source Data file.
Fig. 6
Fig. 6. CREBBP and KMT2D form a complex, whereby they reciprocally regulate each other’s chromatin binding and histone modifying activity.
a PCA plot of isogenic OCI-Ly7 RNA-seq datasets (n = 2 per genotype). b GSEA using CK-downregulated genes in OCI-Ly7 as gene set against ranked BCCA cohort GCB-DLBCL patients RNA-seq gene list based on CK vs epigenetic WT (epiWT, no mutations in CREBBP, KMT2D, and EZH2). The p value was calculated by an empirical phenotype-based permutation test. The FDR is adjusted for gene set size and multiple hypotheses testing. c t-SNE plot showing eight distinct clusters (C1-C8) among union CUT&RUN peaks. d t-SNE plots showing VST normalized counts of indicated histone marks or RNA in WT OCI-Ly7 cells. e t-SNE plots showing read density changes (log2FC, vs WT) for indicated histone marks and RNA. f Heatmaps showing median read density (left) or read density changes (median log2FC) of indicated histone marks (middle) or RNA (right) for each cluster. Distance to TSS plot shows the distance of union peaks to their closest TSSs. g, h Average signal profiles (top) and heatmaps (bottom) displaying (g) H3K4me1 and (h) H3K27ac signals at C1 peak regions. i Venn diagram displaying overlap between CREBBP and KMT2D ChIP-seq peaks in OCI-Ly7. j Genomic feature annotation of CREBBP and KMT2D ChIP-seq peaks. k Co-IP showing interaction between endogenous CREBBP and KMT2D in OCI-Ly7. l, m ChIP-qPCR of (l) KMT2D and (m) CREBBP at indicated gene loci in isogenic OCI-Ly7 cells. ChIP signals were normalized to input and then to WT and presented as mean ± SD. n Functional annotation of C1 genes (n = 401) by Enrichr and Toppgene,. o Experimental design for OCI-Ly7 and human CD8 in vitro co-culture assay. CEF is a pool of HLA class I-restricted virus peptides. p, q FACS analysis showing the frequency of different CD8 subtypes (p) or cytokine-producing CD8 cells (q, DP: IFNγ+TNFa+, DN: IFNγ-TNFa-) in CEF-treated co-cultures. Mean ± SD, n = 3 wells per co-culture. P values were calculated by two-tailed unpaired Student’s t test and BH-adjusted for multiple comparisons (l, m, p, q). Source data are provided as a Source Data file.
Fig. 7
Fig. 7. CREBBP and KMT2D haploinsufficiency cooperatively impairs activation of super-enhancers controlling GC B cell fate decisions.
a, c, d Left: box plots showing C/K/CK deficiency-induced changes in chromatin accessibility in mouse GC B cells (a, enhancers: n = 33,448, super-enhancers: n = 3746), or H3K27ac in OCI-Ly7 cells (c, enhancers: n = 2737, super-enhancers: n = 616) at enhancer and constituent super-enhancer peaks, or changes in the target gene expression of CK-co-bound promoters, enhancers, and super-enhancers in OCI-Ly7 cells (d, n = 5411, 1959, 2031 genes respectively). The middle line in the box marks median. The box vertical size denotes IQR. The upper and lower hinges correspond to 25th and 75th percentiles. The upper and lower whiskers extend to the maximum and minimum values that are within 1.5 × IQR from the hinges. Right: bar plots showing the mean log2FC of chromatin accessibility (a), H3K27ac (c), or RNA (d), with error bars indicating 95% confidence intervals (C.I.) of the mean. b Waterfall plot ranking super-enhancers (SE) in mouse GC B cells based on their accessibility change in CK vs WT. Constituent ATAC-seq peaks in each SE were summed before calculating the fold change. Genes linked to red-highlighted closing SEs were downregulated in CK vs WT. e Waterfall plots ranking super-enhancers in OCI-Ly7 cells based on their H3K27ac changes in C (left), K (middle) or CK (right) vs WT. Constituent H3K27ac peaks in each SE were summed before calculating the fold change. Bar colors represent NES values of RNA-seq GSEA, using all genes in each SE-residing TAD as gene signature against ranked gene list based on their expression changes in C/K/CK vs WT. Highlighted genes were downregulated and linked to the corresponding SEs. Red line indicates log2FC cut off of −0.58. f IGV views of normalized histone marks CUT&RUN and RNA-seq signals at the indicated loci in isogenic OCI-Ly7 cells. H3K27ac Hi-ChIP loop calls are depicted as arcs connecting the two interacting loci. Promoters and super-enhancers are shaded in gray and yellow colors, respectively.
Fig. 8
Fig. 8. CREBBP and KMT2D deficiency suppresses a core immune signature in GC B cells that is retained and shared between murine and human lymphomas.
a GSVA analysis using genes downregulated in BCL2 + CK vs BCL2 murine lymphoma cells at day 235 as gene set against human FL RNA-seq datasets (epiWT/C/K/CK: n = 16/10/8/15 patients). The p values were calculated using two-tailed Wilcoxon rank sum test. b Heatmap showing the relative expression levels of CK_consistent_down_genes (n = 196), including genes exhibiting downregulation in at least two of the indicated RNA-seq datasets. c Functional annotation of CK_consistent_down_genes by Enrichr and Toppgene.

Update of

References

    1. Baylin, S. B. & Jones P. A. Epigenetic determinants of cancer. Cold Spring Harb Perspect Biol.8 (2016). - PMC - PubMed
    1. Dawson MA, Kouzarides T. Cancer epigenetics: from mechanism to therapy. Cell. 2012;150:12–27. doi: 10.1016/j.cell.2012.06.013. - DOI - PubMed
    1. Duy, C., Beguelin, W. & Melnick, A. Epigenetic mechanisms in leukemias and lymphomas. Cold Spring Harb. Perspect. Med.10 (2020). - PMC - PubMed
    1. Okosun J, et al. Integrated genomic analysis identifies recurrent mutations and evolution patterns driving the initiation and progression of follicular lymphoma. Nat. Genet. 2014;46:176–181. doi: 10.1038/ng.2856. - DOI - PMC - PubMed
    1. Pasqualucci L, et al. Genetics of follicular lymphoma transformation. Cell Rep. 2014;6:130–140. doi: 10.1016/j.celrep.2013.12.027. - DOI - PMC - PubMed