. 2024 Apr 3;15(1):2865.
doi: 10.1038/s41467-024-46597-x.

Mesenchymal glioma stem cells trigger vasectasia-distinct neovascularization process stimulated by extracellular vesicles carrying EGFR

Affiliations

Mesenchymal glioma stem cells trigger vasectasia-distinct neovascularization process stimulated by extracellular vesicles carrying EGFR

Cristiana Spinelli et al. Nat Commun. .

Abstract

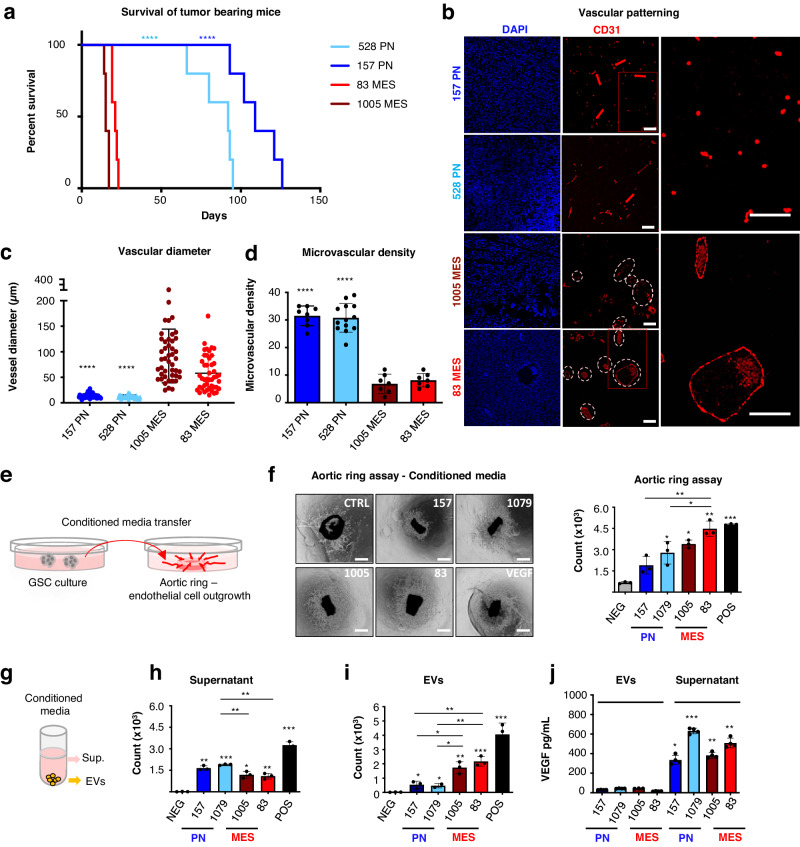
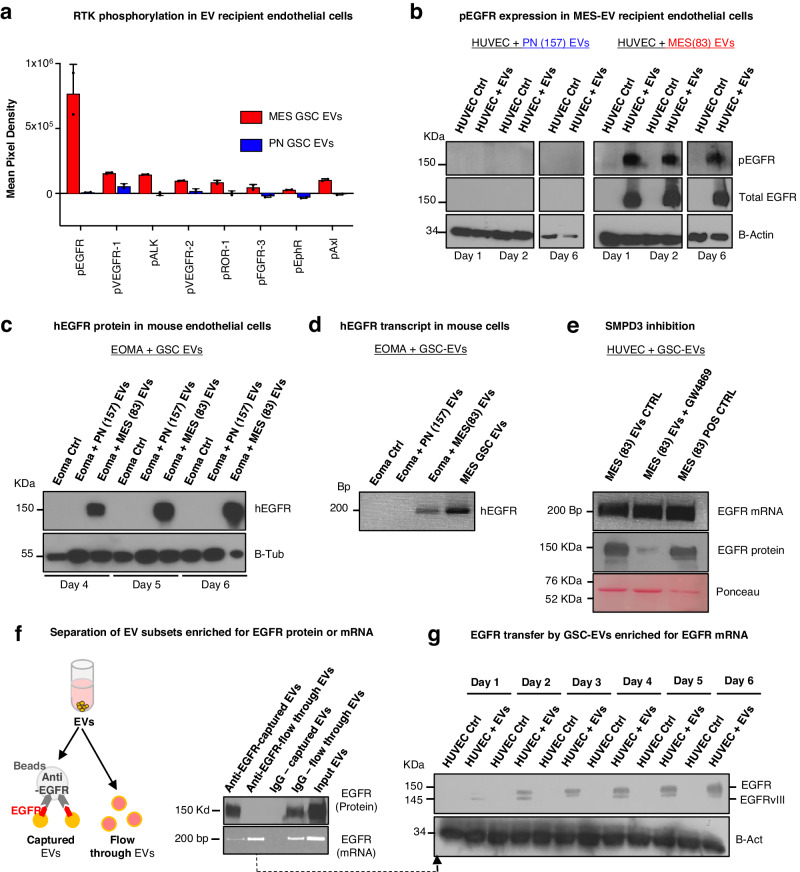
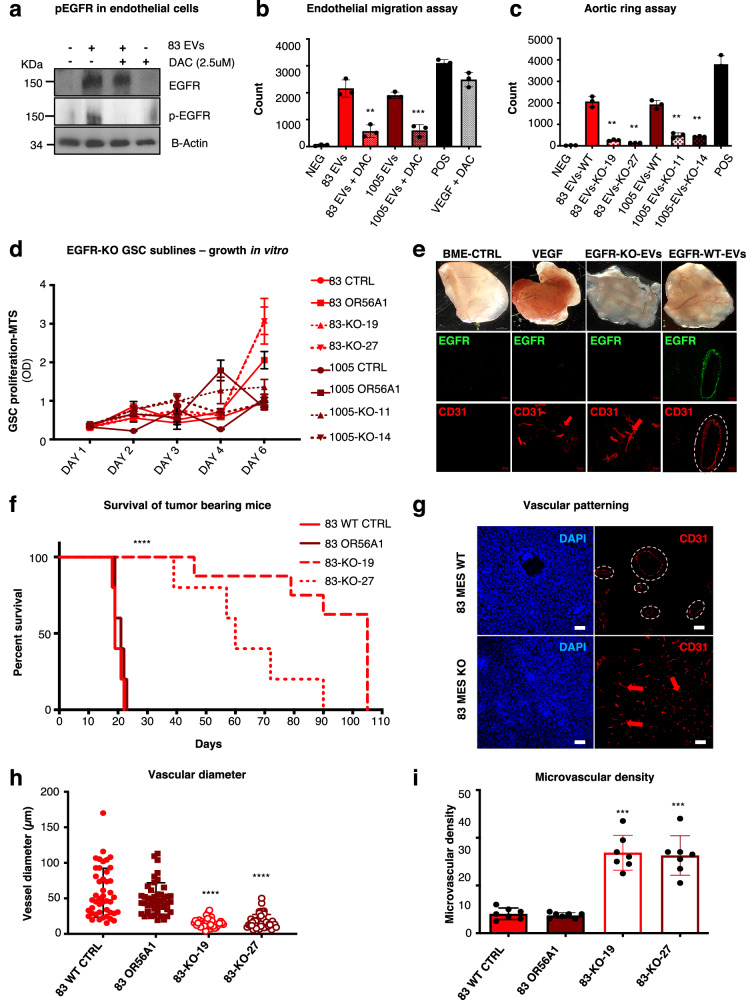
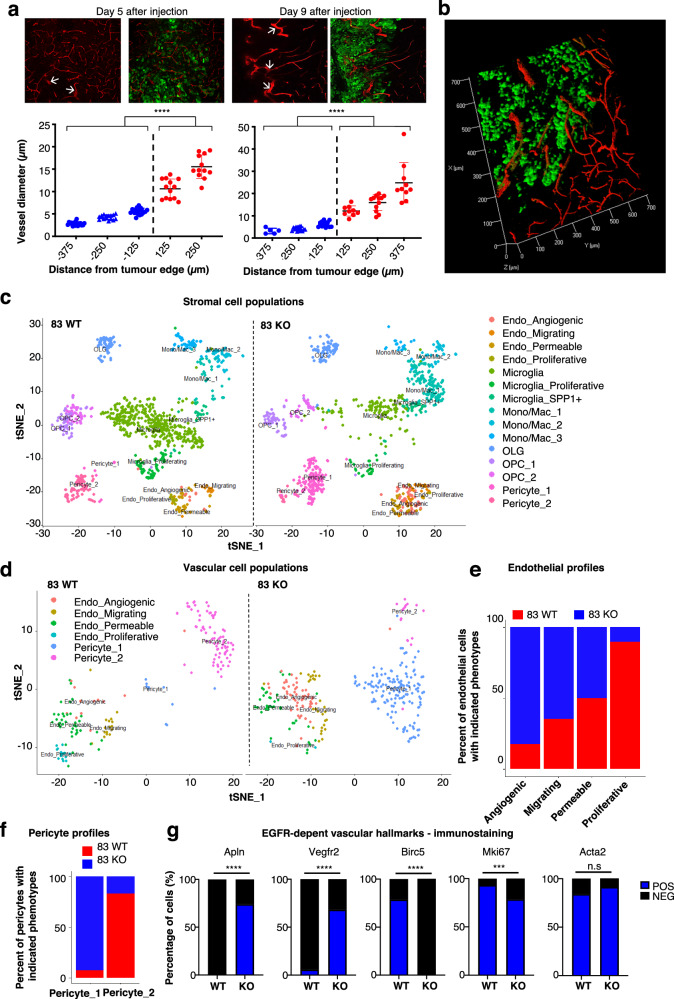
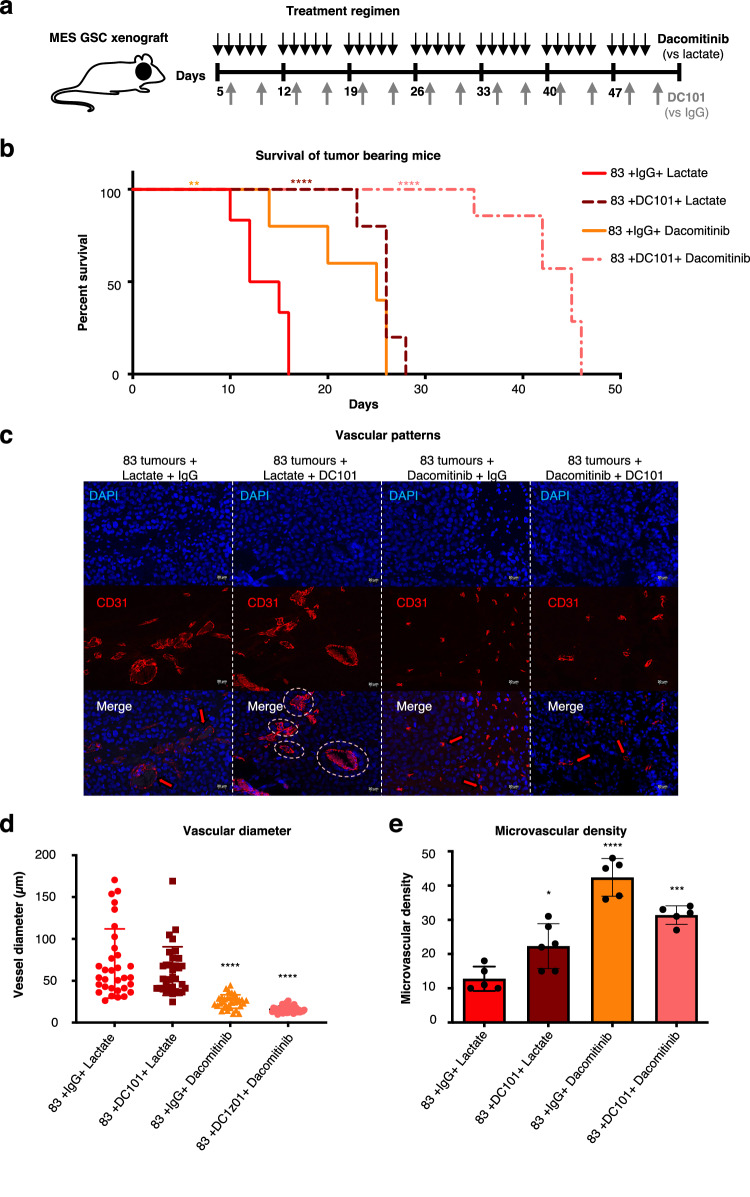
Targeting neovascularization in glioblastoma (GBM) is hampered by poor understanding of the underlying mechanisms and unclear linkages to tumour molecular landscapes. Here we report that different molecular subtypes of human glioma stem cells (GSC) trigger distinct endothelial responses involving either angiogenic or circumferential vascular growth (vasectasia). The latter process is selectively triggered by mesenchymal (but not proneural) GSCs and is mediated by a subset of extracellular vesicles (EVs) able to transfer EGFR/EGFRvIII transcript to endothelial cells. Inhibition of the expression and phosphorylation of EGFR in endothelial cells, either pharmacologically (Dacomitinib) or genetically (gene editing), abolishes their EV responses in vitro and disrupts vasectasia in vivo. Therapeutic inhibition of EGFR markedly extends anticancer effects of VEGF blockade in mice, coupled with abrogation of vasectasia and prolonged survival. Thus, vasectasia driven by intercellular transfer of oncogenic EGFR may represent a new therapeutic target in a subset of GBMs.


Conflict of interest statement

The authors declare no competing interests.

Figures

Fig. 1
Fig. 1. Differential vascular patterns in GSC-driven tumours and vascular activities of soluble and vesicular components of glioma stem cell secretome.
a Kaplan-Meier survival curves of mice bearing PN GSC- and MES GSC-derived tumours. (n = 5 independent experiments. Two-tailed paired t test. P = 0.0000965 and 0.000089) b Representative images of immunofluorescence for CD31 reveal phenotypic vascular differences between tumours driven by PN or MES GSCs. (n = 5 independent experiments). c Quantification of vessel size distribution through tracing CD31 positive endothelial cells. Blood vessels in MES tumours present enlarged lumens, up to 90 μm, compared to a mean vessel diameter of 13 μm in the PN tumours (n = 5 mice/group. Two-tailed paired t test P = 5.48−16 and 1.18−12). d Quantification of microvascular density using CD31 staining (n = 5/group. Two-tailed paired t test. P = 5.25−09 and 2.68−09). Microvascular density was expressed as vessel density per high power field (hpf). Scale bars are 50 µm e Schematic diagram illustrating mouse aortic ring endothelial outgrowth assay using conditioned media derived from different glioma stem cells. f Endothelial responses induced by the GSC conditioned media containing soluble fraction of the secretome and EVs. RhVEGF was used as positive control [25 ng/mL]. Cells were imaged with optical microscope (left) to assess the number of endothelial cells growing out of the ring using FIJI software (right) (n = 6 independent experiments. Two-tailed paired t test. MES P = 7.55−05 and 2.65−04). g Schematic diagram illustrating secretome fractions preparation using centrifugation methods. h Endothelial responses induced by the GSC secretome. Mouse aortic rings were seeded under domes of BME and cultured in growth factors-enriched media. After rings began to form endothelial outgrowth (often referred to as ‘sprouts’) they were treated with supernatant fractions (PN P = 0.00037 and 3.31609−06. MES P = 0.0010 and 0.00073) or with (i) 30 μg/mL of EVs  obtained from either PN GSC (157;1079), or MES GSC (83; 1005). RhVEGF was used as positive control [25 ng/mL]. The number of endothelial cell outgrowths from the ring was assessed using FIJI software. (n = 6 wells/3 independent experiments. Two-tailed paired t test. PN P = 0.0229 and 0.0023. MES P = 0.0021 and 0.00037). j VEGF content distribution in EVs and in supernatant fractions of GSC conditioned media. ELISA assay quantification showed that the growth factor is virtually absent in EVs, and preferentially released in soluble form into the culture media supernatant (n = 4 independent experiments. Two-tailed paired t test. PN P = 1.21−05 and 1.30−08. MES P = 8.08−06 and 9.83−07). Results are shown as mean ± SD; *p < 0.05, **p < 0.01, ***p < 0.001 treated group versus control group ****P < 0.0001; Detailed data are provided as a Source Data file.
Fig. 2
Fig. 2. Protracted expression of activated EGFR in endothelial cells subjected to extracellular vesicle-mediated transfer of EGFR/EGFRvIII transcript from mesenchymal glioma stem cells.
a Quantification of the human phospho-RTK expression array; analysis performed with EVs from either PN or MES EVs incubated with primary endothelial cells (HUVEC) for 7 days (n = 4 wells/2 independent experiments). Data are presented as mean values ± SD; b Endothelial cells incubated with EVs from PN or MES EVs followed by protein extraction and western blot to analyse the expression of EGFR. The transfer resulted in lasting ectopic activation of EGFR in HUVEC up to 6 days. β-Actin was used as loading control. (n = 3 independent experiments); c Glioma stem cell-derived EGFR+ EVs were incubated with mouse endothelial cells. The transfer of human-specific EGFRvIII was detected for up to 6 days. Mouse β-Tubulin was used as loading control (n = 3 independent experiments); d Glioma stem cell-derived EVs were incubated with mouse endothelial cells enabling transfer of human EGFR. The transfer of human-specific EGFR mRNA was detected only after treatment with MES GSC EVs (n = 3 independent experiments); e Western blot and RT-PCR analysis showed that GW4869 treatment selectively inhibited the shedding of EVs carrying EGFR protein, while EGFR mRNA EVs were not affected (n = 3 independent experiments); f Schematic diagram illustrating the immunoprecipitation approach using magnetic beads crosslinked with anti-EGFR antibody. Western blot and RT-PCR analysis showed a population of EVs enriched for EGFR protein and mostly depleted for EGFR mRNA, while unbound EVs with no EGFR protein were enriched for EGFR mRNA (n = 3 independent experiments); g EGFR status in endothelial cells treated with EVs carrying only EGFR mRNA. Western blot analysis reveals that transfer of EGFR mRNA is sufficient to express EGFR protein in primary endothelial cells for up to 6 days (n = 3 independent experiments); Source data are provided as a Source Data file.
Fig. 3
Fig. 3. Obliteration of GSC-EV-derived EGFR in endothelial cells suppresses cellular responses to extracellular vesicles and alters vascular patterning in vivo.
a Activation of EGFR in endothelial cells following EV transfer from cancer cells is obliterated by the pan-ErbB inhibitor, Dacomitinib. EGFR phosphorylation in primary endothelial cells is completely inhibited by 2.5 μM of Dacomitinib treatment (n = 3 independent experiments); b Dacomitinib inhibition of endothelial cell migration triggered by EGFR-carrying EVs. Endothelial cells were treated with MES EVs or VEGF and 6 h later exposed to 2.5 μM of Dacomitinib. The number of cells migrated was assessed using FIJI software (n = 6 wells/3 independent experiments; two-tailed paired t test P = 0.0022 and 0.00077); c EGFR depletion reduces the ability of GSC EVs to trigger endothelial cell outgrowths. Endothelial cells were treated with 30 μg/ml of EVs obtained from glioma stem cells either deficient (EGFR-KO, clone 19 and 27), or proficient (EGFR-WT) for EGFR. After 3 days of incubation, cells were fixed, stained with crystal violet and imaged (n = 3 independent experiments; two-tailed paired t test; GSC83 (83): P = 0,00024 and 0,00018; GSC1005 (1005): P = 0.00041 and 0.00019); d Proliferation assay reveals similar growth pattern in culture of glioma stem cells deficient (EGFR-KO) or proficient (EGFR-WT) for EGFR (n = 3 independent experiments); e Appearance of freshly removed BME plugs containing indicated agents three weeks after implantation. BME-embedded EVs were obtained from glioma stem cells: EGFR-KO, EGFR-WT, while control plugs contained VEGF, or vehicle. Scale bars are 20 µm (n = 4 independent experiments); f Kaplan-Meier survival curves of mice bearing EGFR-KO and EGFR-WT MES GSC-driven tumours (n = 5 mice per group); g Representative images of immunofluorescence for CD31 reveals differential vascular patterns between tumours driven by EGFR-WT or EGFR-KO MES-GSCs (GSC83). Scale bars are 20 µm; n = 5 independent experiments have been conducted; two-tailed paired t test P = 0,0008; h Quantification of vessel size distribution according to staining for CD31-positive endothelial cells (n = 5 independent experiments; two-tailed paired t test P = 1.45−12 and 3.41−11); i Quantification of microvascular density using CD31 staining (n = 5 independent experiments; two-tailed paired t test P = 1.39−06 and 7.15−06). Microvascular density was expressed as vessel density per high power field (hpf). Data were presented as means ± SD. Significance: **p < 0.01, ***p < 0.001, ****p < 0.0001 of the treated group versus untreated control group; Source data are provided as a Source Data file.
Fig. 4
Fig. 4. Single cells sequencing to profile transcriptomes of vascular structures in human xenograft brain tumours.
a Enlargement of blood vessels diameter within the GSC83 tumour mass was detected 5 and 9 days after injections. Quantification of vessel size distribution was enabled by CD31 staining of endothelial cells (n = 3 independent experiments; two-tailed paired t test P = 4.22−25 and 2.83−14; Data are presented as mean values ± S.D.); b 3D reconstruction of GSC83 (83) tumour xenograft shows enlargement of blood vessels upon entry into the tumour. c T-distributed stochastic neighbour embedding (tSNE) plot shows clustering of murine cells based on gene expression. In both EGFR-KO and EGFR-WT GSC83 tumours cell colour specifies the assignment of cells to one of 15 different clusters inferred using shared nearest neighbour clustering; d tSNE plot of murine endothelial cells and pericytes shows clustering of cells based on gene expression. Two different populations of pericyte are detected and four different subpopulations of endothelial cells are identified, including: angiogenic, migrating, permeable, and proliferative; e Relative proportion of endothelial cell subpopulations in either EGFR-KO or EGFR-WT GSC83 tumours. f Relative proportion of pericyte cell populations in either EGFR-KO or EGFR-WT GSC83 tumours. g Quantification of immunostaining for vascular markers. Birc5 is selectively elevated in endothelial cells associated with vasectasia in EGFR-WT tumours, while Apln and Vegfr2 were upregulated in angiogenic blood vessels in EGFR-KO tumours (n = 3 independent experiments; two-tailed paired t test P = 6.60−23–4.44−06–1.84−16 and 0.00041); Source data are provided as a Source Data file.
Fig. 5
Fig. 5. Combined targeting of VEGFR2 and EGFR suppresses tumour growth and vasectasia.
a Schematic representation of the treatment with EGFR and VEGFR-2 inhibitors. Dacomitinib was administered by gavage at 15 mg/kg for 5 consecutive days followed by a 2-day break, while DC-101 was injected intra-peritoneally at 20 mg/kg, twice a week. Lactate and IgG at corresponding concentrations were injected in parallel, as placebo controls. The mice were treated with single agents alone, or in combination; b Survival curves of mice harbouring mesenchymal glioma stem cell xenografts (GSC83) subjected to a combination therapy targeting VEGF and EGFR pathways. Kaplan-Meier plot depicts groups of mice treated with placebo (IgG + lactate), DC-101 or Dacomitinib alone or with combination therapy of DC-101+ Dacomitinib (n = 5 independent experiments; two-tailed paired t test; P = 0.0075–0.000051 and 0.0000223); c Representative images of immunofluorescent staining for CD31 reveals the impact of therapy on vascular patterns. d Quantification of vessel size distribution based on CD31 staining. Blood vessels in mice treated with placebo (IgG + lactate) and single treatment with DC-101 present enlarged lumen compared to a mean vessel diameter of GSC83 (83) tumours treated with Dacomitinib and combination therapy of DC-101+ Dacomitinib (n = 5 independent experiments; two-tailed paired t test; P = 4.99−08 and 2.18−10); e Quantification of microvascular density following CD31 staining. Microvascular density was increased in tumours treated with Dacomitinib and combination therapy of DC-101+ Dacomitinib as measured by vessel numbers per high power field (hpf; n = 5 independent experiments; two-tailed paired t test; P = 7.92−06 and 1.45−05). Data were presented as means ± SD. Significance: **p < 0.01, ***p < 0.001, ****p < 0.0001 treated group versus untreated control group; Source data are provided as a Source Data file.

References

    1. Wen PY, et al. Glioblastoma in adults: a Society for Neuro-Oncology (SNO) and European Society of Neuro-Oncology (EANO) consensus review on current management and future directions. Neuro Oncol. 2020;22:1073–1113. doi: 10.1093/neuonc/noaa106. - DOI - PMC - PubMed
    1. Jain RK, et al. Angiogenesis in brain tumours. Nat. Rev. Neurosci. 2007;8:610–622. doi: 10.1038/nrn2175. - DOI - PubMed
    1. Singh SK, et al. Identification of human brain tumour-initiating cells. Nature. 2004;432:396–401. doi: 10.1038/nature03128. - DOI - PubMed
    1. Mao P, et al. Mesenchymal glioma stem cells are maintained by activated glycolytic metabolism involving aldehyde dehydrogenase 1A3. Proc. Natl Acad. Sci. USA. 2013;110:8644–8649. doi: 10.1073/pnas.1221478110. - DOI - PMC - PubMed
    1. Richards LM, et al. Gradient of developmental and injury response transcriptional states defines functional vulnerabilities underpinning glioblastoma heterogeneity. Nat. Cancer. 2021;2:157–173. doi: 10.1038/s43018-020-00154-9. - DOI - PubMed