. 2024 Apr 3;15(1):2539.
doi: 10.1038/s41467-024-46300-0.

Eph-ephrin signaling couples endothelial cell sorting and arterial specification

Affiliations

Eph-ephrin signaling couples endothelial cell sorting and arterial specification

Jonas Stewen et al. Nat Commun. .

Abstract

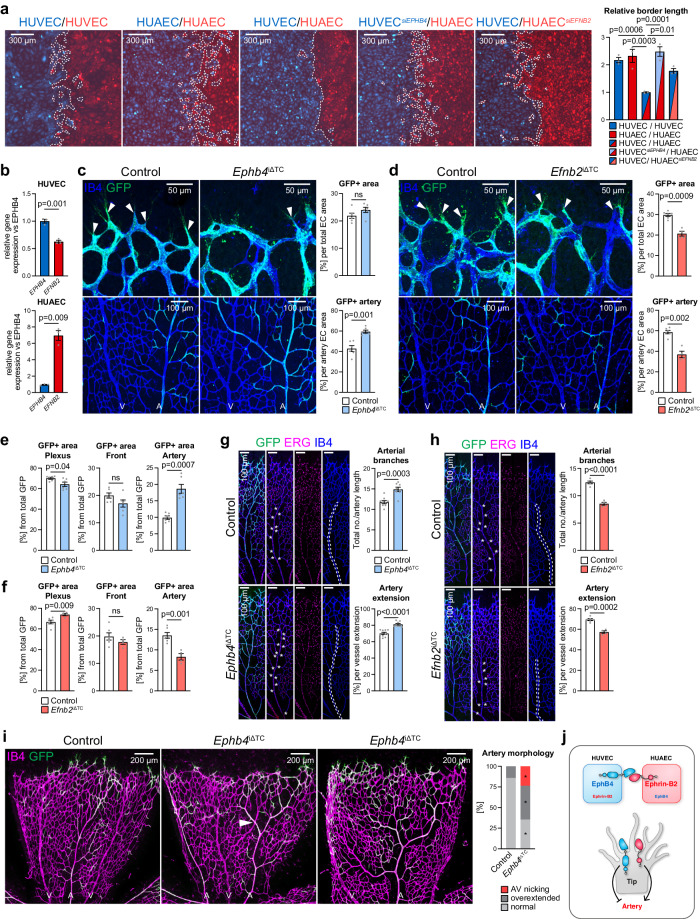
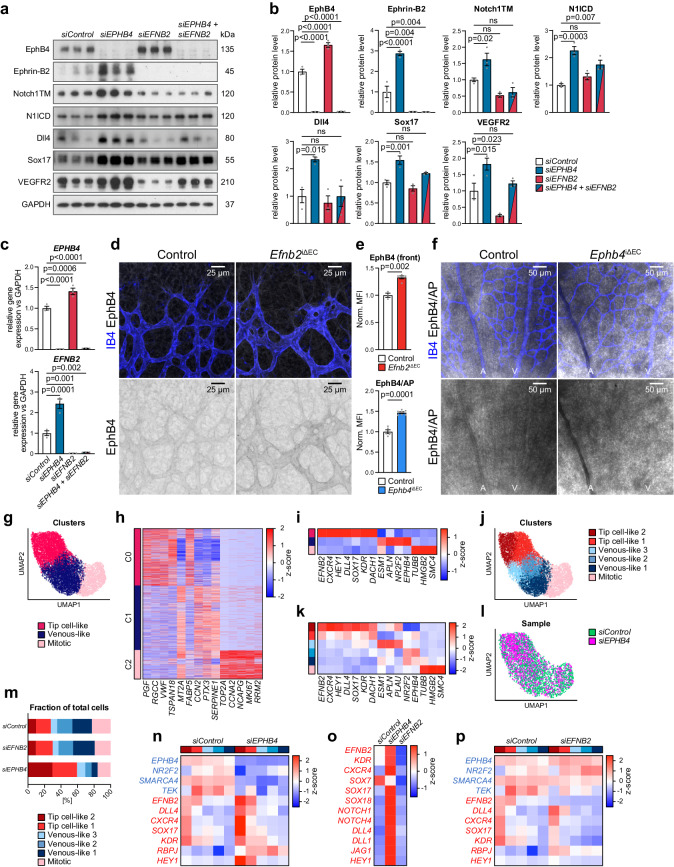
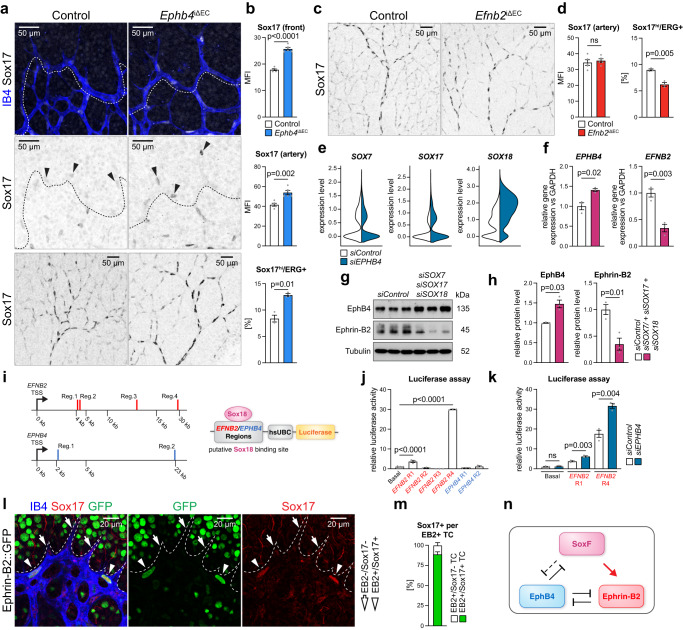
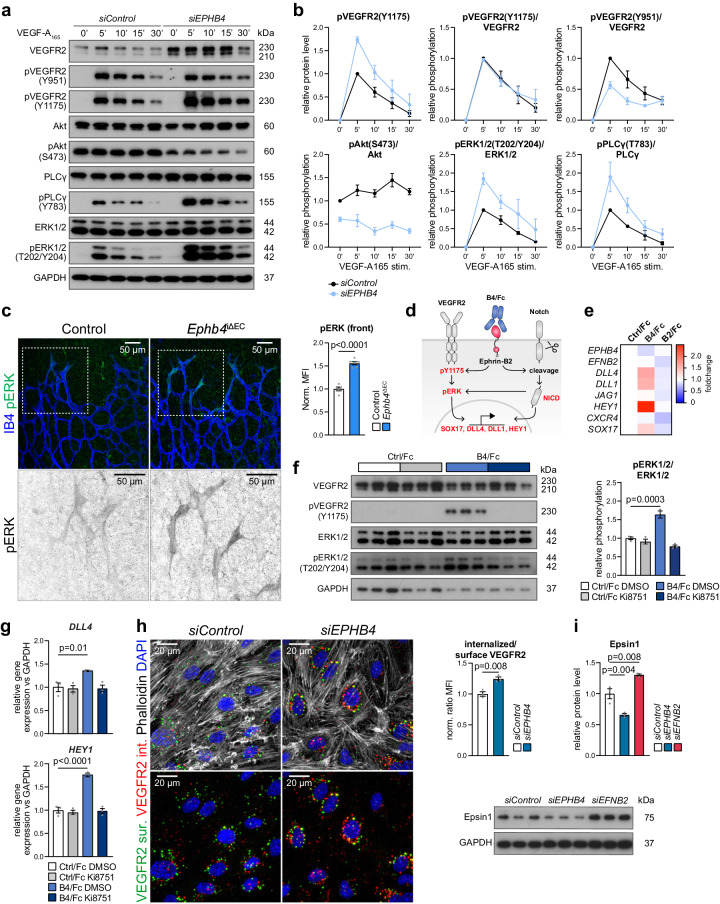
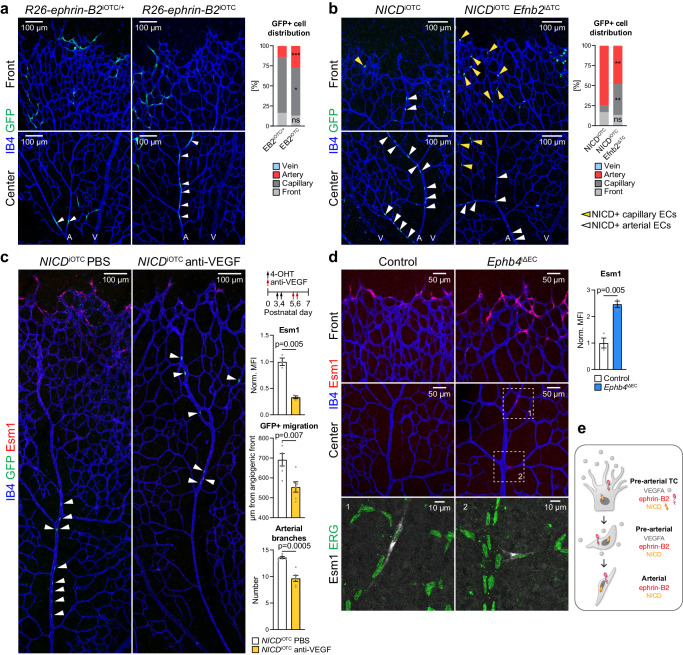
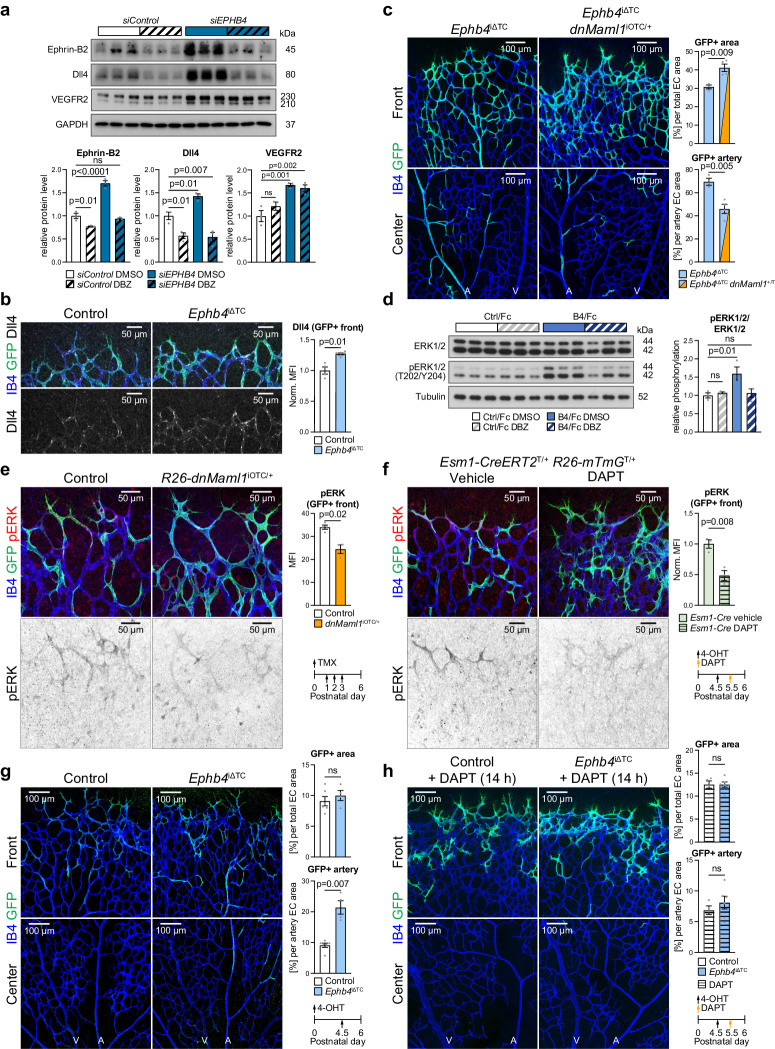
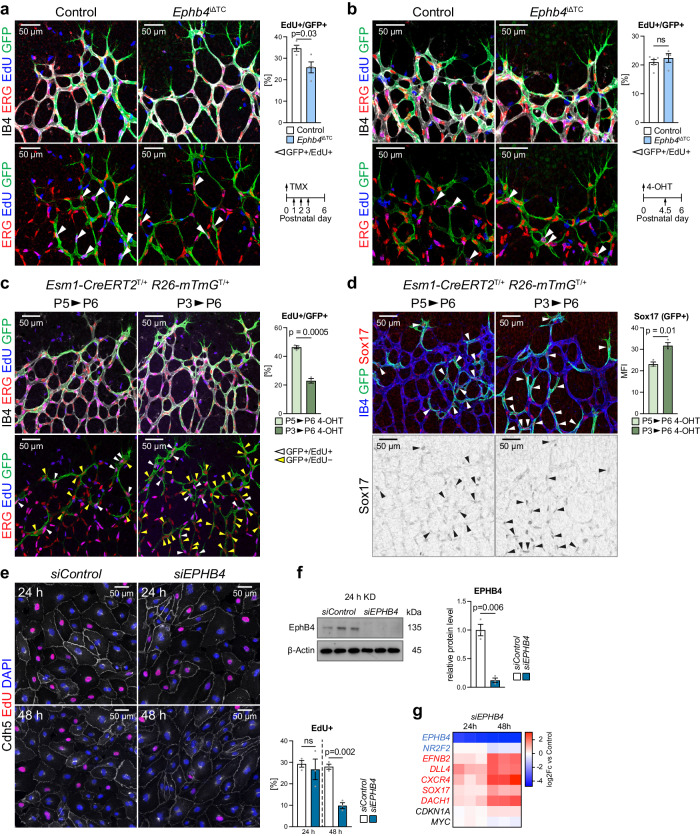
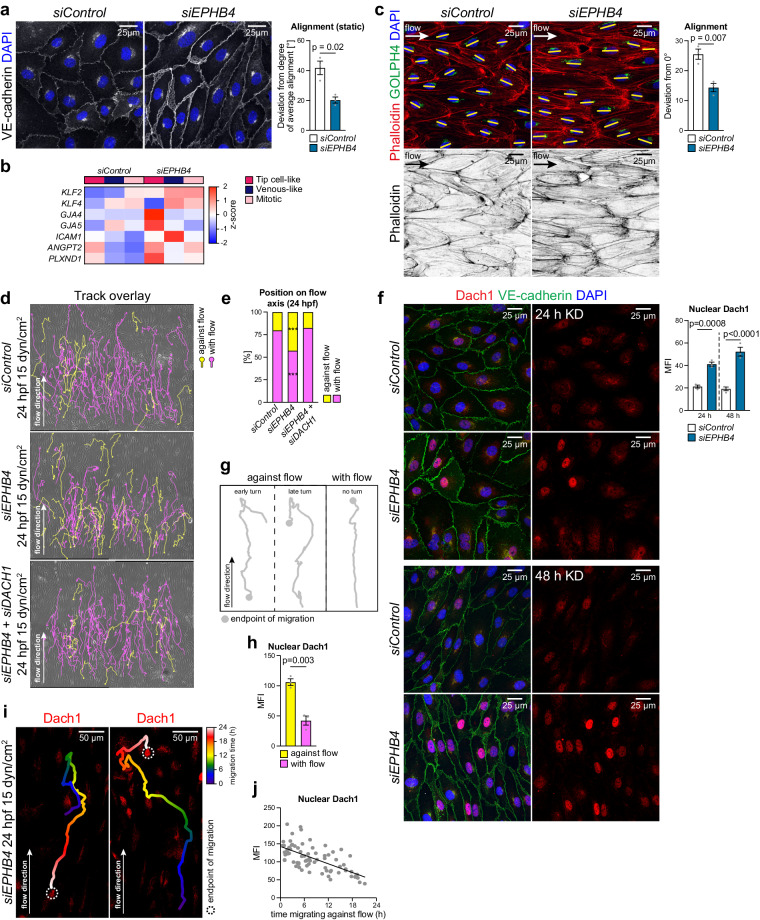
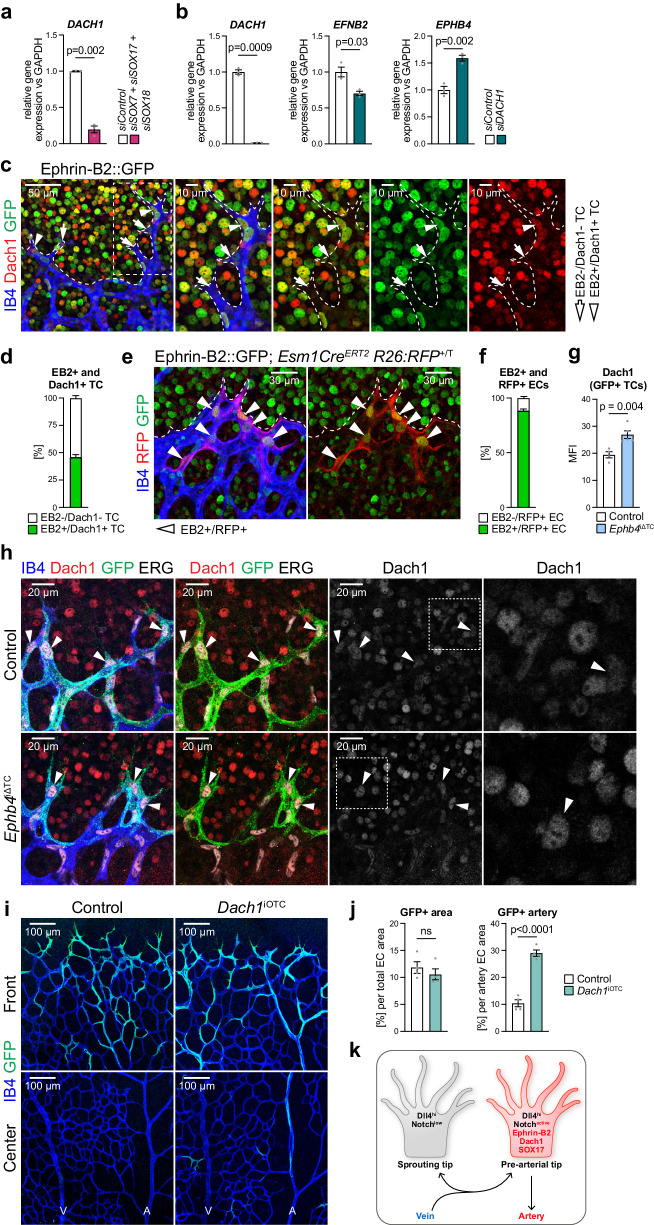
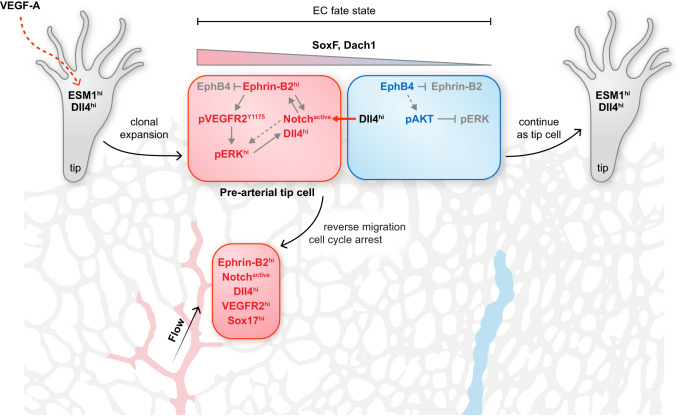
Cell segregation allows the compartmentalization of cells with similar fates during morphogenesis, which can be enhanced by cell fate plasticity in response to local molecular and biomechanical cues. Endothelial tip cells in the growing retina, which lead vessel sprouts, give rise to arterial endothelial cells and thereby mediate arterial growth. Here, we have combined cell type-specific and inducible mouse genetics, flow experiments in vitro, single-cell RNA sequencing and biochemistry to show that the balance between ephrin-B2 and its receptor EphB4 is critical for arterial specification, cell sorting and arteriovenous patterning. At the molecular level, elevated ephrin-B2 function after loss of EphB4 enhances signaling responses by the Notch pathway, VEGF and the transcription factor Dach1, which is influenced by endothelial shear stress. Our findings reveal how Eph-ephrin interactions integrate cell segregation and arteriovenous specification in the vasculature, which has potential relevance for human vascular malformations caused by EPHB4 mutations.


Conflict of interest statement

The authors declare no competing interests.

Figures

Fig. 1
Fig. 1. Ephrin-B2 and EphB4 regulate EC segregation and artery formation.
a Homotypic or heterotypic co-culture of HUVECs and HUAECs, as indicated. Final snapshots of CellTracker-labeled cells imaged for 48 h after removal of Ibidi insert. Quantitation graph for relative border length (n = 3 experiments). b RT-qPCR for EPHB4 and EFNB2 in HUVECs and HUAECs (n = 3 experiments). c, d EphB4 restrains while ephrin-B2 promotes artery growth. High-magnification confocal images of IB4 and GFP stained P6 retinal vasculature (n = 6 control and Ephb4iΔTC mice (c) and n = 6 control and 4 Efnb2iΔTC mice (d)). e, f Quantitation of the GFP+ area (Esm1-derived progeny) in capillary plexus, front and artery per total GFP positive area (n = 6 control and Ephb4iΔTC mice (e) and n = 6 control and 4 Efnb2iΔTC mice (f )). g, h Arteries in Ephb4iΔTC mice are longer and have more branches, while both parameters are reduced in Efnb2iΔTC mice. Graphs show number of arterial branches and artery extension relative to vascular plexus extension (n = 9 control and 8 Ephb4iΔTC mice (g) and n = 6 control and 4 Efnb2iΔTC mice (h)). i Representative images of Ephb4iΔTC retinas with arterial alterations compared to control. Graph shows quantitation of AV retinal crossings, overextended arterial side branches and normal vascular morphology (n = 17 control and 17 Ephb4iΔTC). j Scheme depicting that ephrin-B2-EphB4 interaction and correct levels are required for proper artery formation. P values were calculated by one-way ANOVA (a), two-tailed unpaired t test (bh) and Chi-square test (i). In vivo experiments were performed with tamoxifen injections from P1-P3 with analysis at P6 (c, d, gi). Data are presented as mean values ± SEM. Source data are provided as a Source Data file.
Fig. 2
Fig. 2. EphB4 and ephrin-B2 modulate HUVEC heterogeneity and cell fate plasticity.
a, b Reciprocal regulation of EphB4 and ephrin-B2. Immunoblot analysis of EphB4, ephrin-B2, transmembrane Notch1 (NOTCH1TM), cleaved Notch1 intracellular domain (N1ICD), Dll4, Sox17, VEGFR2 and GAPDH in siControl, siEPHB4, siEFNB2 and siEPHB4 + siEFNB2 HUVEC lysates (n = 3 experiments). c RT-qPCR for EPHB4 and EFNB2 gene expression after EPHB4 and EFNB2 KD in HUVECs (n = 3 experiments). d EphB4 upregulation in Efnb2iΔEC retinal vascular front. e EphB4 immunosignal quantitation (n = 3 control and 5 Efnb2iΔEC mice) and quantitation of EphB4/AP signal (n = 5 control and 7 Ephb4iΔEC mice). f Ephrin-B2 increase in Ephb4iΔEC P6 retina. Indirect ephrin-B2 detection using EphB4/AP protein. g 2D UMAP representation of unbiased Leiden clustering of merged siControl, siEPHB4 and siEFNB2 HUVEC scRNA-seq. h Z-normalized gene expression of top 5 marker genes per Leiden cluster. i Z-normalized gene expression of key cell type markers in Mitotic, Venous-like and Tip cell-like clusters. j 2D UMAP representation of unbiased Leiden sub-clustering. k Z-normalized gene expression of key cell type markers in Mitotic, Venous-like 1-3 and Tip cell-like 1-2 subclusters. l UMAP representation showing increased proportion of siEPHB4 cells in the Tip cell-like clusters relative to siControl. m Fraction distribution of siControl, siEPHB4 and siEFNB2 cells in HUVEC subclusters. n Upregulation of arterial and downregulation of venous genes in siEPHB4 cells. Arterial and venous markers selected from pseudobulk DGE analysis comparing siControl and siEPHB4 subpopulations. o Z-normalized gene expression comparing siControl, siEPHB4 and siEFNB2 HUVECs. p Arterial and venous markers selected from pseudobulk DGE analysis comparing siControl and siEFNB2 subpopulations. P values were calculated using one-way ANOVA (b, c) and two-tailed unpaired t test (e). In vivo experiments were performed with tamoxifen injections at P1-P3 with analysis at P6 (d, f). Data are presented as mean values ± SEM. Source data are provided as a Source Data file.
Fig. 3
Fig. 3. Interplay of EphB4, ephrin-B2 and SoxF factors.
ad Confocal images and quantitation of Sox17 immunostaining in retinal sprouts (b) and artery (b, d) (n = 5 control and 5 Ephb4iΔEC and n = 5 control and 5 Efnb2iΔEC) and percentage of cells with high Sox17 immunosignal vs total ECs (n = 3 control and 3 Ephb4iΔEC and n = 3 control and 3 Efnb2iΔEC) (b, d). e Violin plots of SOX7, SOX17 and SOX18 gene expression from scRNA-seq experiment comparing siControl and siEPHB4 cells. f SoxF factors reduce EPHB4 and increase EFNB2 transcripts (n = 3 experiments). g, h Immunoblot analysis and quantitation of EphB4 and ephrin-B2 protein upon SOX7 + SOX17 + SOX18 knockdown (n = 3 experiments). i Genome localization of Sox18 putative motifs in EFNB2 and EPHB4 human genes selected for further investigation. j Quantitation graphs for luciferase activity of putative binding regions of Sox18 on EFNB2 and EPHB4 showing direct regulation of EFNB2 expression via Sox18 in two regions (n = 3 experiments). k Increased luciferase activity upon EPHB4 KD compared to siControl for Sox18 binding regions on EFNB2 (n = 3 experiments). l Sox17 expression in ephrin-B2+ sprouts (single confocal z-plane). IB4, GFP and Sox17 staining in P6 Efnb2-H2B-GFP knock-in reporter retinal vasculature. m Graph indicating proportion of Sox17+ cells in ephrin-B2+ tip cells (n = 3 Efnb2-GFP mice). n Schematic representation of interactions between Sox17, ephrin-B2 and EphB4. P values were calculated using two-tailed unpaired t test (b, d, f, h) and one-way ANOVA (j, k). In vivo experiments were performed with tamoxifen injections at P1-P3 and analysis at P6 (a, c). Data are presented as mean values ± SEM. Source data are provided as a Source Data file.
Fig. 4
Fig. 4. EphB4 limits VEGFR2 activation, signaling and turnover.
a, b Immunoblot detection and quantitation of VEGFR2 phosphorylation (Y951, Y1175) and downstream signaling molecules, as indicated (n = 3 experiments). c pERK1/2 and IB4 staining of P6 retinal vascular front. Lower panels show higher magnification of inverted pERK1/2 channel from depicted insets. Quantitation graph for pERK1/2 immunosignal (n = 3 control and 3 Ephb4iΔEC mice). d Scheme represents effects downstream of EphB4/Fc (B4/Fc) stimulation. e B4/Fc stimulation promotes HUVEC arterialization, while ephrin-B2/Fc (B2/Fc) inhibits it. Average of mRNA expression fold change for investigated genes upon 30 min stimulation of HUVECs with Ctrl/Fc, B4/Fc or B2/Fc (n = 3 experiments). f VEGFR2 and ERK1/2 activation upon B4/Fc stimulation. Immunoblotting and quantitation of relative pVEGFR2 (Y1175) and pERK1/2 levels in stimulated HUVECs treated with VEGFR2 inhibitor (Ki8751) or vehicle (n = 3 experiments). g VEGFR2 signaling is required downstream of ephrin-B2 stimulation to activate DLL4 and HEY1 expression. RT-qPCR for HEY1 and DLL4 (n = 3 experiments). h Increased internalized VEGFR2 in EPHB4 KD cells. Immunolabeling and quantitation of surface (green) and internalized (red) VEGFR2 in siControl and siEPHB4-treated HUVECs (n = 3 experiments). i EphB4 and ephrin-B2 control Epsin1 levels. Immunoblotting and quantitation of Epsin1 protein levels in siControl, siEPHB4 and siEFNB2 HUVECs (n = 3 experiments). P values were calculated by two-way ANOVA (b), two-tailed unpaired t test (c, h) and one-way ANOVA (eg, i). In vivo experiments were performed with tamoxifen injections at P1-P3 with analysis at P6 (c). Data are presented as mean values ± SEM. Source data are provided as a Source Data file.
Fig. 5
Fig. 5. Interplay of ephrin-B2, VEGF-A and Notch in pre-arterial ECs.
a Distribution of ephrin-B2 overexpressing cells (GFP+) within the retinal vasculature (n = 10 R26-ephrin-B2iOTC heterozygotes and 12 homozygotes). b Confocal images of IB4+ and GFP+ (NICD+) ECs in the P6 retinal vasculature. Graph shows distribution of GFP+ cells (n = 3 control/ NICDiOTC and 3 NICDiOTC; Efnb2iΔTC mice). c Confocal images of vehicle or anti-VEGF treated NICDiOTC animals showing IB4+, Esm1+ and GFP+ (NICD+) ECs. Graphs show quantitation of Esm1 mean fluorescence intensity (MFI), migration distance of GFP+ cells from the vascular front towards the optic disc, and number of arterial branches (n = 3 NICDiOTC vehicle and NICDiOTC treated with anti-VEGF for Esm1 immunostaining, n = 6 NICDiOTC vehicle and NICDiOTC treated with anti-VEGF for migration and arterial branch quantitation). d Esm1 upregulation in the Ephb4iΔEC retinal front vasculature and plexus. Quantitation of Esm1 staining and immunosignal at the vascular front (n = 3 control and 3 Ephb4iΔEC mice). e Scheme depicting the roles of VEGF-A, NICD and ephrin-B2 in arterialization and migration of arterial cells. P values were calculated using two-tailed unpaired t test (ad). In vivo experiments were performed with tamoxifen injections at P1-P3 with analysis at P6 (a, b, d) or 4-OHT injections at P3-P4 followed by anti-VEGF administration at P5-P6 and analysis at P7 (c). Data are presented as mean values ± SEM. Source data are provided as a Source Data file.
Fig. 6
Fig. 6. EphB4 and Notch are linked to ERK1/2 activation.
a Notch inhibition (DBZ) impairs increase in ephrin-B2 and Dll4 in siEPHB4 HUVECs. Immunoblotting and quantitation of ephrin-B2, VEGFR2, and Dll4 in siControl and siEPHB4 cells treated with DBZ or vehicle (n = 3 experiments). b Increased Dll4 expression upon tip cell-specific Ephb4 inactivation. Quantitation of Dll4 immunosignal in the P6 retinal angiogenic front (n = 4 control and 6 Ephb4iΔTC). c Blocking Notch signaling via dominant-negative Mastermind Like Transcriptional Coactivator 1 (Maml1) reduces arterial incorporation of Ephb4iΔTC cells. Graphs show quantitation of total and arterial GFP+ area relative to EC area (n = 3 Ephb4iΔTC and 4 Ephb4iΔTC; R26-dnMaml1iOTC/+). d Reduced ERK1/2 activation upon EphB4/Fc stimulation combined with Notch inhibition. Immunoblot and quantitation of pERK1/2 in stimulated HUVECs treated with Notch inhibitor (DBZ) or vehicle (n = 3 experiments). e Tip cell-specific genetic inhibition of Notch signaling decreases ERK1/2 activation. Confocal images and quantitation of pERK in GFP+ cells at the vascular front of R26-dnMaml1iOTC/+ and control mice (n = 4 control and 3 R26-dnMaml1iOTC/+). f Acute Notch inhibition (DAPT) for 14 h reduces pERK. Graph shows quantitation of pERK MFI in GFP+ cells (n = 3 vehicle and n = 3 DAPT injected Esm1-CreERT2 R26-mTmG+/T animals). g Acute Ephb4 inactivation (single injection with 4-OHT) promotes arterial incorporation of tip cell progeny. Quantitation of total GFP+ area and GFP+ arterial area (n = 6 control and 4 Ephb4iΔTC mice). h Acute Notch inhibition (DAPT) impairs arterial incorporation of Ephb4-depleted ECs. Quantitation of total GFP+ area and of GFP+ area incorporated into artery per total EC area (n = 4 control + DAPT and 6 Ephb4iΔTC + DAPT mice). P values were calculated using two-tailed unpaired t test (b, c, eh) and one-way ANOVA (a, d). In vivo experiments were performed with tamoxifen injections at P1-P3 with analysis at P6 (b, c, e) or 4-OHT injections at P4.5 following analysis at P6 (fh) following analysis at P6. Data are presented as mean values ± SEM. Source data are provided as a Source Data file.
Fig. 7
Fig. 7. First steps of arterial specification precede cell cycle changes.
a Reduced proliferation of tip cell progeny after prolonged Ephb4 inactivation. Quantitation of EdU+/GFP+ progeny in the P6 retinal front area after P1-P3 tamoxifen administration (n = 4 control and 4 Ephb4iΔTC mice). b Proliferation of Ephb4iΔTC ECs is unaffected shortly after gene deletion. Quantitation of EdU+/GFP+ ECs in P6 retinal front area after 4-OHT administration at P4.5 (n = 6 control and 4 Ephb4iΔTC mice). c, d Lineage-tracing of Esm1-derived (GFP+) cells for 24 h and 72 h. Proliferation of GFP+ cells is reduced at 72 h relative to 24 h (c), whereas Sox17 expression is increased (d) (n = 3 for 24 h and 72 h tracing). e Proliferation of siEPHB4 and siControl cells 24 h and 48 h after KD. EPHB4-depleted cells show significantly reduced proliferation only after 48 h of KD (n = 3 experiments). f Validation of EPHB4 knockdown after 24 h by immunoblotting of EphB4 protein and corresponding quantitation (n = 3 experiments). g RT-qPCR of arterial, venous and cell cycle markers in siControl and siEPHB4 HUVECs at 24 h and 48 h after KD. Cell cycle markers are not changed at 24 h, whereas arterial markers are already increased but lower than at 48 h (n = 3 experiments). P values were calculated using two-tailed unpaired t test (ad, f) and one-way ANOVA (e, g). In vivo experiments were performed with tamoxifen injections at P1-P3 (a), 4-OHT injections at P4.5 (b) or 4-OHT injections at P3/P5 (c, d) following analysis at P6. Data are presented as mean values ± SEM. Source data are provided as a Source Data file.
Fig. 8
Fig. 8. EphB4 regulates EC turning under flow through Dach1.
a siEPHB4 HUVECs show partial alignment already in static culture. VE-cadherin and DAPI staining of siControl and siEPHB4 cells at 48 h post-transfection. Graph quantifies deviation (degree) from the average alignment direction per field (n = 3 experiments). b Expression of flow-responsive genes is increased upon EPHB4 KD compared to control. Data selected from pseudobulk DGE analysis comparing siControl and siEPHB4 cells. c Enhanced alignment of siEPHB4 HUVECs under arterial flow (15 dyn/cm2). Quantitation of deviation from 0° angle calculated between the long axis of each cell and flow direction (n = 3 experiments). d, e siEPHB4 promotes EC turning and migration against flow, which requires DACH1 expression. Still images from 24 h movies acquired for siControl, siEPHB4 and siEPHB4/ DACH1 cells exposed to arterial flow. Graph quantifies proportion of cells migrating with (purple) or against flow (yellow) (n = 3 experiments, 80 tracks/experiment selected randomly). f Nuclear Dach1 is increased in siEPHB4 ECs (n = 3 experiments). g, h Dach1 levels are increased during migration against flow. Scheme depicts three different cellular trajectories under flow (n = 3 experiments, 80 randomly selected tracks/experiment). i Representative examples of Dach1 immunostaining of siEPHB4 cells showing high nuclear Dach1 shortly after turning against flow. j Graph indicates strong correlation between the time spent migrating against flow (after turning) and Dach1 nuclear immunosignal (n = 3 experiments, 74 tracks in total). P values were calculated using two-tailed unpaired t test (a, c, h) and one-way ANOVA (eg). Data are presented as mean values ± SEM. Source data are provided as a Source Data file.
Fig. 9
Fig. 9. Ephrin-B2 and Dach1 label pre-arterial tip cells in the retina.
a RT-qPCR for DACH1 showing that SoxF factors positively regulate DACH1 expression (n = 3 experiments). b Dach1 regulates EPHB4 and EFNB2 expression in opposite directions (n = 3 experiments). c, d 50% of retinal sprouts are positive for ephrin-B2 and Dach1. IB4, GFP and Dach1 staining of the P6 Efnb2-H2B-GFP knock-in reporter retinal vasculature. Graph indicating proportion of ephrin-B2+ and Dach1+ tip cells (n = 6 mice). All Dach1+ tip cells are ephrin-B2+. e, f 90% of Esm1-derived progeny (RFP+) are ephrin-B2+ (GFP+). High magnification images of Efnb2-H2B-GFP knock-in mice combined with Esm1-CreERT2 R26-RFP reporter. Graph shows proportion of RFP+ cells being positive or negative for GFP (n = 4 mice). g, h Dach1 expression is increased in Ephb4iΔTC tip cells. IB4, GFP, ERG and Dach1 staining in retinal angiogenic front areas of P6 pups (n = 4 control and 5 Ephb4iΔTC mice). i Acute overexpression of Dach1 in tip cells increases their arterial incorporation. j Quantitation of total GFP+ area and of GFP+ area inside arteries per total EC area (n = 4 control and 4 Dach1iOTC mice). k Schematic depiction of features defining pre-arterial tip cells. P values were calculated using two-tailed unpaired t test (a, b, g, j). In vivo experiments were performed with tamoxifen injections at P1-P3 (e) or 4-OHT injections at P4.5 (h, i) following analysis at P6. Data are presented as mean values ± SEM. Source data are provided as a Source Data file.
Fig. 10
Fig. 10. Schematic depiction of key findings.
VEGF-A induces Esm1 expression in endothelial tip cells. High ephrin-B2 expression, which is linked to low EphB4, in tip cell progeny promotes arterial specification, which involves Notch activation, signaling by VEGFR2 and ERK1/2 together with the expression of the transcription factors SoxF and Dach1.

Similar articles

Cited by

References

    1. Meilhac SM, Buckingham ME. The deployment of cell lineages that form the mammalian heart. Nat. Rev. Cardiol. 2018;15:705–724. doi: 10.1038/s41569-018-0086-9. - DOI - PubMed
    1. Pérez-Pomares JM, Foty RA. Tissue fusion and cell sorting in embryonic development and disease: biomedical implications. Bioessays. 2006;28:809–821. doi: 10.1002/bies.20442. - DOI - PubMed
    1. Kindberg AA, Bush JO. Cellular organization and boundary formation in craniofacial development. Genesis. 2019;57:e23271. doi: 10.1002/dvg.23271. - DOI - PMC - PubMed
    1. Krumlauf R, Wilkinson DG. Segmentation and patterning of the vertebrate hindbrain. Development. 2021;148:dev186460. doi: 10.1242/dev.186460. - DOI - PMC - PubMed
    1. Herzog Y, Guttmann-Raviv N, Neufeld G. Segregation of arterial and venous markers in subpopulations of blood islands before vessel formation. Dev. Dyn. 2005;232:1047–1055. doi: 10.1002/dvdy.20257. - DOI - PubMed