. 2024 Apr 3;14(1):7170.
doi: 10.1038/s41598-024-51324-z.

Spatiotemporal dynamics of cholera epidemics in Ethiopia: 2015-2021

Affiliations

Spatiotemporal dynamics of cholera epidemics in Ethiopia: 2015-2021

Sandra Moore et al. Sci Rep. .

Abstract

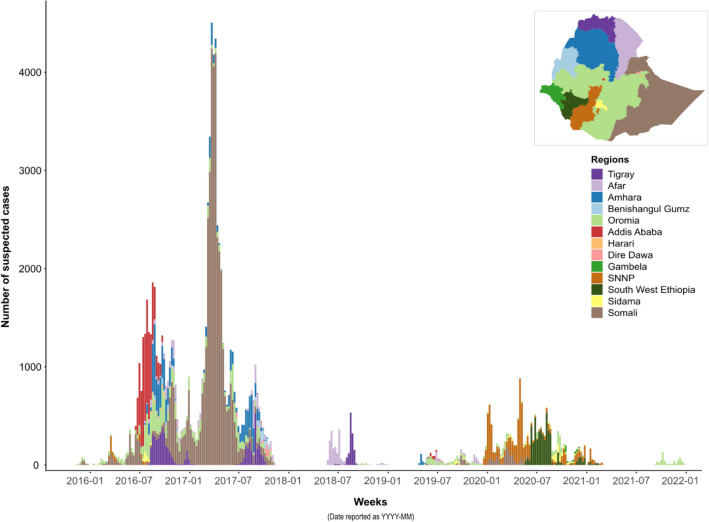
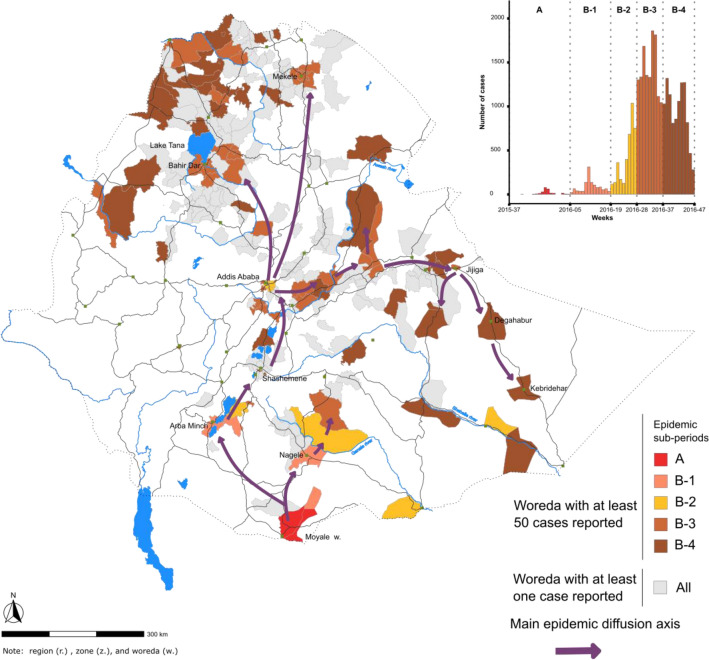
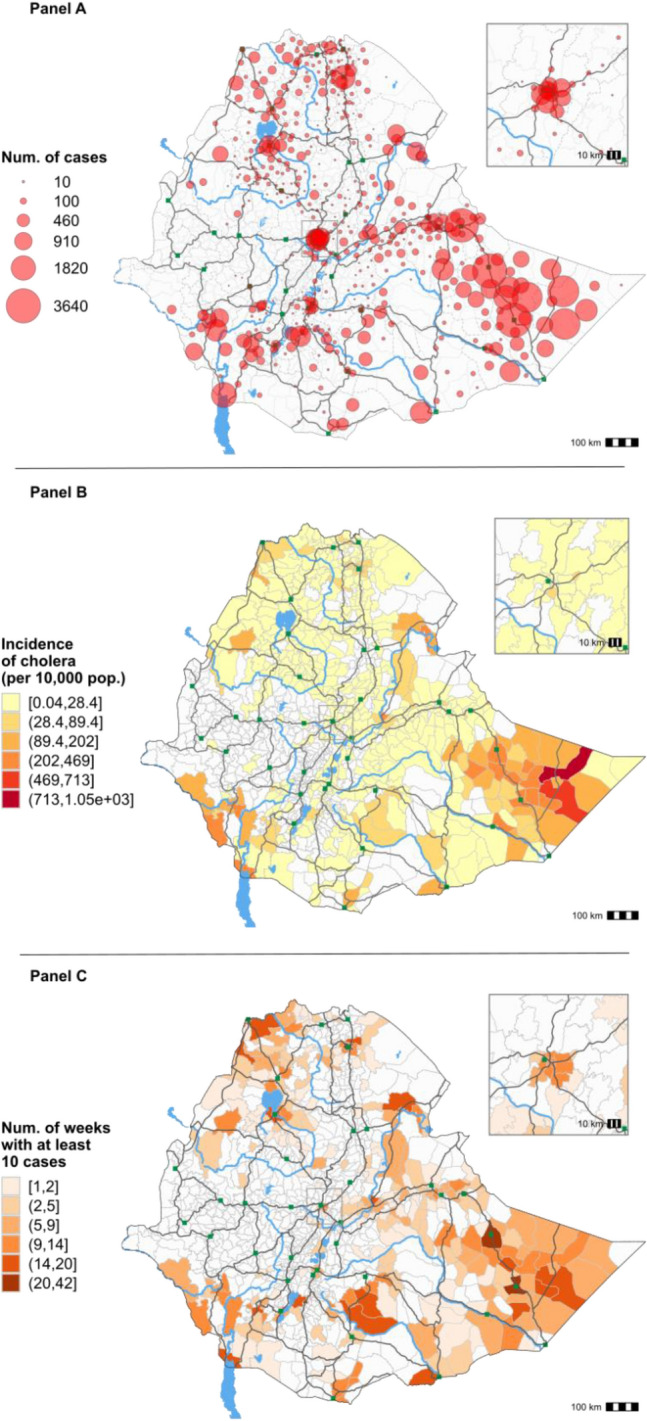
Since the onset of the seventh cholera pandemic, Ethiopia has been affected by recurrent epidemics. However, the epidemiology of cholera in this country remains poorly understood. This study aimed to describe cholera outbreak characteristics in Ethiopia from 2015 to 2021. During this period, Ethiopia experienced four epidemic waves. The first wave involved nationwide outbreaks during the second half of 2016 followed by outbreaks predominantly affecting Somali Region in 2017. The second wave primarily affected Tigray and Afar Regions. During the third wave, multiple smaller-scale outbreaks occurred during 2019. The fourth wave was limited to Bale Zone (Oromia Region) in 2021. Overall, a north to south shift was observed over the course of the study period. Major cholera transmission factors included limited access to safe water and sanitation facilities. Severe weather events (drought and flooding) appear to aggravate cholera diffusion. Cholera transmission between Ethiopia and nearby countries (Kenya and Somalia), likely plays a major role in regional cholera dynamics. Overall, this study provides the first understanding of recent spatiotemporal cholera dynamics in Ethiopia to inform cholera control and elimination strategies.


Conflict of interest statement

The authors declare no competing interests.

Figures

Figure 1
Figure 1
Epidemic curve of suspected cholera cases in each region of Ethiopia from 2015 to 2021.
Figure 2
Figure 2
Distribution of suspected cholera cases by epidemic period in Ethiopia, from 2015 to 2021. The upper part of the figure displays the epidemic curve over the course of the entire study period. For descriptive purposes, the epidemic waves are numbered 1–4, and the epidemic waves are further divided into periods (AI). The lower part of the figure displays the cumulative number of suspected cholera cases in each woreda for each period referenced in the epidemic curve above.
Figure 3
Figure 3
Main cholera transmission foci and diffusion pathways in Ethiopia: wave 1, periods (A) and (B). The map displays the transmission of the first epidemic wave in Ethiopia during the periods (A) and (B) (see epidemic curve in Fig. 2), which are color-coded in the epidemic curve in the top-right corner of the figure. Only outbreaks with at least 50 suspected cases per woreda are indicated in the epidemic curve. Woredas reporting < 50 suspected cases are also shown on the map in gray. The arrows indicate the diffusion pathways based on the spatiotemporal dynamics of the outbreaks in each woreda.
Figure 4
Figure 4
Main cholera transmission foci and diffusion pathways in Ethiopia: wave 1, periods C, D and E. The map displays the transmission of the first epidemic wave in Ethiopia during the periods C–E (see epidemic curve in Fig. 2), which are color-coded in the epidemic curve in the top-right corner of the figure. Only outbreaks with at least 50 suspected cases per woreda are indicated in the epidemic curve. Woredas reporting < 50 suspected cases are also shown on the map in gray. The arrows indicate the diffusion pathways based on the spatiotemporal dynamics of the outbreaks in each woreda.
Figure 5
Figure 5
Main cholera transmission foci and diffusion pathways in Ethiopia: wave 2, period F. The map displays the transmission of the second epidemic wave in Ethiopia during period F (see epidemic curve in Fig. 2). Period F was further divided into three sub-periods, which are color-coded in the epidemic curve in the top-right corner of the figure. Only outbreaks with at least 50 suspected cases per woreda are indicated in the epidemic curve. Woredas reporting < 50 suspected cases are also shown on the map in gray.
Figure 6
Figure 6
Main cholera transmission foci and diffusion pathways in Ethiopia: wave 3, periods G and H. The map displays the transmission of the third epidemic wave in Ethiopia during the periods G and H (see epidemic curve in Fig. 2). Periods G and H were further divided into sub-periods, which are color-coded in the epidemic curve in the top-right corner of the figure. Only outbreaks with at least 50 suspected cases per woreda are indicated in the epidemic curve. Woredas reporting < 50 suspected cases are also shown on the map in gray. The arrows indicate the diffusion pathways based on the spatiotemporal dynamics of the outbreaks in each woreda.
Figure 7
Figure 7
Number of cholera cases per woreda (A), cholera incidence (B) and transmission duration proxy (number of weeks with at least 10 cases reported) (C) by woreda in Ethiopia, from 2015 to 2021. Non-overlapping and left-closed class intervals for incidence and the number of weeks with at least 10 cases are defined using the Jenks natural breaks classification method (R Package ‘classInt’).
Figure 8
Figure 8
Study site map. The map indicates the current administrative divisions in Ethiopia, including the 13 regional states (color-coded) and the woredas in each regional state (boundaries in gray). The green squares correspond to main cities and brown lines indicate primary roads.

References

    1. Kaper JB, Morris JG, Levine MM. Cholera. Clin. Microbiol. Rev. 1995;8(1):48–86. doi: 10.1128/CMR.8.1.48. - DOI - PMC - PubMed
    1. World Health Organization. The Weekly Epidemiological Record. Cholera case and death numbers by country. Available from: https://www.who.int/wer/en/
    1. Pankhurst R. The history of cholera in Ethiopia. Med. Hist. 1968;12(3):262–262. doi: 10.1017/S0025727300013302. - DOI - PMC - PubMed
    1. Weill FX, Domman D, Njamkepo E, Tarr C, Rauzier J, Fawal N, et al. Genomic history of the seventh pandemic of cholera in Africa. Science. 2017;358(6364):785–789. doi: 10.1126/science.aad5901. - DOI - PubMed
    1. Dinede G, Abagero A, Tolosa T. Cholera outbreak in Addis Ababa, Ethiopia: A case-control study. PLoS One. 2020;15(7):e0235440. doi: 10.1371/journal.pone.0235440. - DOI - PMC - PubMed