. 2024 Apr;26(4):519-529.
doi: 10.1038/s41556-024-01380-4. Epub 2024 Apr 3.

Proliferation-driven mechanical compression induces signalling centre formation during mammalian organ development

Affiliations

Proliferation-driven mechanical compression induces signalling centre formation during mammalian organ development

Neha Pincha Shroff et al. Nat Cell Biol. 2024 Apr.

Abstract

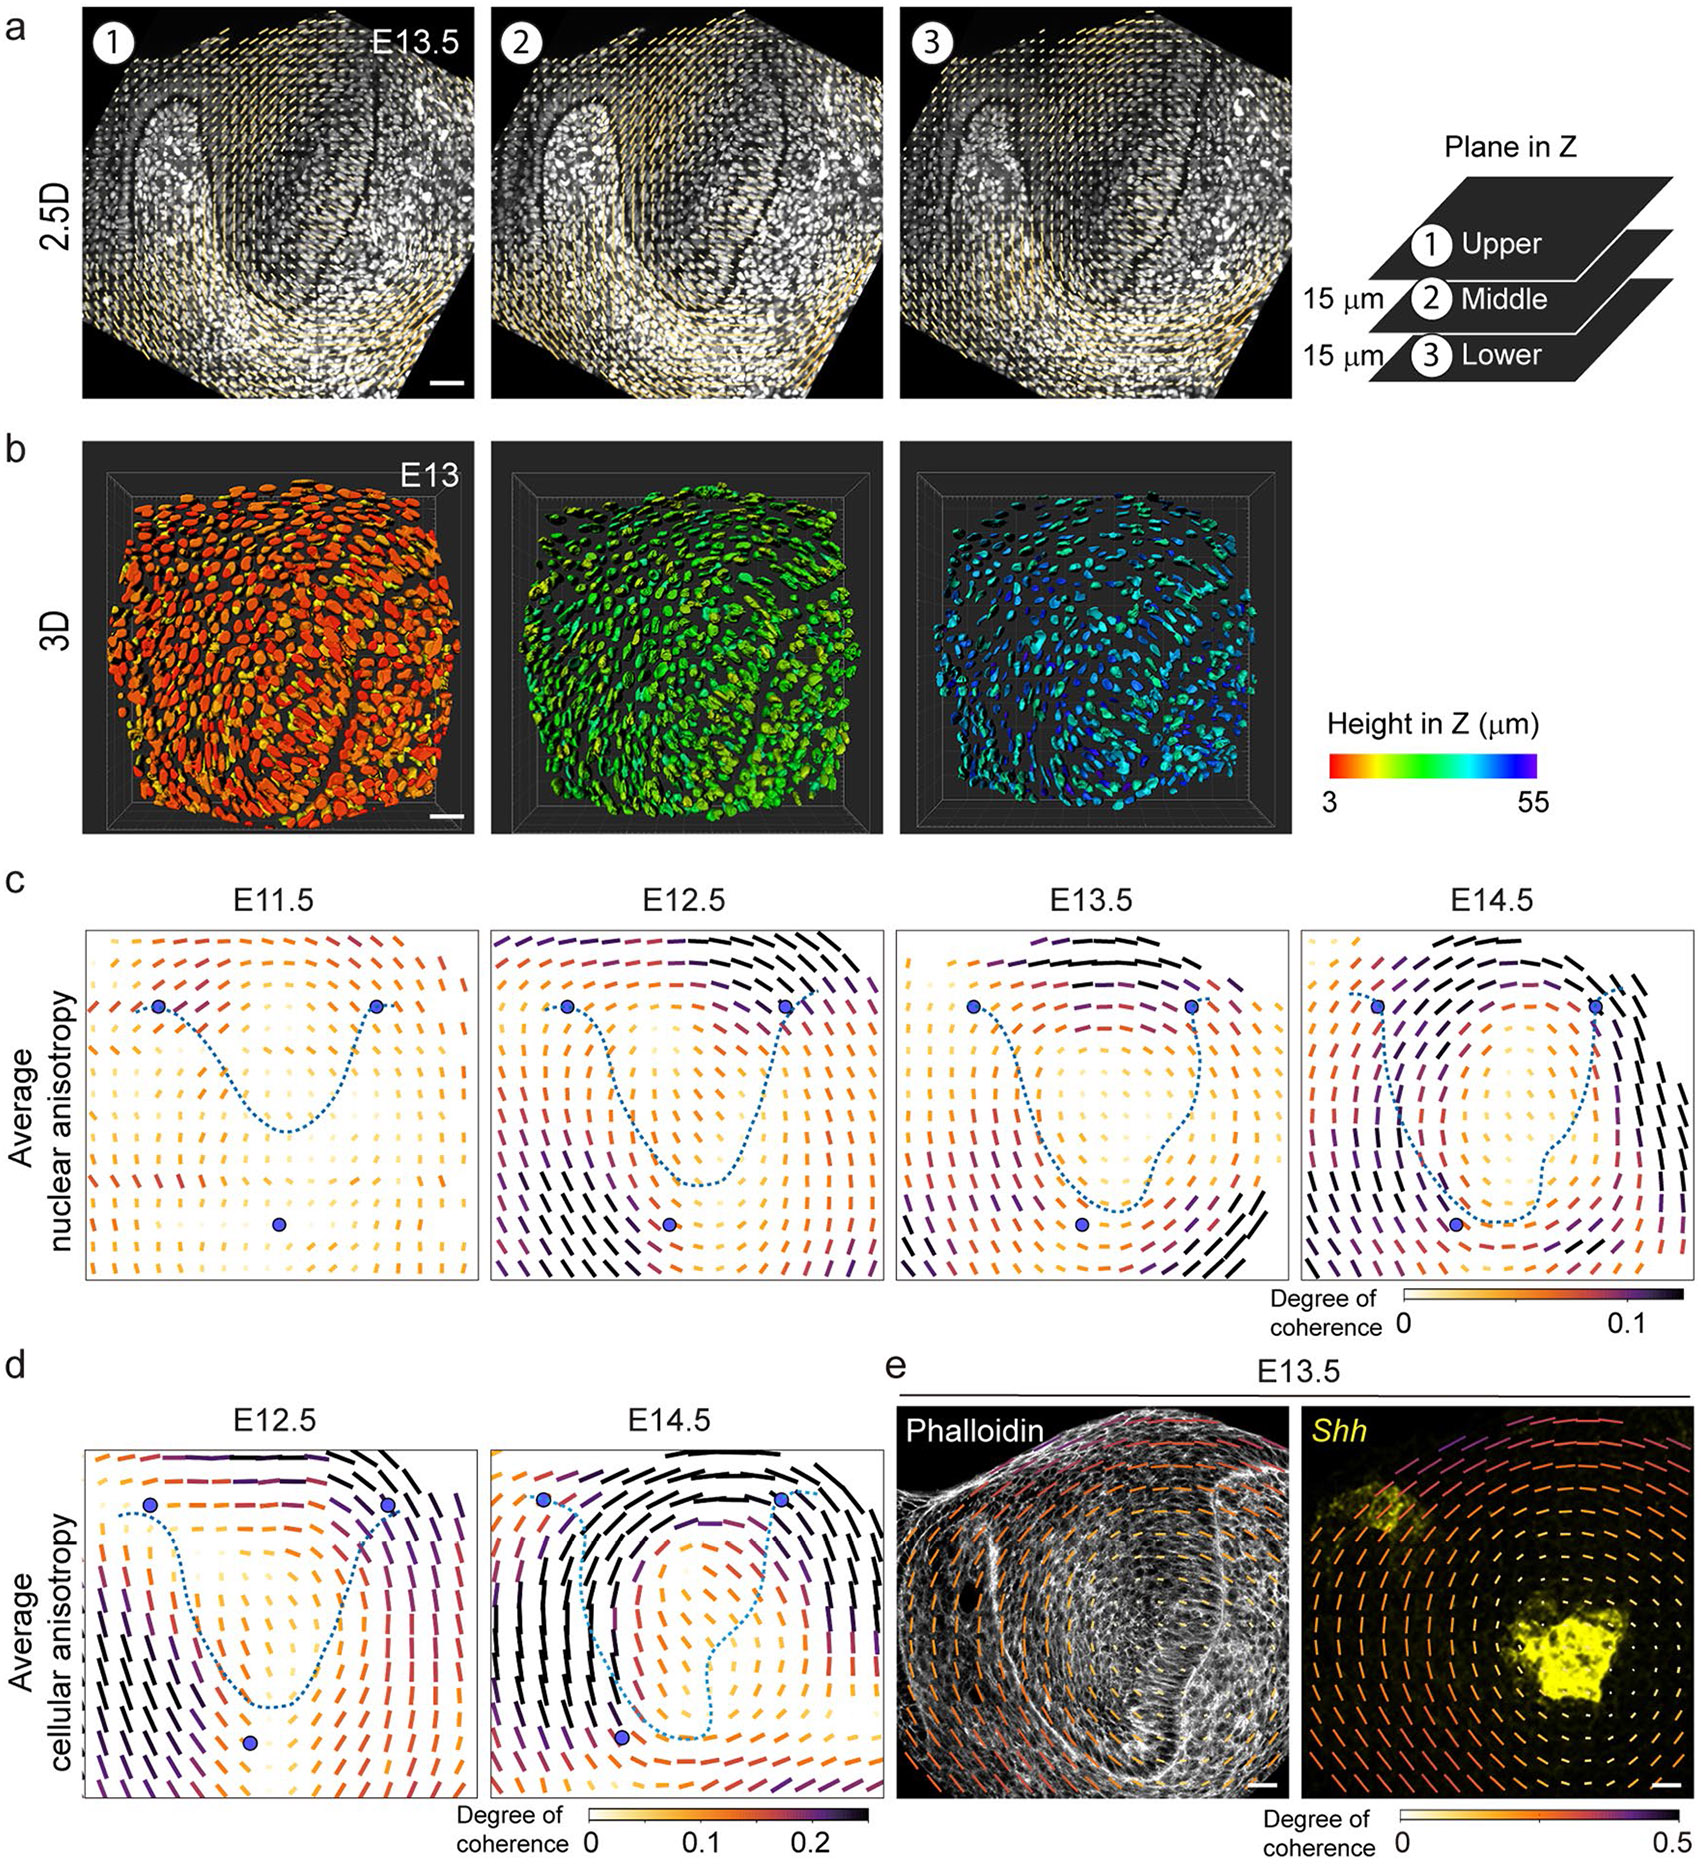
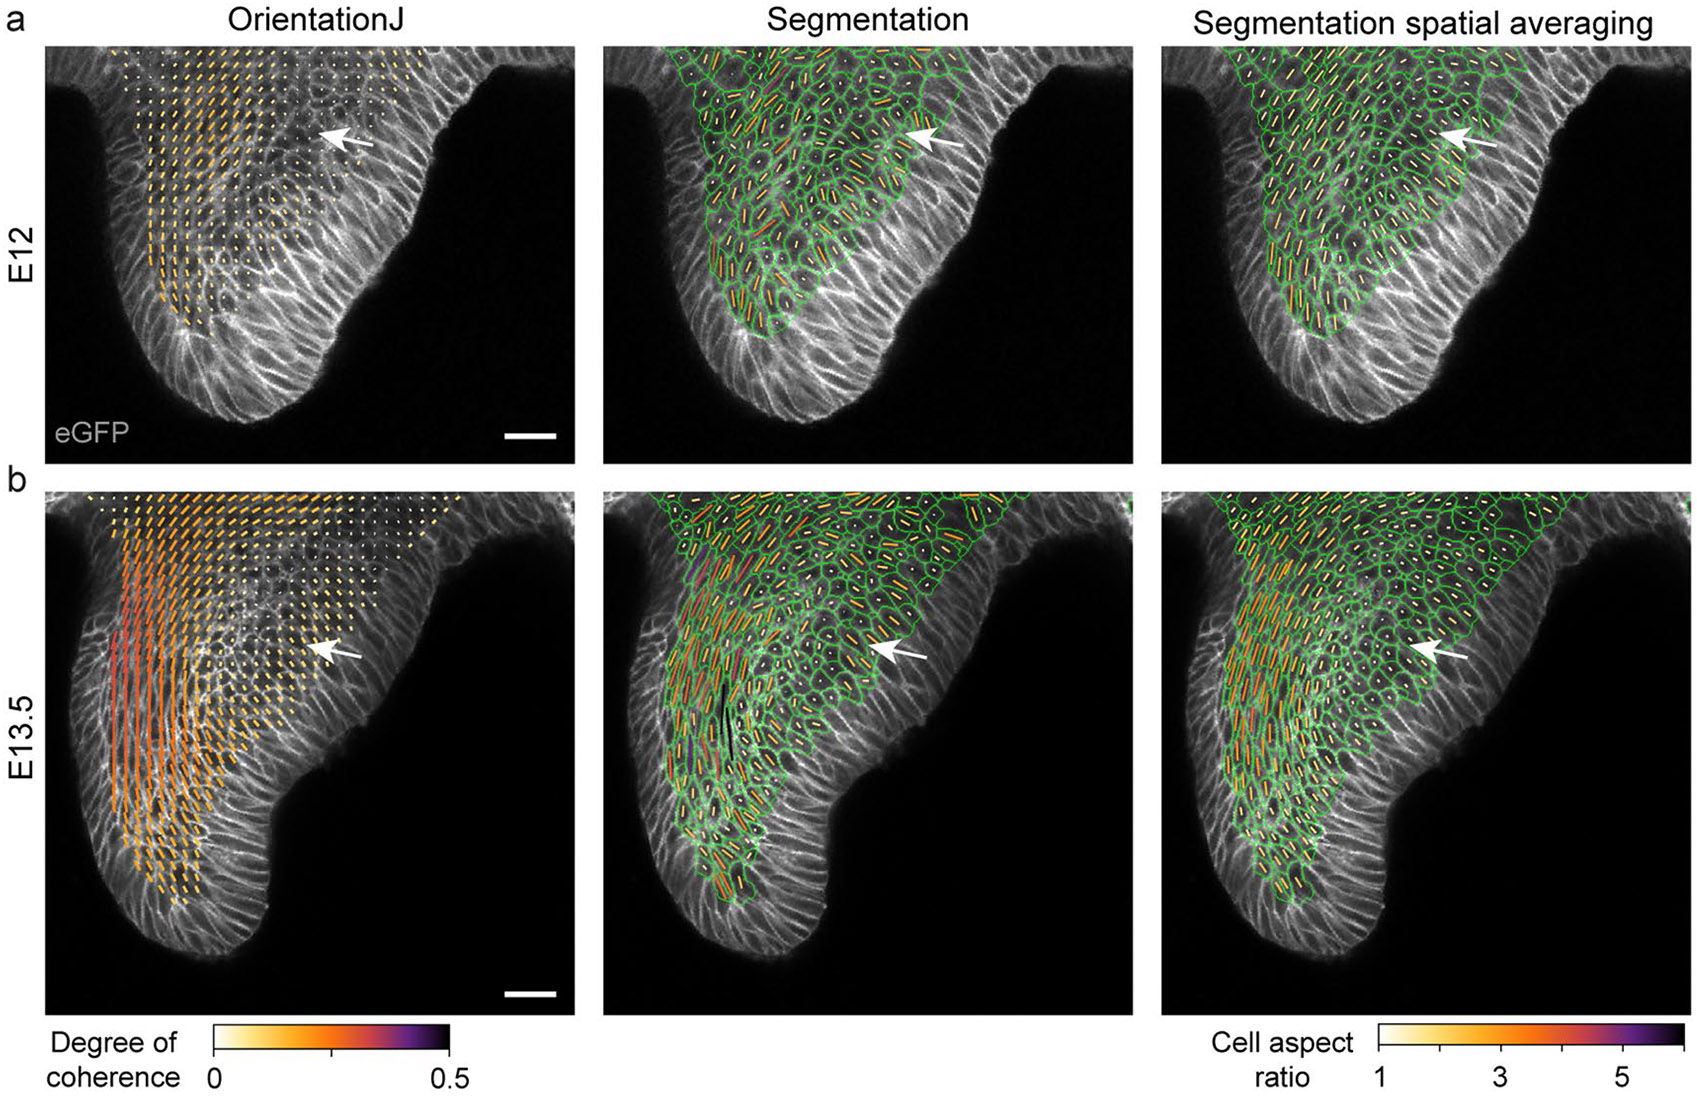
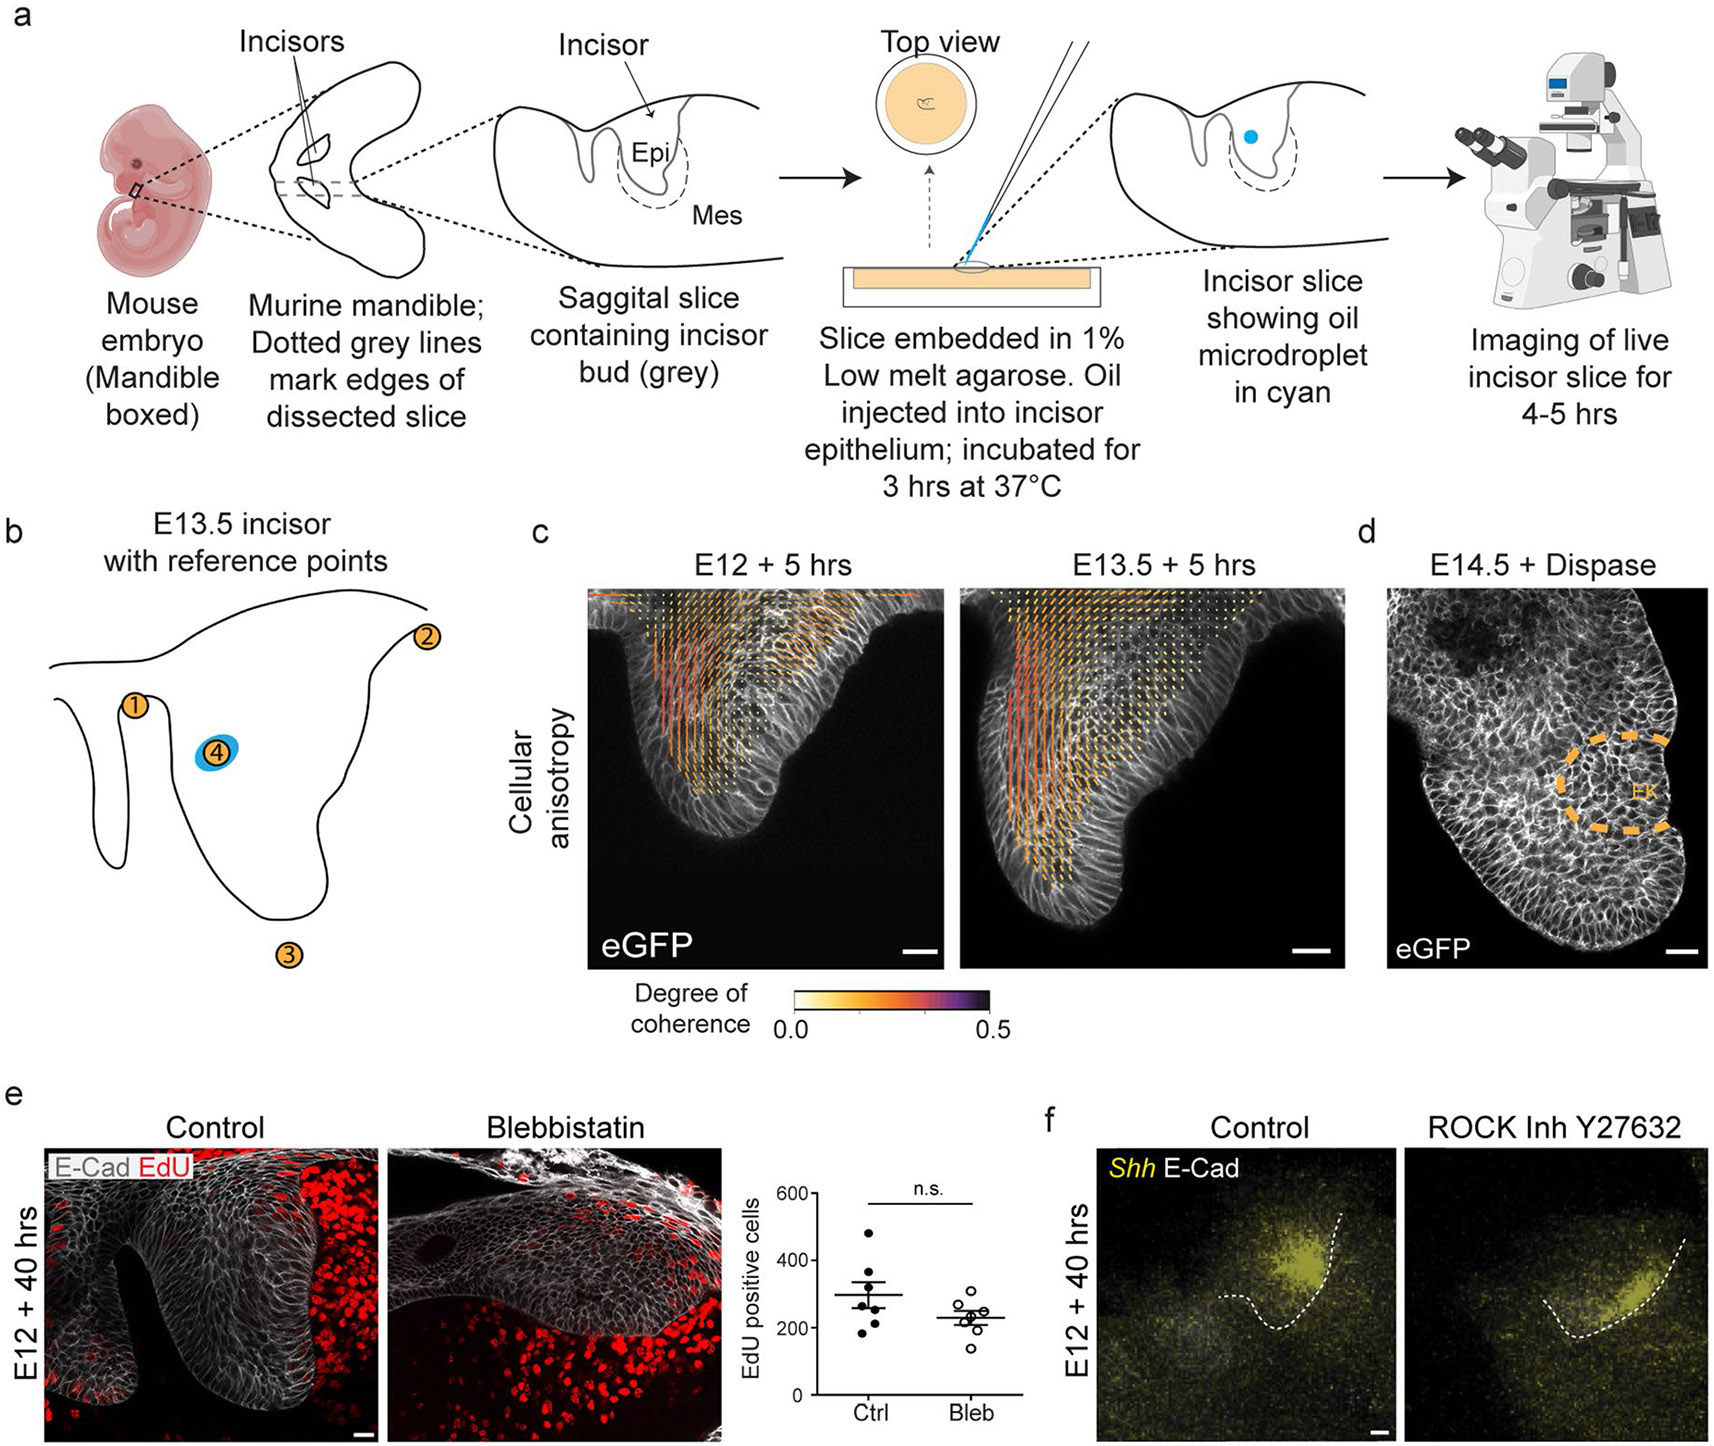
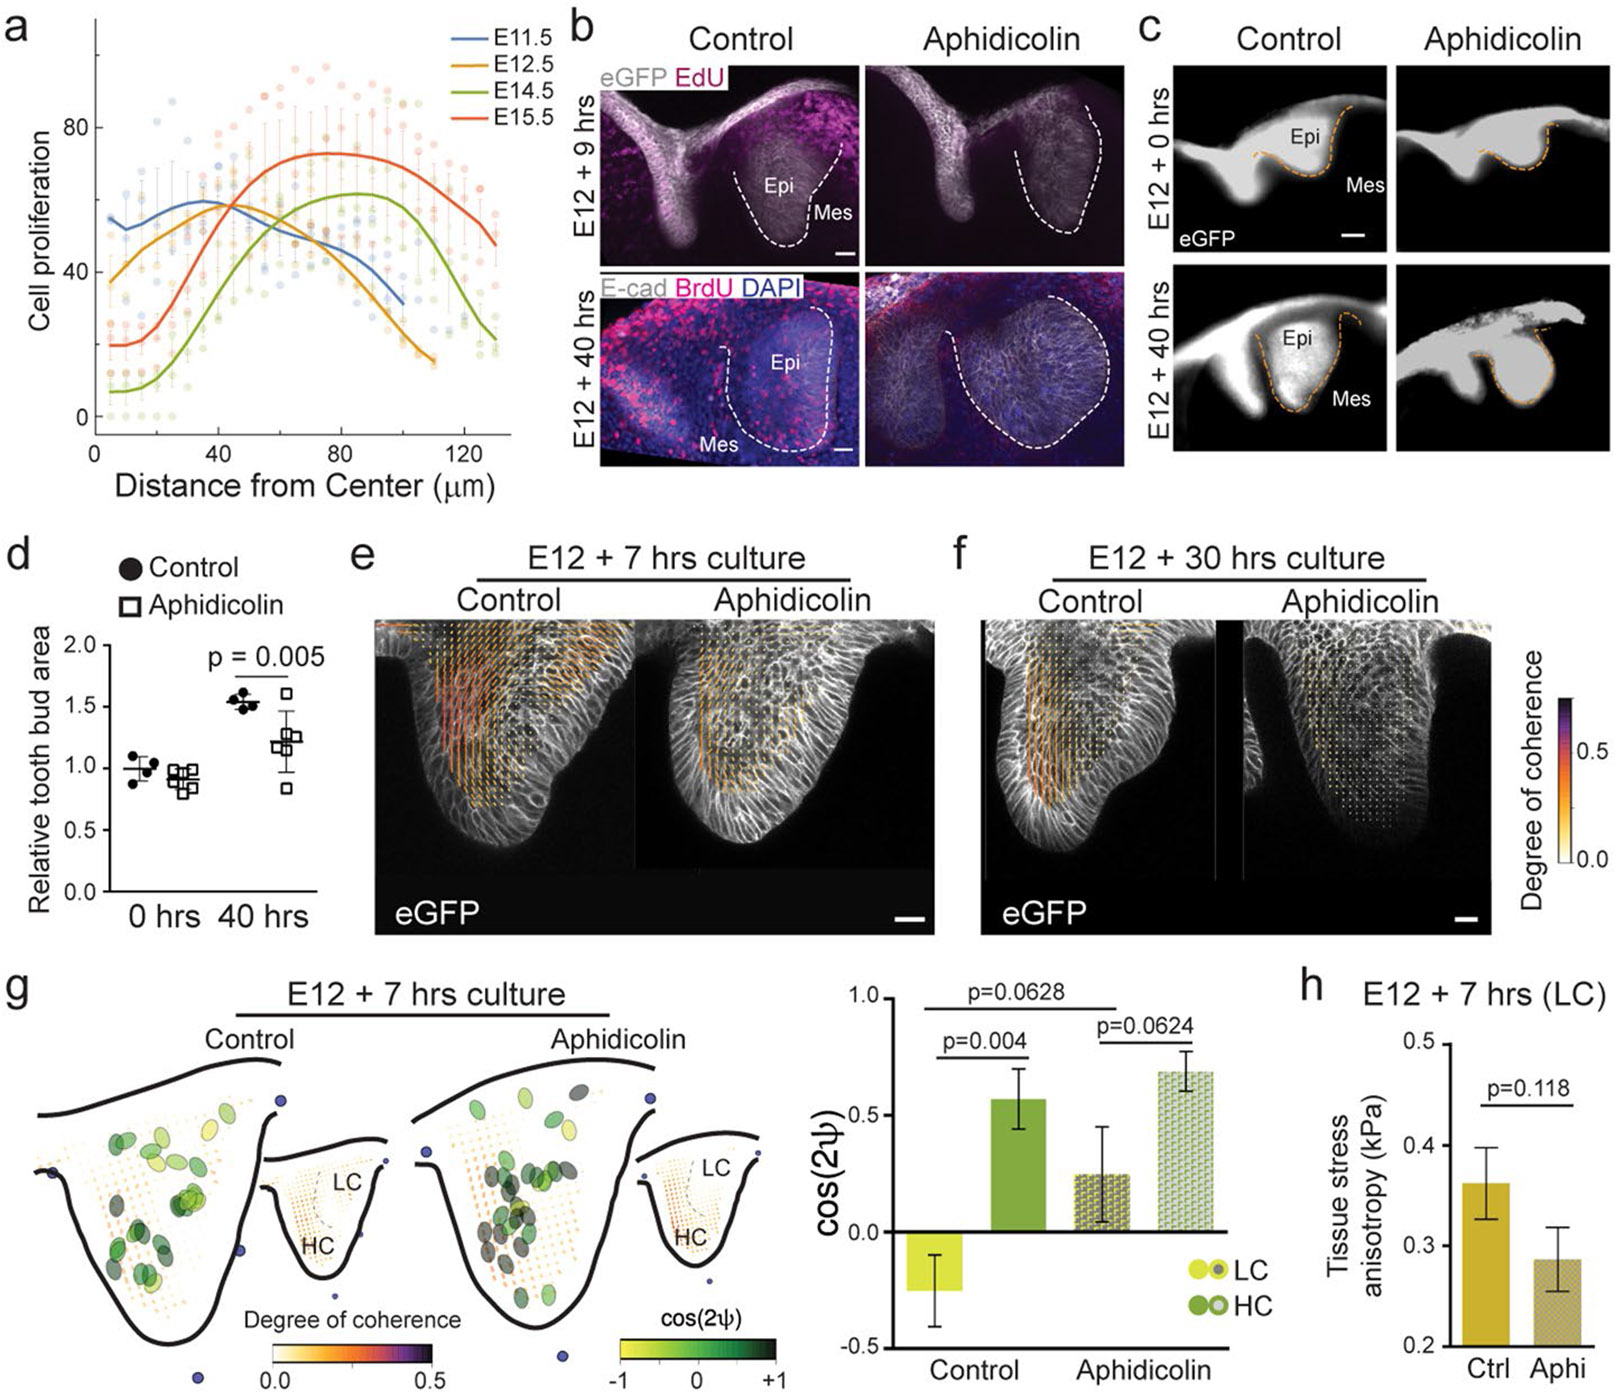
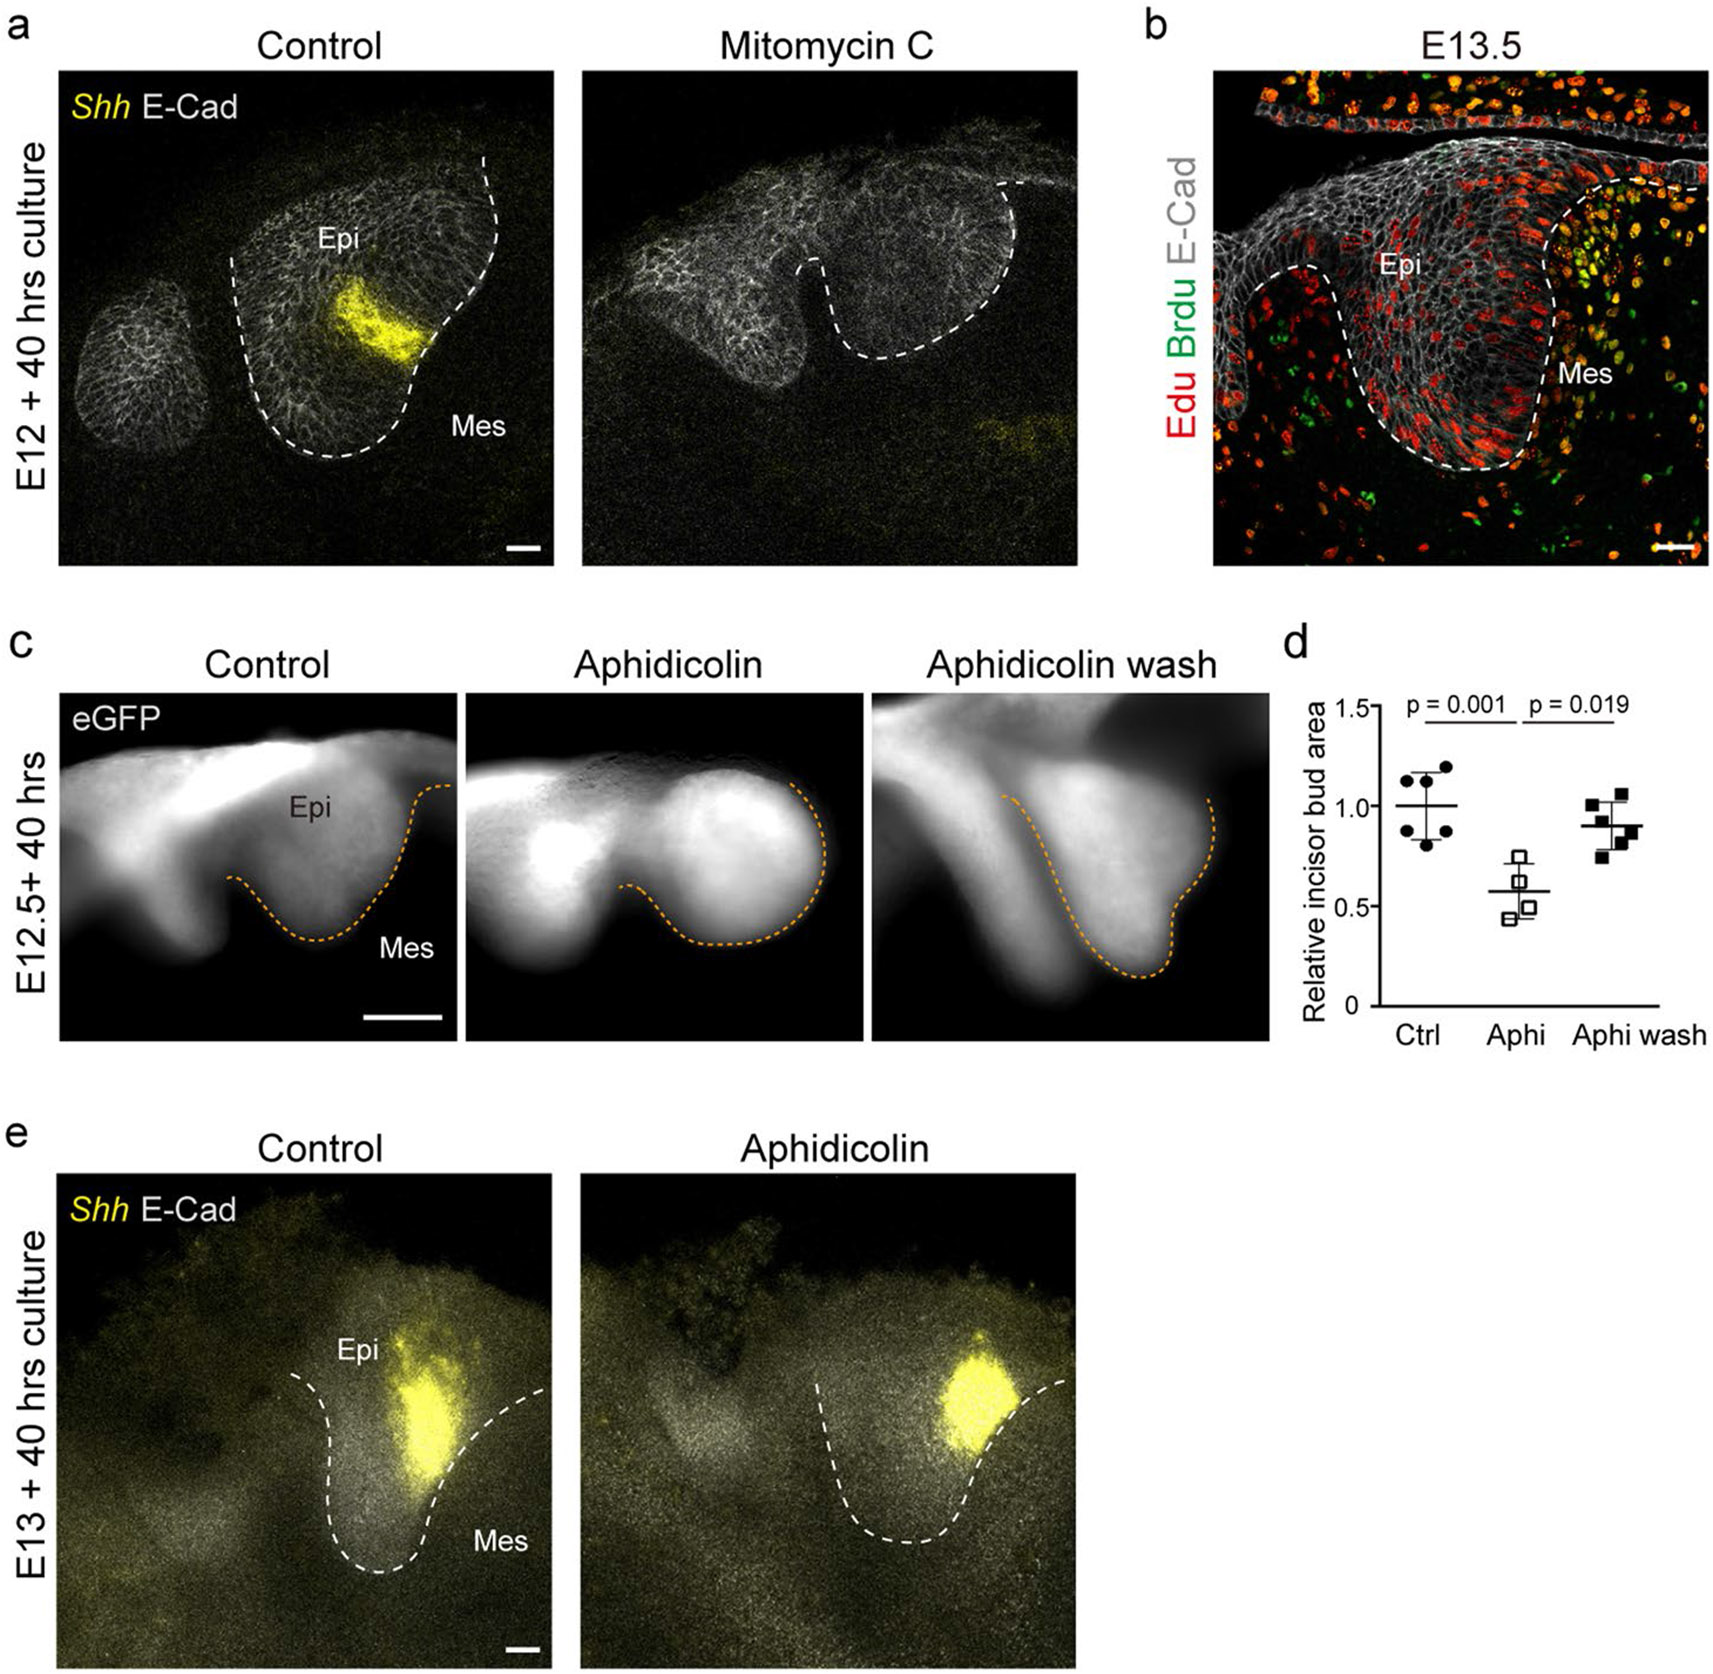
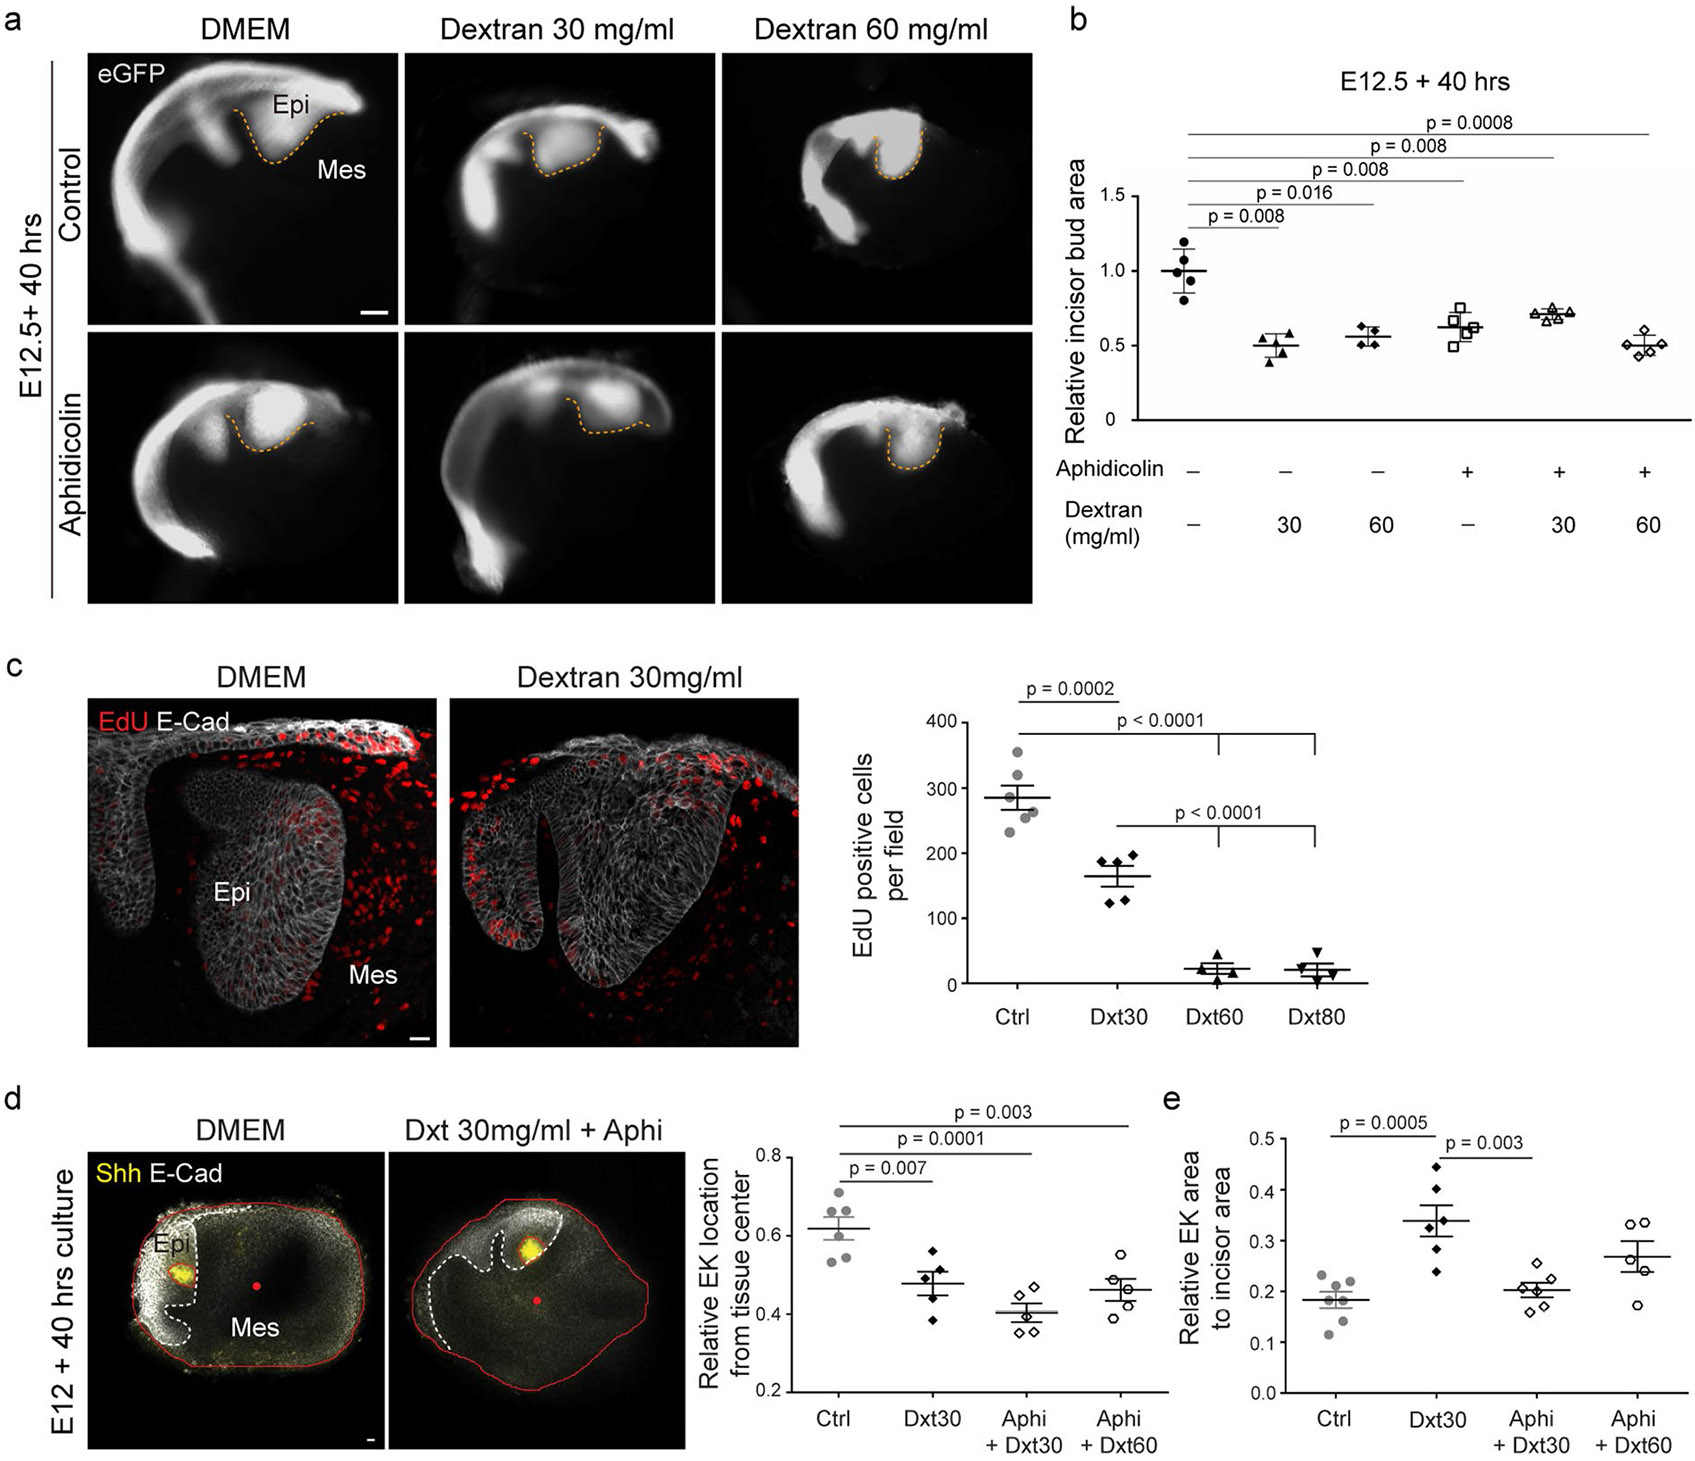
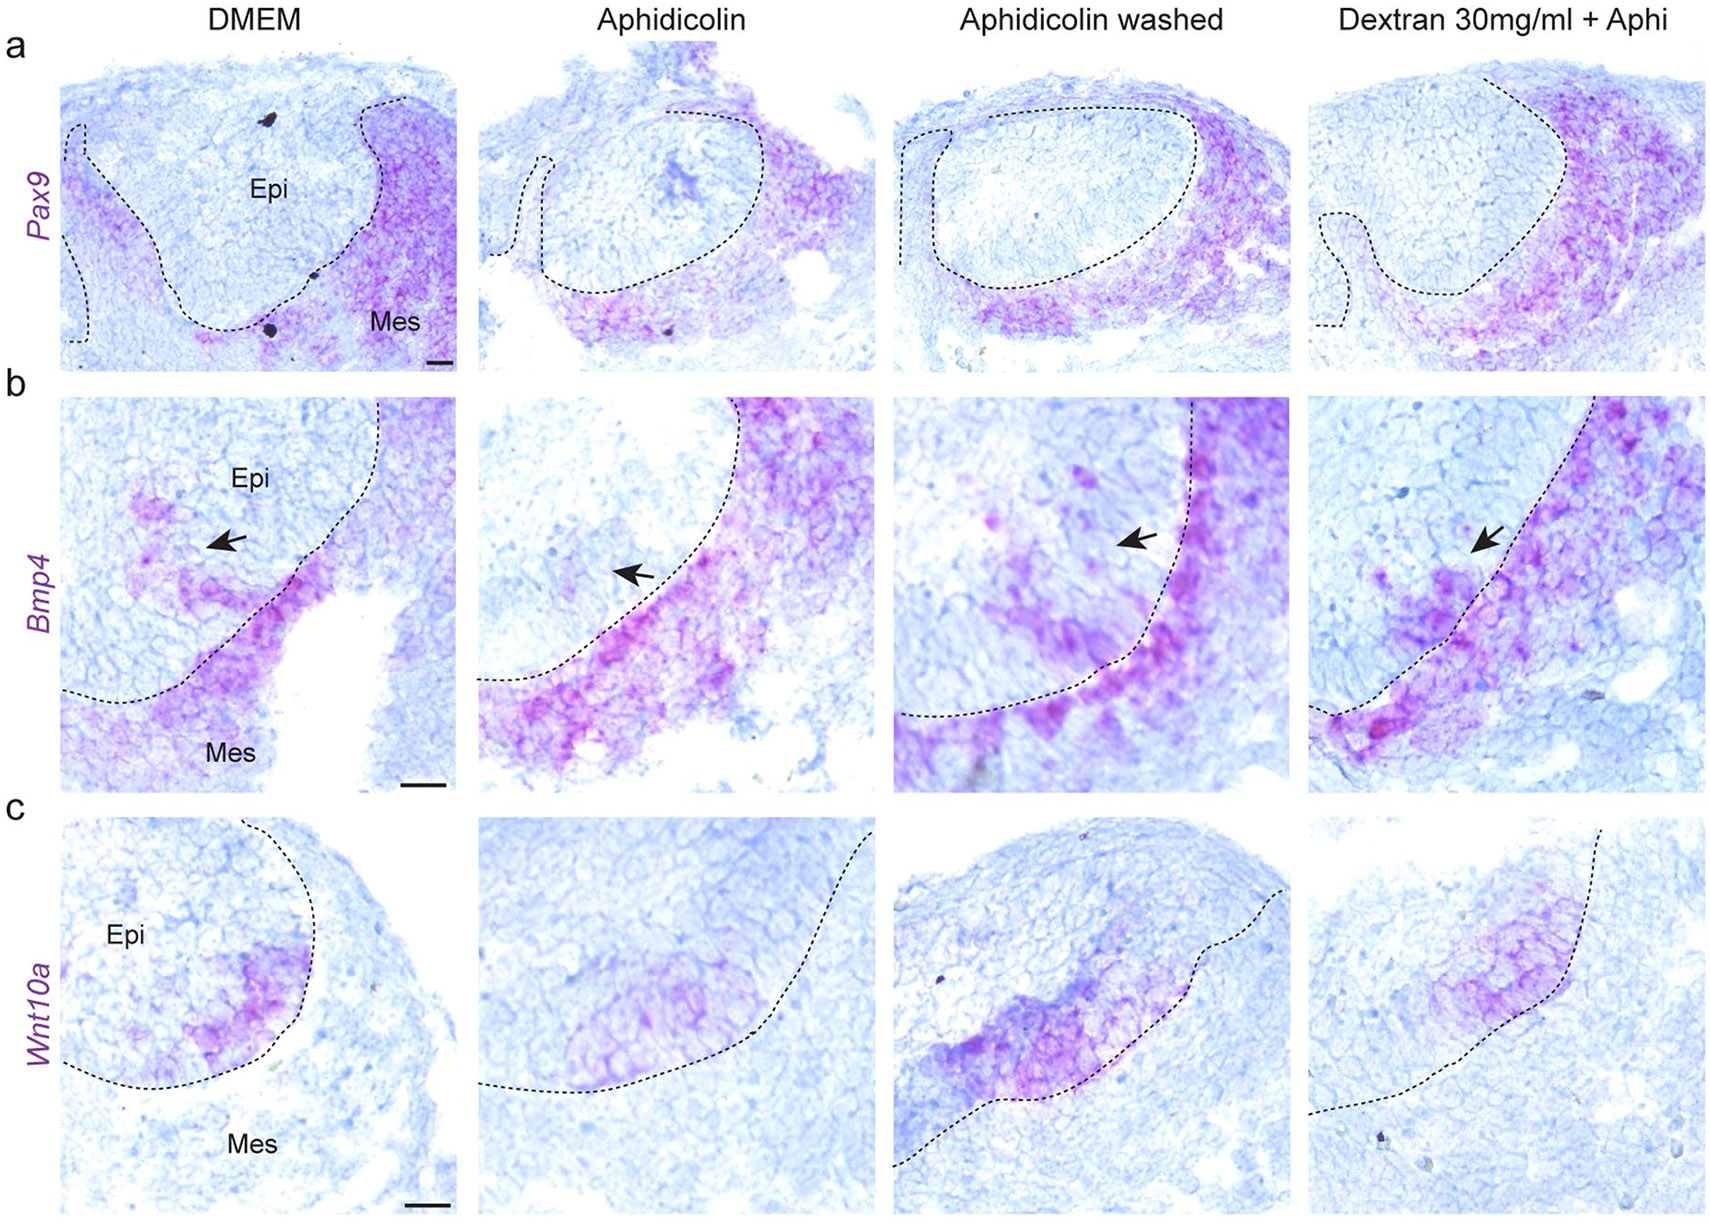
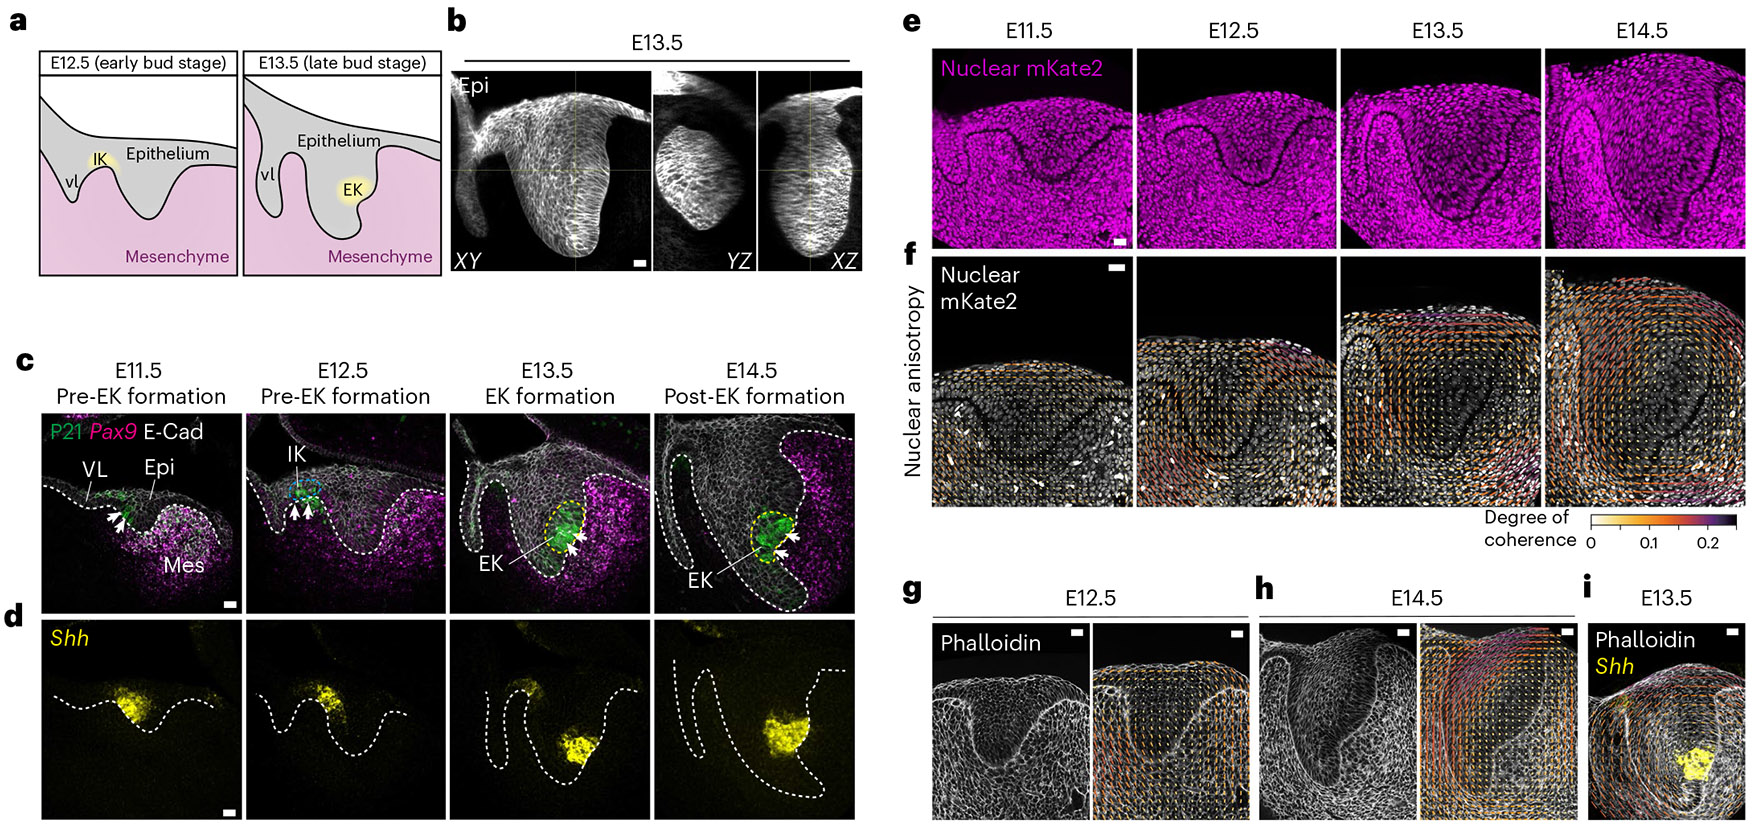
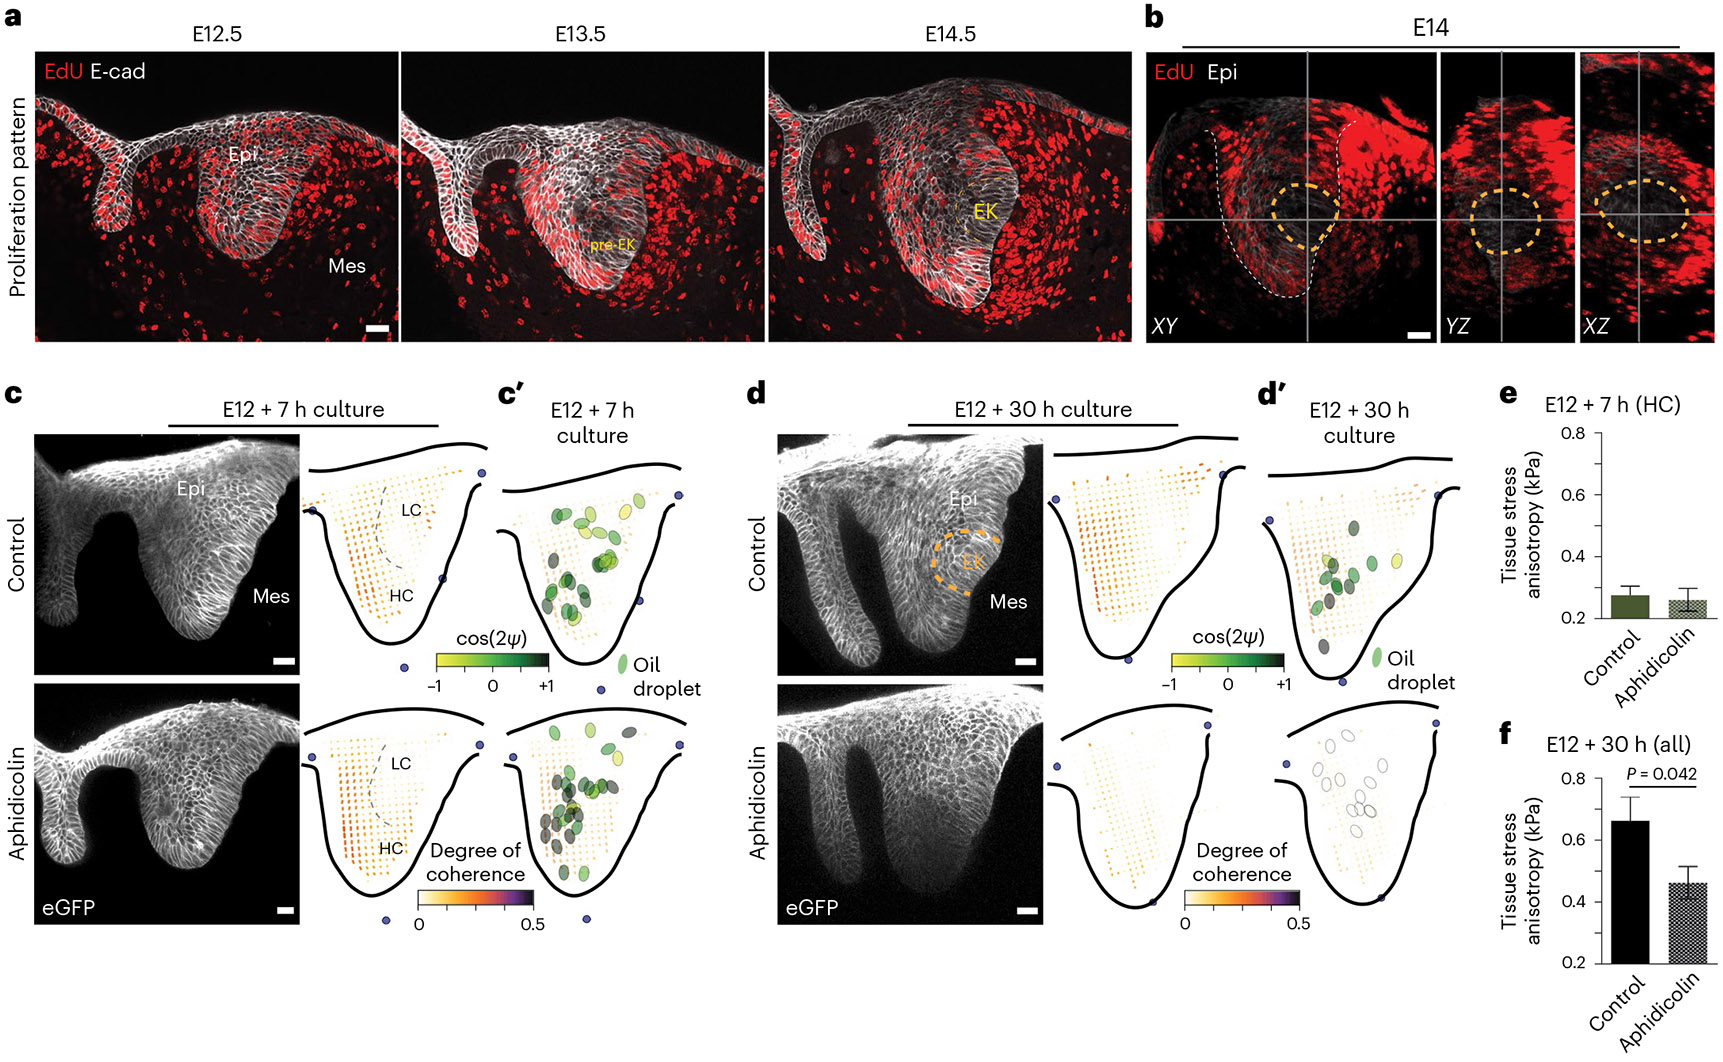
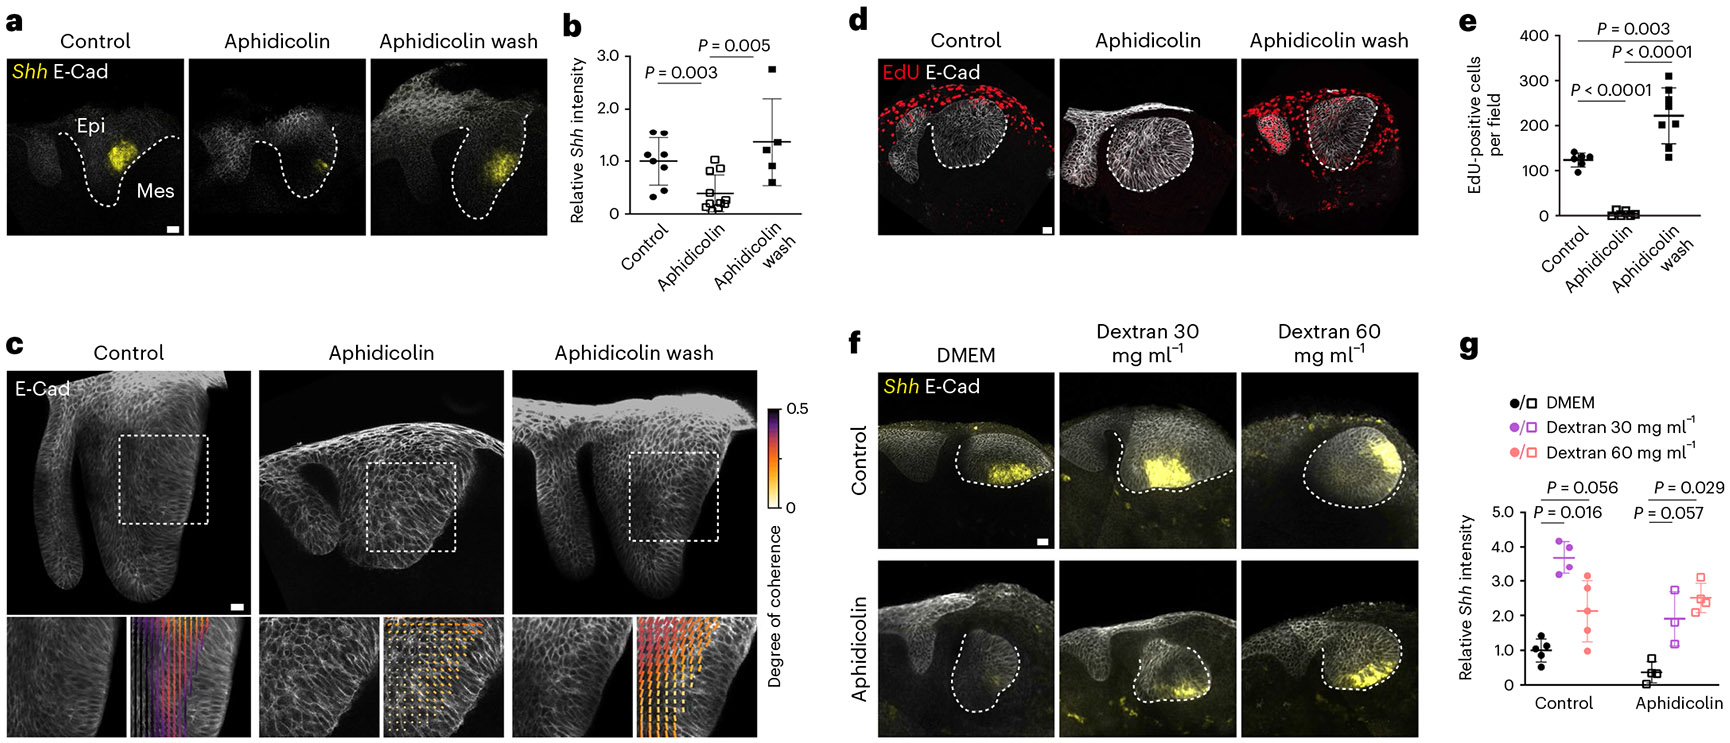
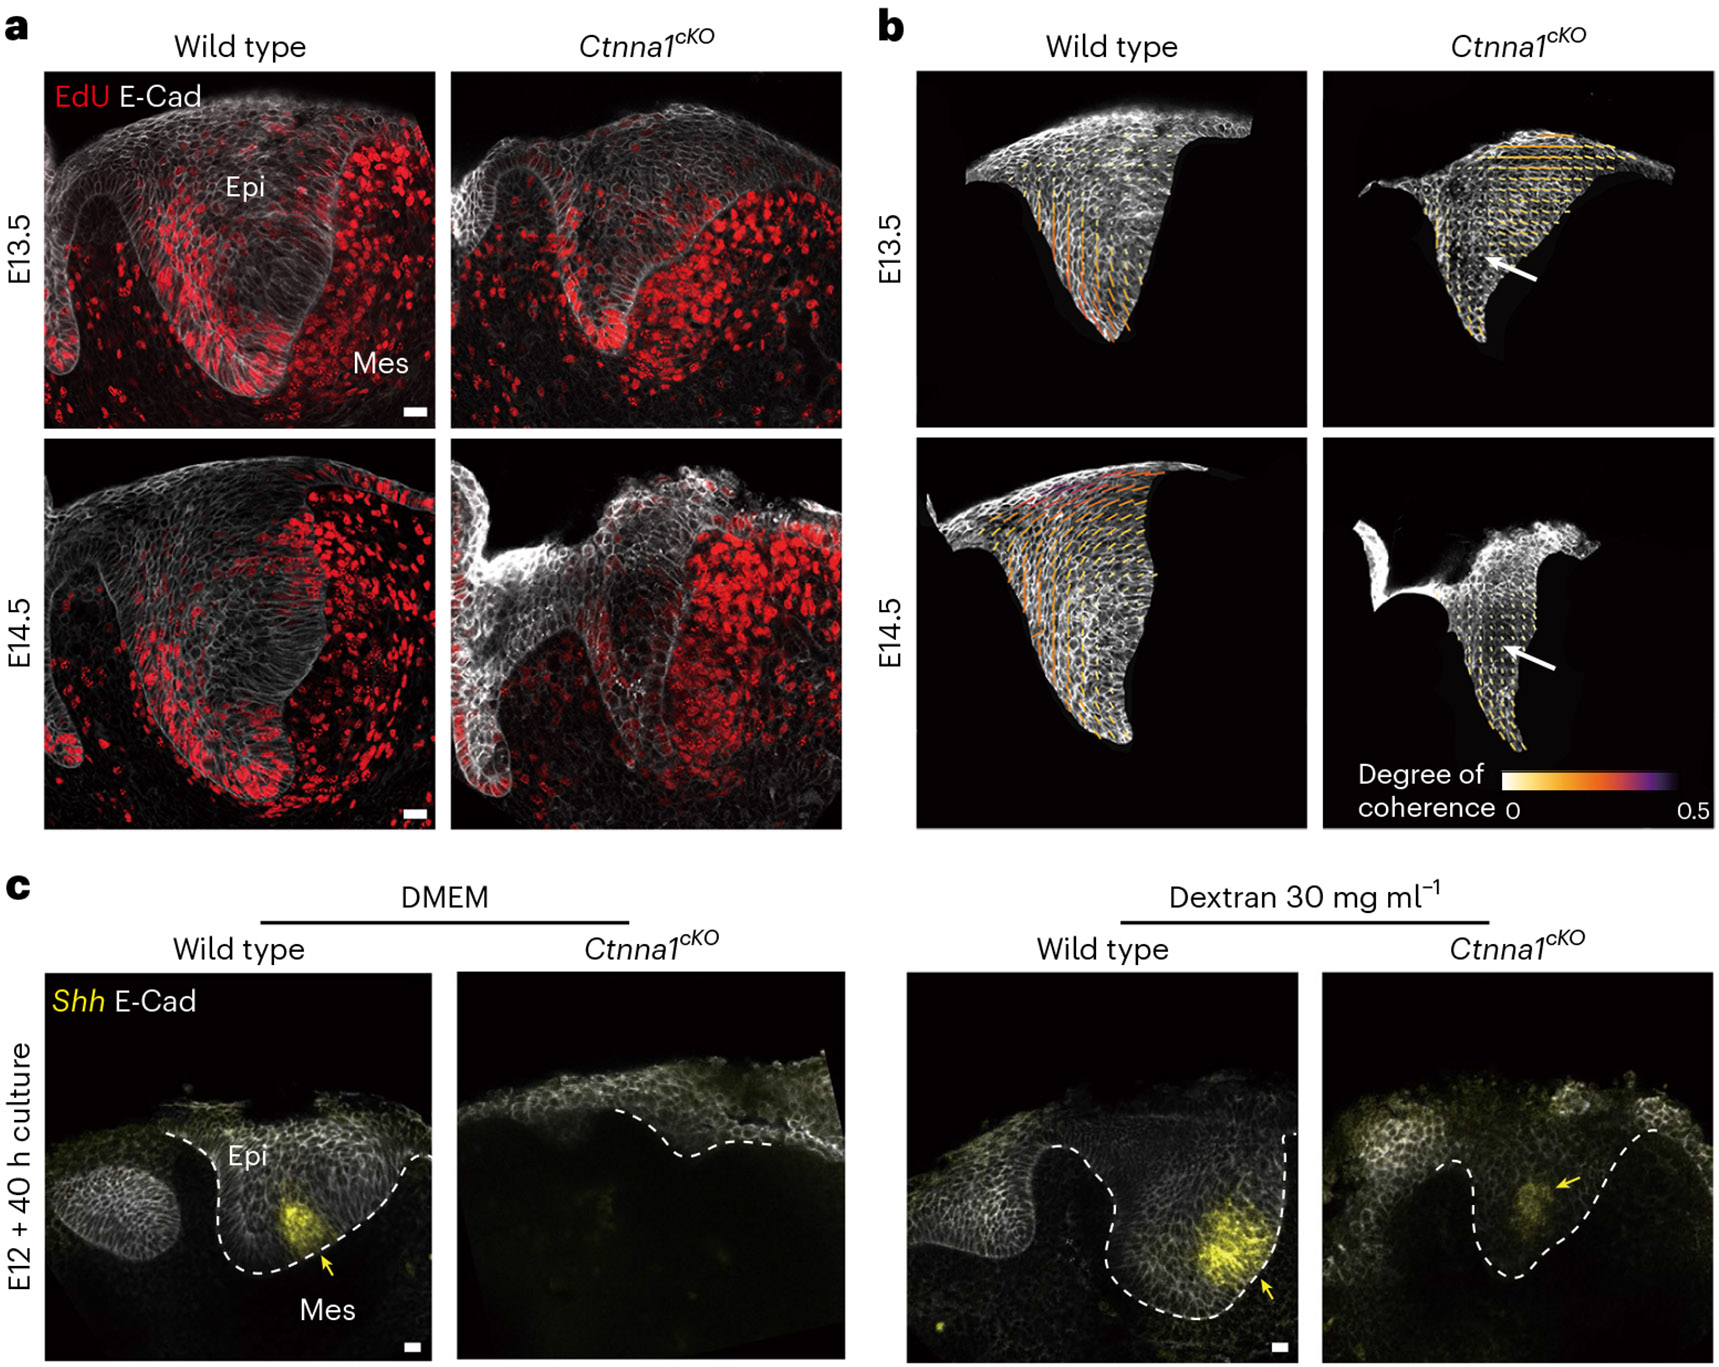
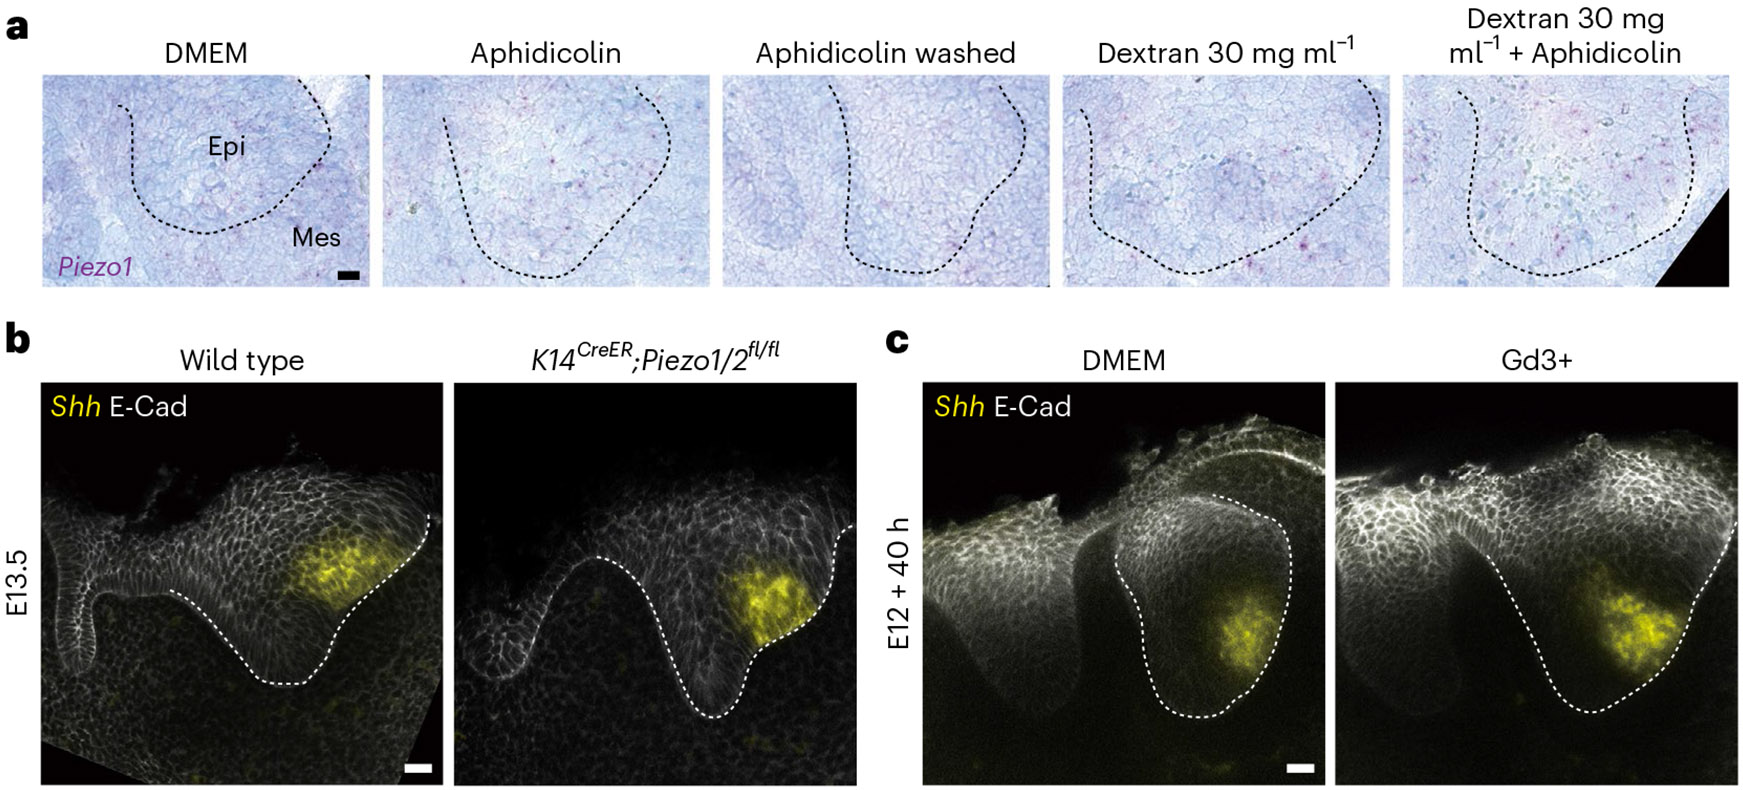
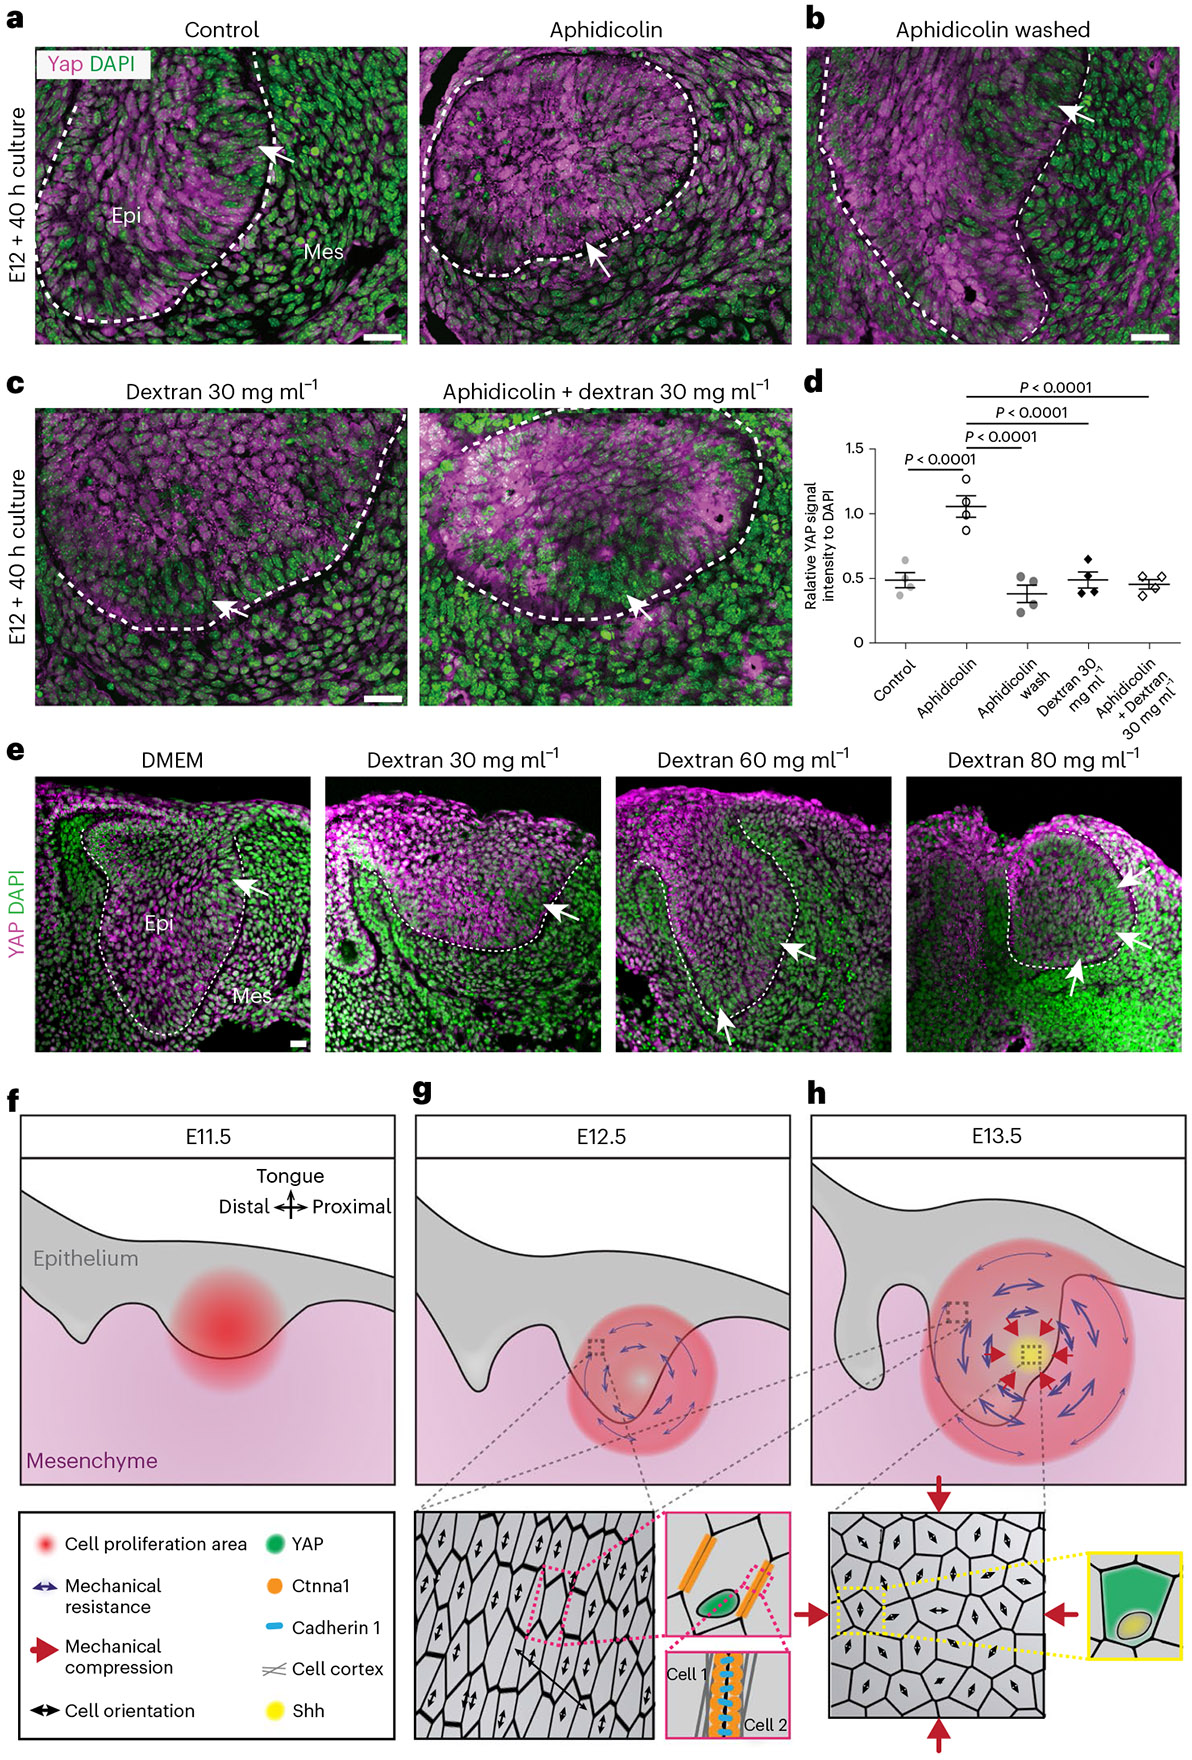
Localized sources of morphogens, called signalling centres, play a fundamental role in coordinating tissue growth and cell fate specification during organogenesis. However, how these signalling centres are established in tissues during embryonic development is still unclear. Here we show that the main signalling centre orchestrating development of rodent incisors, the enamel knot (EK), is specified by a cell proliferation-driven buildup in compressive stresses (mechanical pressure) in the tissue. Direct mechanical measurements indicate that the stresses generated by cell proliferation are resisted by the surrounding tissue, creating a circular pattern of mechanical anisotropy with a region of high compressive stress at its centre that becomes the EK. Pharmacological inhibition of proliferation reduces stresses and suppresses EK formation, and application of external pressure in proliferation-inhibited conditions rescues the formation of the EK. Mechanical information is relayed intracellularly through YAP protein localization, which is cytoplasmic in the region of compressive stress that establishes the EK and nuclear in the stretched anisotropic cells that resist the pressure buildup around the EK. Together, our data identify a new role for proliferation-driven mechanical compression in the specification of a model signalling centre during mammalian organ development.


Figures

Extended Data Fig. 1 ∣
Extended Data Fig. 1 ∣. A concentric cellular arrangement develops around the EK in the embryonic mouse incisor.
(a) Analysis of 2.5D nuclear orientation in representative images using OrientationJ in 3 confocal slices 15 μm apart in Z from a E13.5 incisor. (n = 1) (b) 3D analysis of nuclear orientation in representative images using Imaris nuclear segmentation of top, middle and bottom planes of a 52 μm thick Z-stack from a E13 incisor. (n = 1) (c) Average quantification of nuclear anisotropy in E11.5 through E14.5 incisor epithelia as shown in Fig. 1f using OrientationJ analysis (n = 4; Methods). (d) Average quantification of cytoskeletal anisotropy in E12.5 and E14.5 incisor epithelia as shown in Fig. 1g using OrientationJ analysis (n = 3). (e) Representative tissue anisotropy analysis (anisotropy in actin spatial distribution) of E13.5 Phalloidin stained bud and the overlay of the E13.5 Shh RNAscope image (from Fig. 1d) on the map. Scale bar, 25 μm. Data are represented as mean ± s.e.m. n represents number of embryos; one incisor measured per embryo.
Extended Data Fig. 2 ∣
Extended Data Fig. 2 ∣. OrientationJ and Epyseg analysis of incisors in 2D.
(a-b) OrientationJ and Epyseg analysis of representative (a) E12 and (b) E13.5 K14Cre;R26mTmG/mTmG incisors with the spatial averaging of the Epyseg analysis on the right (n = 1 per stage). White arrows indicate the low coherence region. Representative 2D central plane shown. Scale bar, 25 μm. n represents number of embryos; one incisor measured per embryo.
Extended Data Fig. 3 ∣
Extended Data Fig. 3 ∣. Inhibition of acto-myosin activity does not interfere with anisotropic stress mediated development of EK formation.
(a) Schematic depicting the dissection, agarose embedding, injection of oil microdroplets, and imaging of the incisor. The image of the embryo and the microscope have been obtained from Biorender.com. (b) Outline of E13.5 incisor with reference points 1–3 illustrating the marker locations on the border and point 4 illustrating the oil droplet for vector field and microdroplet orientation analysis. (c) Anisotropy analysis of the live E12 and E13.5 murine incisor. (E12: n = 6 and E13.5: n = 6). (d) Representative E14.5 incisor epithelium separated from the mesenchyme after 45 mins dispase treatment. (n = 3) (e) EdU and E-Cad immunostaining after a 1 h EdU pulse chase in E12 murine incisors cultured with DMSO or blebbistatin for 40 h. Quantification of total EdU positive cells in each field per condition for all incisors. (Control: n = 7; Blebbistatin: n = 7) (f) Whole mount in situ of Shh and E-Cad immunostaining in E12 incisors cultured for 40 h with DMSO or Y27632 (ROCK inhibitor). (DMSO: n = 5; Y27632: n = 5). Scale bar, 25 μm. Dashed line outlines the incisor. Representative 2D central plane shown in all images. Data are represented as mean ± s.e.m. Statistical analysis was done using the unpaired two-tailed Student’s T test (assuming unequal variance) with Welch’s correction for e. n represents number of embryos; one incisor measured per embryo.
Extended Data Fig. 4 ∣
Extended Data Fig. 4 ∣. Inhibiting cell proliferation in the embryonic murine incisor interferes with incisor growth and anisotropic stress development.
(a) Measured proliferation profiles from the centre in the epithelium at E11.5, 12.5, 14.5 and 15.5. (Mean values plotted from n = 3 per stage). (b) EdU and eGFP or BrdU and E-Cad immunostaining after a 1 h EdU or BrdU pulse chase in E12 murine incisors cultured with DMSO or Aphidicolin for 7 h (Top panel) and 40 h (Bottom panel). (n = 6 per condition) (c) Morphology of E12 incisors at 0 h and 40 h after culture with DMSO or aphidicolin. Dashed line outlines the incisor in (b, c). (Ctrl: n = 4, 6 and Aphi: n = 4, 6 for 0 and 40 hours respectively) (d) Quantification of the epithelial area (outlined in yellow dotted line) from all the buds represented in c. (n values in c). (e, f) Anisotropy analysis of the live E12 murine incisors cultured for (e) 7 h or (f) 30 h with DMSO or aphidicolin. (7 h – n = 5; 30 h - n = 3) (g) Representation of droplet orientation and cell anisotropy (orientation) maps (reproduced from Fig. 3c, c’) and quantification of droplet orientation with reference to the regional cell orientation in live 7 h DMSO or aphidicolin treated incisors. Compilation of average data from 3–6 h after injection. Orientation angle values for DMSO treated incisors reproduced from Fig. 2f E12 data. (Ctrl: n = 15 in LC and n = 14 in HC; Aphi: n = 13 in LC and n = 15 in HC) LC, low coherence region; HC, high coherence region. (h) Quantification of the tissue stress anisotropy measured by the oil droplets in the LC region of E12 incisors cultured for 7 hours with DMSO or aphidicolin (Ctrl: n = 15 from 2 h; Aphi: n = 13). Dashed line outlines the incisor. Scale bars, 25 μm. epi, epithelium; mes, mesenchyme. Representative 2D central plane shown in all images. Data are represented as mean ± s.e.m. Statistical analysis was done using 2 way ANOVA for d, unpaired two-tailed Student’s T test (assuming unequal variance) with Welch’s correction for g and 2 tailed Mann-Whitney test for h. Source data are available for all plots. n represents number of embryos; one incisor measured per embryo.
Extended Data Fig. 5 ∣
Extended Data Fig. 5 ∣. Cell proliferation increases compressive stress and area of the embryonic murine incisor.
(a) Whole mount in situ of Shh and E-Cad immunostaining in E12 incisors cultured for 40 h with DMSO or Mitomycin C. (n = 4 per condition) (b) BrdU-EdU double labelling in the E13.5 murine incisor after sequential pulse chase with EdU (1 h) – BrdU (15 mins). (n = 5) (c) Morphology of E12 incisors at 40 h after culture in DMSO or aphidicolin or aphidicolin washed out after 16 h. (Ctrl: n = 6; Aphi: n = 4; Aphi wash: n = 6) (d) Quantification of the area from all the buds represented in (a). (e) Whole mount in situ of Shh and E-Cad immunostaining in E13 incisors cultured for 40 h with DMSO or aphidicolin. (n = 3 per condition). Dashed line outlines the incisor. Scale bar, 25 μm. epi, epithelium; mes, mesenchyme. Representative 2D central plane shown in all images. Data are represented as mean ± s.e.m. Statistical analysis was done using the 2 tailed Mann-Whitney test for d. n represents number of embryos; one incisor measured per embryo.
Extended Data Fig. 6 ∣
Extended Data Fig. 6 ∣. Dextran-induced compression regulates incisor area and EK localization.
(a) Images showing the morphology of E12 incisor buds treated with DMSO or aphidicolin for 40 h with varying concentrations of dextran (30 mg/ml and 60 mg/ml). (b) Quantification of the area (outlined in yellow dashed lines) from all the buds represented in (a) (Ctrl: n = 3, 5 and 4 and Aphi: n = 5, 5 and 5 for Dextran 0, 30 and 60 mg/ml respectively). (c) EdU and E-Cad immunostaining after a 2 hour EdU chase in E12 incisors cultured for 40 h with DMSO or dextran (30 mg/ml). Quantification of EdU positive cells from these and incisors cultured in DMSO, or 30, 60, 80 mg/ml dextran. (n = 6, 5, 4 and 4 respectively) (d) Representative images of E12 mandible explants cultured for 40 h with DMSO or aphidicolin + dextran (30 mg/ml) (n = 6 and 5 respectively). Explants are outlined in red with the center marked by a red dot. Quantification of the relative distance of the EK from the center of the tissue in E12 incisors cultured with DMSO or aphidicolin with 30 or 60 mg/ml dextran. (n = 6, 5, 5 and 5 respectively) (e) Quantification of relative area of Shh expression to incisor area in E12 incisors cultured with DMSO or aphidicolin with 30 or 60 mg/ml dextran. (n = 7, 6, 6 and 5 respectively). Dashed line outlines the incisor. epi, epithelium; mes, mesenchyme. Scale bar, 25 μm. Representative 2D central plane shown in all images. Data are represented as mean ± s.e.m. Statistical analysis was done using the 2 tailed Mann-Whitney test for b and 1 way ANOVA with Bonferroni’s correction for multiple comparisons for c, d and e. n represents number of embryos; one incisor measured per embryo.
Extended Data Fig. 7 ∣
Extended Data Fig. 7 ∣. The expression patterns of EK markers Bmp4 and Wnt10a are affected by compressive stress.
(a, b, c) RNAscope for (a) Pax9, (b) Bmp4 and (c) Wnt10a in E12 incisors after 40 h culture with DMSO, aphidicolin throughout, aphidicolin washed out after 16 h (Aphi wash) or aphidicolin + 30 mg/ml dextran throughout (Dxt 30 mg/ml + Aphi) (n = 3). Dashed line outlines the incisor. epi, epithelium; mes, mesenchyme. Representative 2D central plane shown in all images. Scale bar, 25 mm. n represents number of embryos; one incisor measured per embryo.
Fig. 1 ∣
Fig. 1 ∣. Emergence of a circular pattern of structural anisotropy in the embryonic mouse incisor.
a, Schematic illustrating the early developmental stages of the mouse incisor. vl, vestibular lamina; IK, initiation knot; EK, enamel knot. b, Whole mount E13.5 K14Cre;R26mTmG/mTmG incisor showing the 3D bud in XY, YZ and XZ. c, P21 and E-Cad immunostaining and Pax9 RNAscope in E11.5–14.5 paraffin sections depicting the early development of the mouse incisor and formation of the EK (outlined by a yellow dashed line). The arrows indicate P21 staining (n = 3). epi, epithelium; mes, mesenchyme. d, Shh RNAscope in E11.5–14.5 paraffin sections during early development of the mouse incisor. The white dashed line outlines the incisor in c and d (n = 3). e, Representative fixed agarose sections of the mouse incisor from E11.5–E14.5 R26-pCAG-nuc-3x mKate2 embryos showing nuclei in the dental epithelium and mesenchyme (n = 4). f, Nuclear anisotropy (orientation) analysis of R26-pCAG-nuc-3x mKate2 mouse incisors from E11.5 to E14.5, showing the emergence of a circular anisotropy pattern in the tissue. g,h, Representative phalloidin staining and actin spatial distribution anisotropy of fixed agarose slices of E12.5 (g) and E14.5 (h) mouse incisor (n = 3). i, Overlay of E13.5 phalloidin (actin) anisotropy analysis and E13.5 Shh RNAscope image from d. Scale bar, 25 μm. The bar colour and length for fi represent the coherence/degree of anisotropy. A representative 2D central plane is shown in ci. Each n represents the number of embryos, with one incisor measured per embryo.
Fig. 2 ∣
Fig. 2 ∣. Circular anisotropy pattern arises from mechanical resistance in the tissue.
a, Representative image of an oil microdroplet in a live E12 K14Cre;R26mTmG/mTmG incisor at 5 h after injection. The insets show a zoom-in of droplet (top) and ellipsoid fitting (bottom). a′, 3D reconstruction of the droplet in a showing the measured tissue-scale stress anisotropy (ellipsoidal mode). b, Sketch showing ϕ (the angle between the cell longitudinal axis and the horizontal axis), θ (the angle between the droplet longitudinal axis and the horizontal axis) and ψ (the difference between ϕ and θ). c,c′, Sketch showing how the relative angle between droplet and local cell orientation is an indicator of the origin of the stresses – actomyosin driven (c) or passive resistance to external forces (c′). d,e, Representative image and analysis of epithelial cell anisotropy (average) in live E12 (d) and E13.5 (e) incisors, 5 h after droplet injection (n = 6). f,g, Difference between droplet and local cell orientation in different regions of live E12 (f) and E13.5 (g) incisors. Compilation of average data from 3 to 6 h after injection. Each ellipse represents one droplet/incisor. n = 15 in LC and n = 14 in HC for f. n = 18 in LC and n = 17 in HC for g. h, Quantification of tissue stress anisotropy in the E12 and E13.5 incisors in the LC and HC regions of tissue anisotropy defined in d and e. n = 15 in LC and n = 16 in HC for E12. n = 18 in LC and n = 18 in HC for E13.5. i, Representative E13.5 incisor epithelium separated from the mesenchyme after 45 min dispase treatment (n = 5). j, Shh whole mount in situ and E-Cad immunostaining in E12 incisors cultured with DMSO or blebbistatin for 40 h (n = 5). The dashed white line outlines the incisor. epi, epithelium; mes, mesenchyme. Scale bars, 25 μm. A representative 2D central plane is shown in a, d, e, i and j. The data are presented as mean ± s.e.m. The statistical analysis was done using the unpaired two-tailed Student’s t test (assuming unequal variance) with Welch’s correction for f and g and two-way ANOVA for h. Source data are available for all plots. Each n represents the number of embryos, with one incisor measured per embryo.
Fig. 3 ∣
Fig. 3 ∣. Circular mechanical and structural anisotropy depend on cell proliferation in the incisor during EK formation.
a, EdU and E-Cad immunostaining after a 1 h EdU chase in the developing incisor from E12.5 through E15.5 (n = 4). b, XY, YZ and XZ sections of an EdU-stained E14 incisor (outlined in the dashed grey line) showing the 3D sphere formed by the proliferating cells with a non-proliferating region at the location of the EK (outlined in the dashed yellow line). Planes are marked by the solid grey lines (n = 4). c,d, Representative image and anisotropy analysis (average) in live E12 incisors cultured for 7 h (c) and 30 h (d) with DMSO or aphidicolin. n = 5 for 7 h and n = 3 for 30 h for control and aphidicolin, respectively. c′,d′, Difference between droplet and local cell orientation in live E12 incisors cultured for 7 h (c′) and 30 h (d′) with DMSO or aphidicolin. Compilation of average data from 3 to 6 h after injection. Each ellipse represents one droplet/incisor. Lack of coherence in cell anisotropy at E12 + 30 h prevented the quantification of the ψ between droplet and tissue anisotropies. e,f, Tissue stress anisotropy in E12 incisors cultured for 7 h (e) and 30 h (f) with DMSO or aphidicolin. Droplets in the HC region used for 7 h (n = 16 for control and n = 14 for aphidicolin) and all droplets throughout the incisor used for 30 h quantifications (n = 10 for control and n = 12 for aphidicolin). c (top right) and c′ (top) have been reproduced from Fig. 2. epi, epithelium; mes, mesenchyme. Scale bar, 25 μm. A representative 2D central plane is shown in a, c and d. The data are presented as mean ± s.e.m. The statistical analysis was done using the two-tailed Mann–Whitney U test for e (not significant) and f. Source data are available for all plots. Each n represents the number of embryos, with one incisor bud measured per embryo.
Fig. 4 ∣
Fig. 4 ∣. Proliferation-driven tissue pressure regulates EK gene expression in the murine incisor.
a, Whole mount in situ of Shh and E-Cad immunostaining in E12 incisors cultured for 40 h with DMSO or aphidicolin or with aphidicolin washed out after 16 h. b, Quantification of Shh intensity from all incisor buds represented in a (n = 8 for control, n = 11 for aphidicolin and n = 5 for the aphidicolin wash). c, Representative images and tissue anisotropy analysis (cell orientation) in E12 incisors from K14Cre;R26mTmG/mTmG embryos cultured for 40 h with DMSO or aphidicolin or with aphidicolin washed out after 16 h (n = 5). d, EdU and E-Cad immunostaining in E12 incisors cultured for 40 h with DMSO or aphidicolin or with aphidicolin washed out after 16 h. e, Quantification of EdU positive cells from all images represented in d (n = 6 for control, n = 6 for aphidicolin and n = 8 for the aphidicolin wash). f, Whole mount in situ of Shh and E-Cad immunostaining in E12 incisors cultured for 40 h with DMSO or aphidicolin with varying concentrations of dextran (30 mg ml−1 and 60 mg ml−1). g, Quantification of Shh intensity from all incisor buds represented in f (n = 5, 4 and 5 for control and n = 4, 3 and 4 for aphidicolin, with DMSO, dextran 30 mg ml−1 and dextran 60 mg ml−1, respectively). The dashed line outlines the incisor. epi, epithelium; mes, mesenchyme. Scale bars, 25 μm. A representative 2D central plane is shown in a, c, d and f. The data are presented as mean ± s.e.m. The statistical analysis was done using the two-tailed Mann–Whitney U test for b and g and the unpaired two-tailed Student’s t test (assuming unequal variance) with Welch’s correction for e. Source data are available for all plots. Each n represents the number of embryos, with one incisor measured per embryo.
Fig. 5 ∣
Fig. 5 ∣. αE-catenin is necessary to create mechanical tissue anisotropy and for EK formation.
a, EdU and E-Cad immunostaining after a 1-h EdU chase in the developing incisor from wild type (K14Cre;Ctnna1fl/+) and K14Cre;Ctnna1cKO mice at E13.5 and E14.5 (n = 4 for wild type and n = 3 for Ctnna1cKO). b, Tissue anisotropy analysis (cell orientation) of incisors represented in a. The white arrows show loss of anisotropy. c, Whole mount in situ of Shh and E-Cad immunostaining in E12 incisors from wild type (K14Cre;Ctnna1fl/+) and K14Cre;Ctnna1cKO mice cultured for 40 h with DMSO or dextran (30 mg ml−1). The yellow arrows point to Shh. A total of 11 out of 12 DMEM-treated mutants showed absence of Shh, and 4 out of 7 dextran-treated mutants showed presence of Shh (n = 7 and 12 for DMEM and n = 7 and 7 for dextran 30 mg ml−1, for wild type and Ctnna1cKO, respectively). The dashed line outlines the incisor. epi, epithelium; mes, mesenchyme. Scale bars, 25 μm. A representative 2D central plane is shown in all images. Each n represents the number of embryos, with one incisor measured per embryo.
Fig. 6 ∣
Fig. 6 ∣. Piezo does not affect EK formation.
a, RNAscope of Piezo1 in E12 incisors cultured for 40 h in DMEM with aphidicolin, aphidicolin washed out after 16 h or dextran (30 mg ml−1) ± aphidicolin (n = 4). b,c, Whole mount in situ of Shh and E-Cad immunostaining in E13.5 wild type (Piezo1/2fl/fl) or K14CreER;Piezo1/2fl/fl incisors (n = 4) (b) and E12 incisors cultured in DMEM or Gd3+ (Piezo1/2 inhibitor) for 40 h (n = 5) (c). Scale bar, 25 μm. epi, epithelium; mes, mesenchyme. The dashed line outlines the incisor. A representative 2D central plane is shown in all images. Each n represents the number of embryos, with one incisor measured per embryo.
Fig. 7 ∣
Fig. 7 ∣. YAP transduces mechanical information to establish the EK in the murine incisor.
a,b,c, YAP immunostaining in OCT sections from E12 incisors cultured for 40 h with DMSO (left) and aphidicolin (right) (a), aphidicolin washed out after 16 h (b) or dextran (30 mg ml−1) in the absence (left) or presence (right) of aphidicolin (c). The white arrows point to actual/presumptive EK (n = 4 for each condition). d, Quantification of YAP nuclear signal intensity in the EK region from all images represented in a, b and c (n = 5 nuclei examined over four biological samples for all conditions). e, YAP immunostaining in OCT sections of E12 incisors cultured with DMEM (left) or 30 (middle left), 60 (middle right) and 80 mg ml−1 (right) dextran. The arrows denote region(s) of loss of nuclear YAP (n = 4 for each condition). f,g,h, Schematics of the main events driving EK formation. At E11.5 (f), a graded cell proliferation pattern in the incisor bud is observed. The cell proliferation gradient induces a localized growth in the epithelium and adjacent mesenchyme. With increasing proliferation, a circular pattern of structural anisotropy emerges in the tissue at E12.5 (g). The structural anisotropy is linked to a mechanical anisotropy associated with mechanical stresses that resist the localized increase in proliferation-driven tissue pressure. Cells in regions resisting the pressure are stretched along the direction of tissue- scale anisotropy (zoom-in) and display nuclear YAP (zoom-in). Intracellular αE-catenin (encoded by Ctnna1;zoom-in) is essential to physically link the cytoskeleton in neighbouring cells and allow them to mechanically resist the proliferation-driven buildup in tissue pressure. Tissue resistance to the graded cell proliferation causes an increase of tissue compression at the centre of the circular anisotropy pattern (h), which causes a loss of nuclear YAP (zoom-in), a suppression of cell proliferation and triggers Shh expression (zoom-in), driving EK formation. The dashed line outlines the incisor. Scale bars, 25 μm. epi, epithelium; mes, mesenchyme. A representative 2D central plane is shown in all images. The data are presented as mean ± s.e.m. The statistical analysis was done using one-way ANOVA with Bonferroni’s correction for multiple comparisons for d. Source data are available for all plots. Except for d, each n represents the number of embryos, with one incisor measured per embryo.

References

    1. Lecuit T & Le Goff L Orchestrating size and shape during morphogenesis. Nature 450, 189–192 (2007). - PubMed
    1. Gilmour D, Rembold M & Leptin M From morphogen to morphogenesis and back. Nature 541, 311–320 (2017). - PubMed
    1. Gurdon JB & Bourillot PY Morphogen gradient interpretation. Nature 413, 797–803 (2001). - PubMed
    1. Spemann H & Mangold H Induction of embryonic primordia by implantation of organizers from a different species. 1923. Int. J. Dev. Biol 45, 13–38 (2003). - PubMed
    1. De Robertis EM, Larraín J, Oelgeschläger M & Wessely O The establishment of Spemann’s organizer and patterning of the vertebrate embryo. Nat. Rev. Genet 1, 171–181 (2000). - PMC - PubMed