. 2024 Apr;628(8009):854-862.
doi: 10.1038/s41586-024-07251-0. Epub 2024 Apr 3.

Immune microniches shape intestinal Treg function

Affiliations

Immune microniches shape intestinal Treg function

Yisu Gu et al. Nature. 2024 Apr.

Abstract

The intestinal immune system is highly adapted to maintaining tolerance to the commensal microbiota and self-antigens while defending against invading pathogens1,2. Recognizing how the diverse network of local cells establish homeostasis and maintains it in the complex immune environment of the gut is critical to understanding how tolerance can be re-established following dysfunction, such as in inflammatory disorders. Although cell and molecular interactions that control T regulatory (Treg) cell development and function have been identified3,4, less is known about the cellular neighbourhoods and spatial compartmentalization that shapes microorganism-reactive Treg cell function. Here we used in vivo live imaging, photo-activation-guided single-cell RNA sequencing5-7 and spatial transcriptomics to follow the natural history of T cells that are reactive towards Helicobacter hepaticus through space and time in the settings of tolerance and inflammation. Although antigen stimulation can occur anywhere in the tissue, the lamina propria-but not embedded lymphoid aggregates-is the key microniche that supports effector Treg (eTreg) cell function. eTreg cells are stable once their niche is established; however, unleashing inflammation breaks down compartmentalization, leading to dominance of CD103+SIRPα+ dendritic cells in the lamina propria. We identify and validate the putative tolerogenic interaction between CD206+ macrophages and eTreg cells in the lamina propria and identify receptor-ligand pairs that are likely to govern the interaction. Our results reveal a spatial mechanism of tolerance in the lamina propria and demonstrate how knowledge of local interactions may contribute to the next generation of tolerance-inducing therapies.


Conflict of interest statement

C.H. is a current employee of F. Hoffmann-La Roche. S.A.T. is a remunerated member of the scientific advisory board of Element Biosciences, Foresite Labs and Qiagen. S.A.T. is co-founder and equity holder of Transition Bio and EnsoCell, as well as a part-time employee of GlaxoSmithKline. F.P. receives consultancy fees or research support from Janssen, GSK, Genentech, and T-Cypher. The other authors declare no competing interests.

Figures

Fig. 1
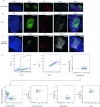
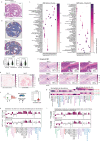
Fig. 1. The LP niche supports the highest production of IL-10 in response to Hh colonization.
a, Diagram of tissue and lymphoid structures in the mouse gut, with representative images of CP, organized lymphoid structures and LAs in CD2DsRed mouse. Scale bars, 1,000 μm. b, Schematic of transfer of naive TCRHh T cells into Hh-colonized hosts. c, Representative fluorescence-activated cell sorting (FACS) plots of TCRHh T cells at the indicated sites 14 days after transfer of naive TCRHh T cells. d, Frequency of TCRHh cells among total CD4 T cells at indicated timepoints after transfer of naive TCRHh T cells. e, Frequency of Ki-67+ TCRHh cells at the indicated sites 14 days after transfer of naive TCRHh T cells. f, Representative FACS plots (left) and frequency of Treg cells of TCRHh (right) at 14 days after transfer of naive TCRHh T cells. g, Representative histogram overlay (left) and GFP MFI of TCRHhNur77GFP T cells (right) 11 days after transfer of naive TCRHh T cells. h, Representative FACS plots (left) and frequency of Il10+ cells among TCRHh T cells (right) 11 days after transfer of naive TCRHh T cells. i, Representative images of TCRHhNur77GFP (left and centre left) and TCRHhIl10GFP (centre right and right) T cells in the LA and LP. TCRHhNur77GFP and Il10-GFP-positive cells are indicated by white arrowheads. Scale bars, 50 μm. j, Frequency of Nur77GFP (left) and Il10-GFP-positive (right) cells among TCRHh T cells in the LA and LP. a, Representative images from two individual mice over two independent imaging experiments. ce, Four individual mice representative of two independent experiments. f, Seven individual mice representative of two independent experiments. g,h, Five individual mice representative of two independent experiments. i,j, Representative images and combined data from six individual mice over two independent imaging experiments. Scale bars, 50 μm. eh, One-way ANOVA using Tukey’s multiple comparisons test. j, Two-tailed t-test. Source Data
Fig. 2
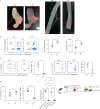
Fig. 2. cTreg cell and eTreg cell populations are transcriptionally and spatially distinct.
a, Schematic describing transfer of TCRHhCD2DsRedUbPA-GFP T cells into six CD2DsRedUbPA-GFP hosts with photo-activation, cell sorting and scRNA-seq. DC, dendritic cell; lymph, lymphatic; Mac, macrophage; Mono, monocyte. b, Left, UMAP visualization of T and ILC subsets across all locations. Right, distribution of lymphoid subsets (top) and cell numbers (bottom). NK, natural killer. c, UMAP visualization of Treg cell subsets across all locations (top left) and overlay on the UMAP plot of expression data for selected genes (middle; colours show relative expression). Right, distribution of Treg cell subsets (top) and cell numbers (bottom). d, Left, representative FACS plots of c-MAF versus TCF1 for Treg cells in tissue and MLN of Hh-colonized mice. Frequency of c-MAF+ (centre) and TCF1+ (right) Treg cells in tissue and MLN of SPF and Hh-colonized mice. e, Clonotype network analysis of TCRHh T cells and host clones by location (left) and cell phenotype (right). Each fully connected subnetwork represents a ‘clonotype cluster’ and each dot represents cells with identical receptor configurations. Clonotypes with fewer than two cells were filtered out for visualization. Prolif., proliferating. ac,e, One sequencing run from six combined mice. d, Five SPF and six Hh-colonized individual mice, representative of two independent experiments. d, One-way ANOVA using a Tukey’s multiple comparisons test. Source Data
Fig. 3
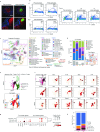
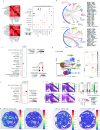
Fig. 3. Macrophage populations are enriched in the LP microniche.
a, Left, UMAP visualization of total myeloid subsets across all locations. Middle, UMAP of total myeloid populations by tissue microniche. Right, myeloid subset distribution (top) and total cell numbers at the indicated locations (bottom). b, log2-transformed fold difference of proportions of myeloid, T cells and ILCs in LA and LP. c, Representative CD11c and SIRPα immunofluorescence and DAPI staining in Hh-infected caecum tissue, showing an LA and surrounding LP. Scale bar, 50 μm. d, Representative CD206 immunofluorescence and DAPI staining in Hh-infected caecum tissue showing an LA and surrounding LP. Scale bars 50 μm. e, Densities of CD11c+SIRPα+ dendritic cells and CD206+ macrophages in the LA and LP microniches of Hh-infected caecum tissue. f, Violin plots of MHCII expression score across lymphoid and myeloid cells in the LP (top) and LA (bottom). Restricted to cell types with more than 30 cells per region. g, Relative mean expression of genes associated with STAT3 signalling and receptors in myeloid and lymphoid subsets in the LA and LP. Restricted to cell types with more than 30 cells per region. a,b,f,g, One sequencing run from four T cell compartments from six combined mice. ce, Two independent experiments with n = 6 per group. Each dot represents data from one individual mouse. e, One-way ANOVA using Tukey’s multiple comparisons test. Source Data
Fig. 4
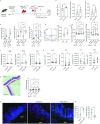
Fig. 4. Enrichment of the LA cell signature by spatial transcriptomics analysis is diminished in inflammation.
a, Schematic of the setup and analysis of the spatial transcriptomic experiment. b, Top, relative abundance of LA in Hh-infected mice versus Hh/anti-IL10R mice by NMF analysis (top) and manual annotation (bottom). c, H&E staining of Hh-infected tissue. Localization of LA-associated factor 15 by NMF decomposition as defined in Extended Data Fig. 8c (top left) and manual annotation (top centre and right) in the Visium RNA capture spots of a representative sample. Localization and normalized cell-type abundance of eMBCs (bottom left), naive CD8+ T cells (bottom middle) and LTi-like ILC3s (bottom right) in a representative LA. Scale bars, 200 μm. d, Cell-state enrichment ordered by cell lineage in the manually annotated LA versus LP spots in Hh-infected (top) and Hh/anti-IL10R (bottom) mice. Statistically significant enrichments (chi-square test, adjusted P value (Padj) < 0.05) are shown in magenta. Data are log2OR value ± s.d. progen. progenitor; TA, transit amplifying; GC, germinal centre; GC.BC/DZ-pre-mem, germinal centre B cell/dark zone and pre-memory; PC, plasma cell. e, CD11c and SIRPα immunofluorescence and DAPI staining in Hh/anti-IL10R mice, showing LA and surrounding LP. Scale bar, 100 μm. f, CD206 immunofluorescence and DAPI staining in Hh/anti-IL10R mice, showing LA and surrounding LP. Scale bar, 100 μm. g, Density of CD11c+SIRPα+ dendritic cells and CD206+ macrophages in LA and LP of Hh/anti-IL10R mice. h, Ratio of SIRPα+ dendritic cell and CD206 macrophage cell densities in LA vs LP in Hh and Hh/anti-IL10R mice. ad,i, Four individual mice per group sequenced from two Visium slides. eh, Two independent experiments with n = 6 per group. Each dot represents one mouse. g,h, One-way ANOVA using Tukey’s multiple comparisons test with single pooled variance. Source Data
Fig. 5
Fig. 5. In vivo live imaging demonstrates Il10+ TCRHh T cells interacting with CD206+ = macrophages in the LP.
a, CellPhoneDB analysis of receptor–ligand interactions in LP (top left) and LA (top right), restricted to cell types with more than 30 cells per region and limited to unique pairs with P < 0.01. MHCII interactions are excluded. Schematic summarizing the most relevant cell–cell interactions (bottom). b, Two-photon in vivo live imaging of TCRHhCD2DsRedIl10GFP T cells transferred into Hh-colonized hosts labelled in vivo with CD206 and F4/80 fluorescent antibodies. c, Representative image of donor TCRHhCD2DsRedIl10GFP T cells in the LP. Arrowheads indicate Il10 TCRHh (red) and Il10+ TCRHh (yellow) T cells. Scale bar, 20 μm. d, Average track speed of Il10+ and Il10 TCRHh T cells in the LP. e, Track displacement length of Il10+ and Il10 TCRHh T cells in the LP. f, Sequential video stills showing an Il10+ TCRHh T cell moving from one CD206+ cell to another in the LP. Scale bars, 10 μm. g, Distance from Il10+ and Il10 TCRHh to the nearest CD206+ cell in the LP. a,b, One sequencing run from six combined mice. dh, Representative images and combined data from six individual mice over two independent imaging experiments. d,e,g, Mann–Whitney test. Source Data
Extended Data Fig. 1
Extended Data Fig. 1. Immunofluorescent characterisation of intestinal lymphoid structures.
Immunofluorescent expression of DAPI, B220, CD4 and MHCII in the a. caecal patch (scale bar 400 mm). b. organised lymphoid structure (scale bar 200 mm). c. lymphoid aggregate (scale bar 50 mm). d. Gating strategy of FACS sorting of naive T cells from TCRHh donor mice. a-c: Representative images from 2 individual mice over two independent imaging experiments.
Extended Data Fig. 2
Extended Data Fig. 2. TCRHh on a Rag1−/− background validates specificity of TCRHh to Hh.
a. Frequency of Ki-67+ of TCRHh in the tissue (left), MLN (centre left), CP (centre right) and OLS (right) from day 1 to day 14 post cell transfer. b. Co-transfer of naive TCRHhRag1+/− and TCRHhRag1−/− into Hh-colonised hosts. c. Representative FACS plots of TCRHhRag1+/− and TCRHhRag1−/− at the indicated sites. d. Frequency of TCRHhRag1+/− and TCRHhRag1−/− of total CD4 T cells at indicated sites. e. Representative FACS plots (left) and frequency (right) of TCRHhRag1+/− and TCRHhRag1−/− Tregs of TCRHh CD4 T cells. f. Representative FACS plots of TCRHhRag1+/− and TCRHhRag1−/− in Hh-colonised and un-colonised hosts. a: 4 individual mice representative of 2 independent experiments. c-f: 7 individual mice representative of 2 independent experiments. d-e: two-way ANOVA using a Šidák’s multiple comparisons test with individual variances computed for each comparison. Source Data
Extended Data Fig. 3
Extended Data Fig. 3. FTY720 treatment supports tissue as a dominant site of TCR signalling and IL-10 production.
a. Geometric MFI (left) and frequency (right) of Nur77GFP positive of TCRHh Tregs at the indicated sites. b. Frequency of IL-10+ of TCRHh Tregs at the indicated sites. c. Histogram overlay (left) and quantification of geometric MFI (right) of TCRHhNur77GFP co-cultured with Hh-pulsed BMDCs at the indicated time points. d. Transfer of TCRHhNur77GFP into FTY720-treated host mice. e. Representative FACS plots (left) and quantification (right) of TCRβ of total CD45 in peripheral blood. f. Geometric MFI of total TCRHhNur77GFP in FTY720 treated hosts at the indicated sites. g. Geometric MFI of total TCRHhNur77GFP in the tissue of control and FTY720 treated hosts. h. Frequency of IL-10GFP positive among total TCRHh in FTY720 treated hosts. i. Frequency of IL-10GFP positive among total TCRHh in the tissue of control and FTY720 treated hosts. j. Absolute TCRHh cell numbers in tissue of control and FTY720-treated hosts. a: 6 individual mice representative of 2 independent experiments. b: 5 individual mice representative of 2 independent experiments. c: 3 technical replicates representative of 2 independent experiments. e-j: 4 WT and 5 FTY720 treated mice representative of 2 independent experiments. a-b, f, h: one-way ANOVA using a Tukey’s multiple comparisons test. e, g, i-j: two-tailed t test. Source Data
Extended Data Fig. 4
Extended Data Fig. 4. IL-10 is critical for maintaining homeostasis but LNs are not required for the pathogenic response to Hh in LTa−/− mice.
a. Representative images of the caecal patch (left) and OLS (right) in Hh-colonised WT and LTa−/− hosts. b. Representative FACS plots of TCRHh in tissue at 10 days post naïve TCRHh cell transfer. c. Absolute TCRHh cell count in tissue of Hh-colonised WT and LTa−/− hosts. d. Absolute host CD4 + T cell count in tissue in Hh-colonised WT and LTa−/− hosts. e. Representative FACS plots (left) and frequency of Tregs among TCRHh (right) in tissue of WT and LTa−/− hosts at 10 days post naïve TCRHh transfer. f. Representative FACS plots (left) and frequency of IL-10+ among TCRHh (right) in tissue of WT and LTa−/− hosts at 10 days post naïve TCRHh transfer. g. Absolute cell count of IL-10+ among TCRHh in tissue of WT and LTa−/− hosts at 10 days post naïve TCRHh transfer. h. Frequency of IL-10+ of TCRHh Tregs in tissue of Hh-colonised WT and LTa−/− hosts at 10 days post naïve TCRHh transfer. i. Colon histopathology score of Hh-colonised WT and LTa−/− mice with and without anti-IL-10R treatment. j. Two photon in vivo live imaging of transferred naive TCRHhCD2dsRedNur77GFP or TCRHhCD2dsRedIL-10GFP into Hh-colonised Foxp3GFP hosts. The caecum LA and LP were imaged. a: Representative images from 3 individual mice across 2 independent experiments. b-h: 4 WT and 4 LTa−/− individual mice representative of 2 independent experiments. i: 5 WT and 5 LTa−/− individual mice representative of 2 independent experiments. c-h: two-tailed t test. i: one-way ANOVA using a Tukey’s multiple comparisons test. Source Data
Extended Data Fig. 5
Extended Data Fig. 5. FACS cell sorting of photoactivated cells and tissue memory heterogeneity.
a. Representative images of pre- and post-photoactivation of LA (top) and T cell zone of CP (bottom). b. Gating strategy of cell sorting by FACS of GFP+ cells in the caecal patch (top left), MLN (bottom left) and caecum LA and LP (right). GFP gate set on un-photoactivated samples. c. UMAP visualisation of total cell subsets (left) with detailed cell type annotations (right). d. Bar chart showing total cell subsets across all tissue niches (top left) and cell numbers (bottom left). UMAP visualisation of cell lineages by gut region (bottom right). e. UMAP of CD4 memory, Th17, and gd T cells subsets (top). Overlap of cell location (bottom). f. Gene overlays of CD4 memory subsets from all tissues. g. Gene expression of canonical Th1 and Th17 genes expressed by the CD4 memory subsets. h. Frequency bar chart showing the subsets of CD4 T cells in the LA and LP. a-h: Representative of 6 combined mice.
Extended Data Fig. 6
Extended Data Fig. 6. Developmental relationships between transcriptionally distinct cTregs, eTregs and proliferating Tregs.
a. Heatmap of differentially expressed genes in cTreg, eTreg and proliferating Tregs. b. UMAP of Treg subsets per location, filtering out the subsets with less than 10 cells in a given location (i.e. excluding eTregs_MLN, eTregs_CP, cTregs_LA, cTregs_LP and Prolif-Tregs_CP). Arrows depict summarised scVelo differentiation trajectories (top). Heat map overlay on the Treg UMAP indicating velocity pseudotime, as calculated by scVelo (bottom). c. Velocity analysis of genes that vary across the differentiation trajectory of all Treg subsets. d. Rorc and Gata3 expression of Tregs with Maf expression overlaid in red. e. Heatmap of differentially expressed genes between eTregs in MLN and LP. f. UMAP of the total Treg population with distributions of Treg subsets across locations (top) and overlay of TCRHh Tregs (below). g. UMAP overlay of clone size (top) and clone specificity (bottom) of TCRHh within total T cell populations. h. Barchart showing the distribution of most expanded TCRHh and host clones by location (top) and T cell subset (bottom). i. Heatmap of differentially expressed genes of host LP vs LA eTregs. Blue lines indicate gene expression profile of TCRHh eTregs in LP and LA. a-i: Representative of 6 combined mice.
Extended Data Fig. 7
Extended Data Fig. 7. Treatment with FTY720 does not affect the phenotype and proliferation of TCRHh blocked with anti-IL-10R.
a. TCRHh were transferred into Hh colonised host mice, treated with daily FTY720 from day 15 and anti-IL-10R at day 17. b. Frequency of Foxp3 among total TCRHh CD4 T cells (left), geometric MFI of Foxp3 expression in TCRHh Tregs (centre) and geometric MFI of c-MAF expression in TCRHh Tregs (right) in control and anti-IL-10R treated mice at day 20. c. Ki-67 of total CD4 T cells of TCRHh and host cells (left), Ki-67 of TCRHh Tregs (centre) and Ki-67 of TCRHh Th17 cells (right) in control and anti-IL-10R treated mice at day 24 with and without FTY720 blockade. d. Representative FACS plot of c-MAF versus Ki-67 in TCRHh Tregs (left) and c-MAF geometric MFI of Ki-67+ vs Ki-67- TCRHh Tregs (right). e. Geometric MFI of Foxp3 (left) and c-MAF (right) of TCRHh Tregs in control and anti-IL-10R treated mice with and without FTY720 blockade. g. Expression of Ifnγ (left), Il17α (centre) and Il6 (right) in caecum tissue by qPCR in control and anti-IL-10R treated mice at day 24. g. Expression of Il27 (left), Il10 (centre left), Il2 (centre right) and Il23a (right) in caecum tissue by qPCR in control and anti-IL-10R treated mice at day 24. h. Representative H and E staining (left top and bottom) and histopathology score (right top) of caecum tissue from control and anti-IL-10R treated mice at day 24. Scale bar represents 1 mm. i. Colon histopathology score in control and anti-IL-10R treated mice with and without FTY720 blockade. j. Representative immunofluorescent staining of Foxp3 and Ki-67 in LA (left, arrows mark Ki-67 negative Tregs), control LP (centre, arrows mark Ki-67 negative Tregs), and anti-IL-10R treated LP (right, arrows mark Ki-67 positive Tregs). k. Frequency of Ki-67 positive Tregs in the LP of control and anti-IL-10R treated mice (left) and frequency of Ki-67 positive Tregs in the LP and LA in both control and anti-IL-10R treated mice (right). b-i: 6 individual mice per group representative of 2 independent experiments. f: 11 control and 11 anti-IL-10R treated mice combined over 2 independent experiments. J-k: 5 individual mice per group representative of 2 independent experiments. b, d, f, g, k: two-tailed t test. c, e, i: one-way ANOVA using a Tukey’s multiple comparisons test. Source Data
Extended Data Fig. 8
Extended Data Fig. 8. Validation of micro-niches by ST analysis and NICHE-seq.
a. Representative H&E image with manually annotated LA and LP from Hh/anti-IL-10R. b. Visual representation of cell cycle scoring of Hh (top) and Hh/anti-IL-10R (middle) treated gut swiss-rolls with quantification of S score (bottom left) and G2M score (bottom). c. Cell type decomposition of gut swiss rolls in Hh (left) and Hh/anti-IL-10R (right) treated mice. Dotplots showing NMF weights of cell types (columns) across NMF factors (rows), which correspond to tissue microenvironments (normalized across factors per cell type by dividing by maximum values). d. Identification of microglia/enteric neurone associated factor 5 (left) and LA associated factor 3 (right). e. Hh/anti-IL-10R swiss roll H&E. Localisation of LA associated factor 3 by NMF -based decomposition and its overlying RNA capture spots (top left). Localisation of LA and its overlying capture spot as defined by manual annotation (top centre and right). Localisation and normalized cell type abundance of eMBCs (bottom left), naïve CD8 + T cells (bottom centre) and LTi-like ILC3s (bottom right) in representative LA. f. Dotplot of Il10 and Il6 gene expression in the LA and LP by ST analysis (left). Violin plot of relative distribution of Il10 gene expression in the LA and LP by ST analysis (right). g. Cell type abundance in manually annotated LA and LP regions of Hh (top) and Hh/anti-IL-10R (bottom). Relative weights, normalized across LA/LP for every cell type. Cell type loadings represented by dot size and colour. h. Cell state enrichment (odds ratio) in the manually annotated LA vs the rest of the tissue in Hh (top) and Hh/anti-IL-10R (bottom). Statistically significant enrichments (chi-square test, p < 0.05) are shown in magenta-pink. Data show value ± SD. i. Cell state enrichment (odds ratio) in the manually annotated LA vs the rest of the tissue with muscularis mucosa removed in Hh (top) and Hh/anti-IL-10R (bottom). Statistically significant enrichments (chi-square test, p < 0.05) are shown in magenta-pink. Data show value ± SD. a-i: Representative of 4 individual mice per group (Hh and Hh/anti-IL-10R sequenced from two Visium slides.
Extended Data Fig. 9
Extended Data Fig. 9. Expression of cytokines and chemokine for eTreg function.
a. Co-occurrence analysis of Hh (left top) and Hh/anti-IL-10R (left bottom) with the ratio of the two conditions (right). Size of dots represents p-values and the colour represents fold change. Number of spots analysed after removing Muscularis-associated NMF factors (4405 spots) are Hh/anti-IL-10R: 9572 spots and Hh: 8815 spots. b. Chord diagrams showing significant interactions of Tregs with lymphoid and myeloid cells in LP (top) and LA (bottom). Restricted to cell types with >30 cells per region and significance p < 0.05 for interactions between any cell pair. c.Dot plot showing relative expression by NICHE-seq analysis of survival cytokine genes expressed by all the cell types with >30 cells in LA or LP regions (left) and their receptors on Treg populations (right). b. NICHE-seq analysis UMAP visualisation of T-cell subsets (left) with overlay of Ccr5 and Ccr2 expression (right). c. Dot plot showing expression of Ccr2 and Ccr5 and their ligands (Ccl7 and Ccl8) in myeloid cells, T cells and ILCs isolated from the LA and LP NICHE-seq analysis. d. Localisation of Ccr2 (top left), Cxcr3 (top centre) and Cxcr4 (bottom left) expression in LA and LP by ST analysis on H&E (bottom centre). Violin plots of relative distribution of Ccr2, Cxcr3 and Cxcr4 expression (top right). Dot plot of Ccr2, Cxcr3 and Cxcr4 expression in the LA and LP by ST analysis (bottom right). e. Ligand-receptor analysis on Visium data. Adjusted p-values were calculated per spot using the package stLearn and displayed in the spatial context for particular ligand-receptor pairs (‘Ccl8_Ccr2’ and ‘Cxcl9_Cxcr3’) in two representative Hh samples (above, Hh mouse 2 and below Hh mouse 4). a-c: One sequencing run from 6 combined mice. d-e: Two representative samples of 4 individual mice per group (Hh and Hh/anti-IL-10R sequenced from two Visium slides.

References

    1. Barnes MJ, Powrie F. Regulatory T cells reinforce intestinal homeostasis. Immunity. 2009;31:401–411. doi: 10.1016/j.immuni.2009.08.011. - DOI - PubMed
    1. Maloy KJ, Powrie F. Intestinal homeostasis and its breakdown in inflammatory bowel disease. Nature. 2011;474:298–306. doi: 10.1038/nature10208. - DOI - PubMed
    1. Miragaia RJ, et al. Single-cell transcriptomics of regulatory T cells reveals trajectories of tissue adaptation. Immunity. 2019;50:493–504.e497. doi: 10.1016/j.immuni.2019.01.001. - DOI - PMC - PubMed
    1. Whibley N, Tucci A, Powrie F. Regulatory T cell adaptation in the intestine and skin. Nat. Immunol. 2019;20:386–396. doi: 10.1038/s41590-019-0351-z. - DOI - PubMed
    1. Tas JM, et al. Visualizing antibody affinity maturation in germinal centers. Science. 2016;351:1048–1054. doi: 10.1126/science.aad3439. - DOI - PMC - PubMed

Publication types

MeSH terms