. 2024 May;629(8010):136-145.
doi: 10.1038/s41586-024-07278-3. Epub 2024 Apr 3.

The variation and evolution of complete human centromeres

Affiliations

The variation and evolution of complete human centromeres

Glennis A Logsdon et al. Nature. 2024 May.

Abstract

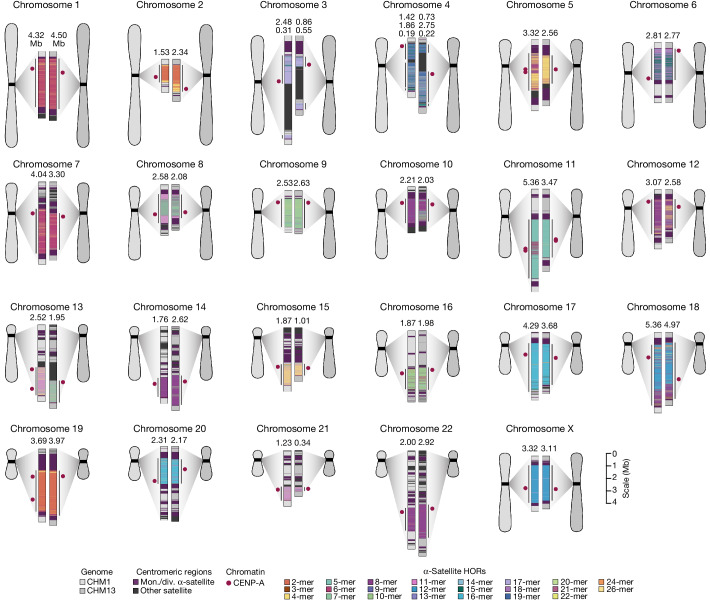
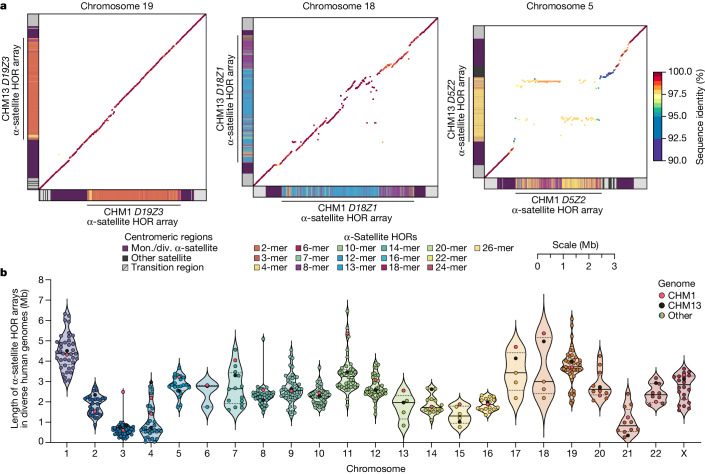
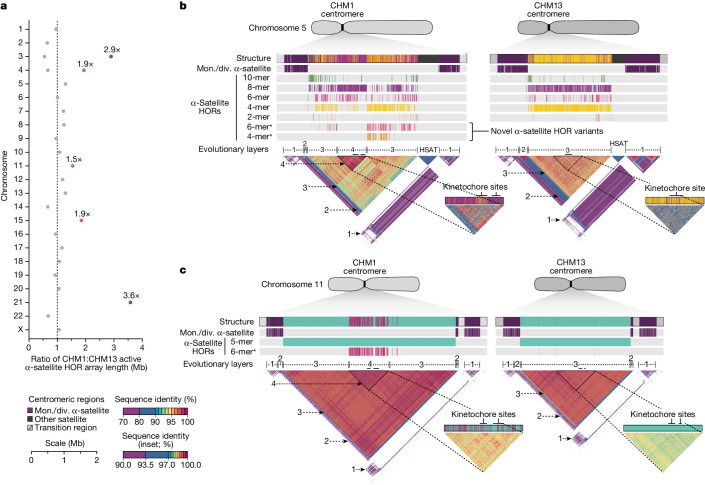
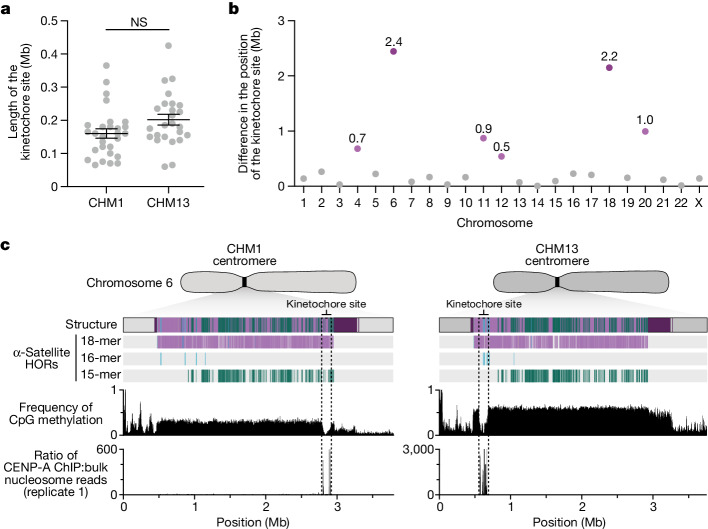
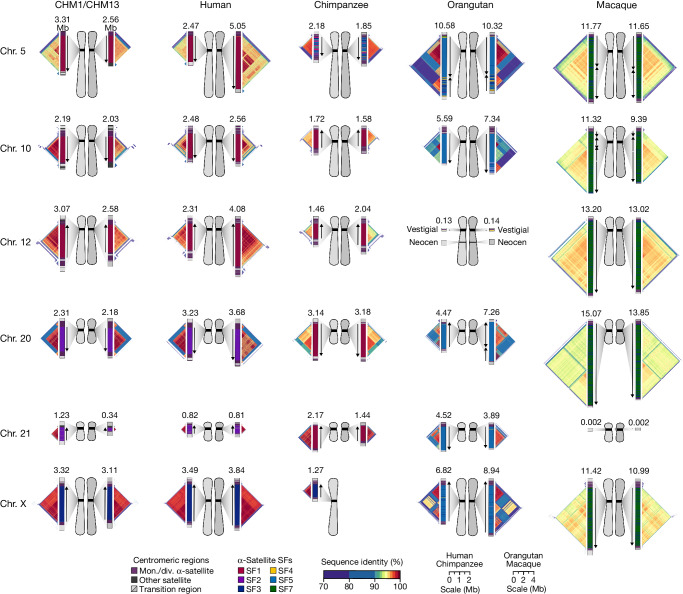
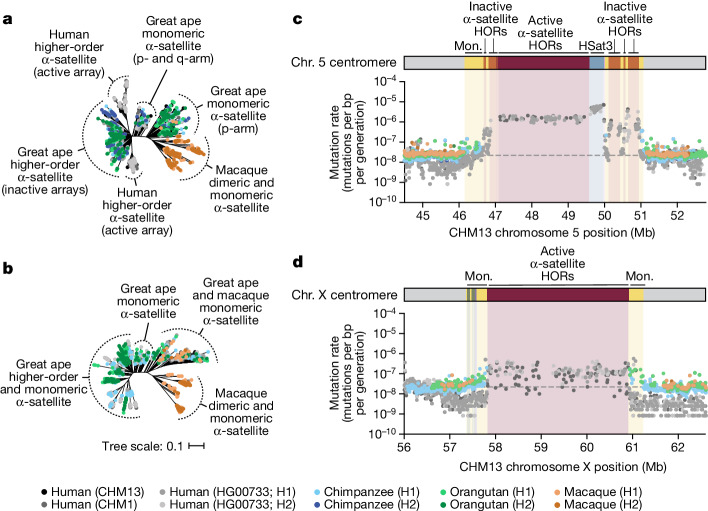
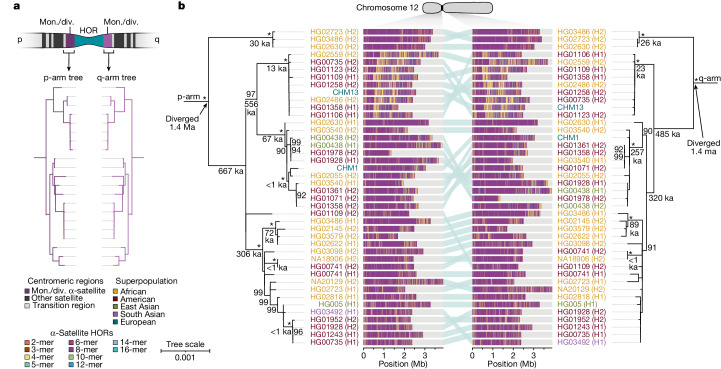
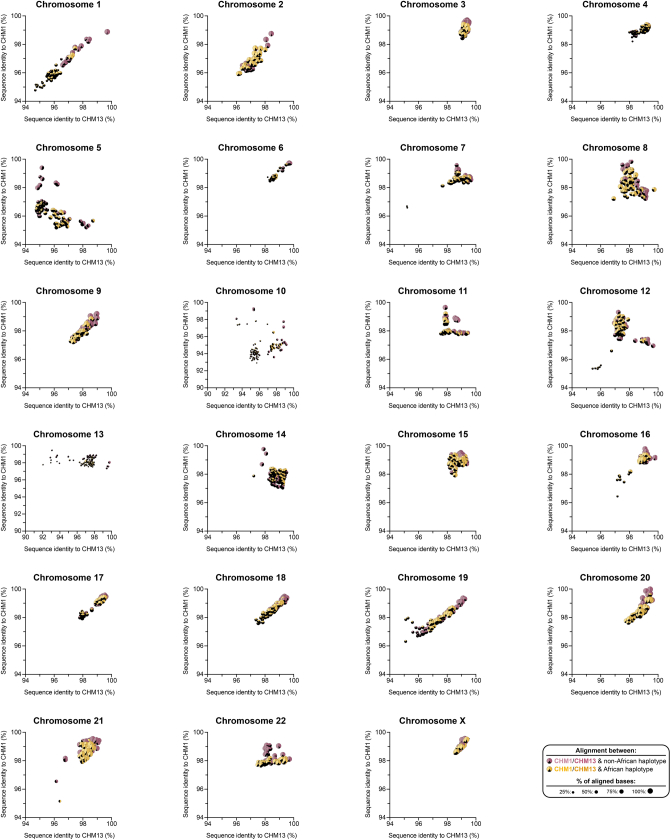
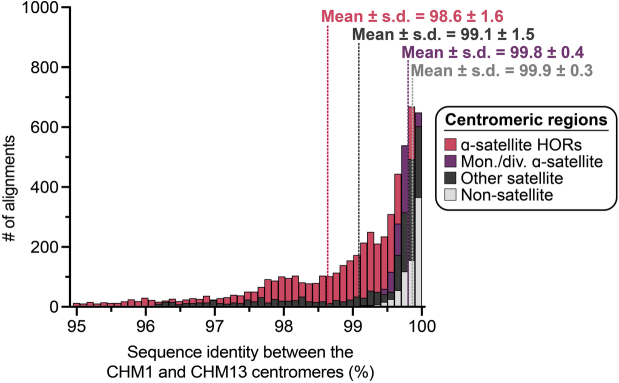
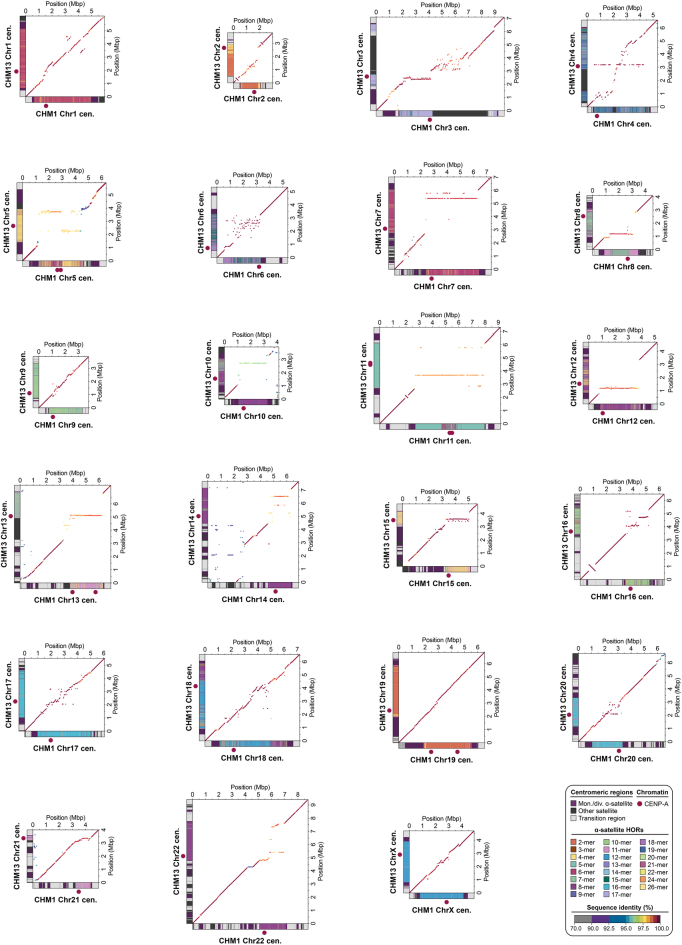
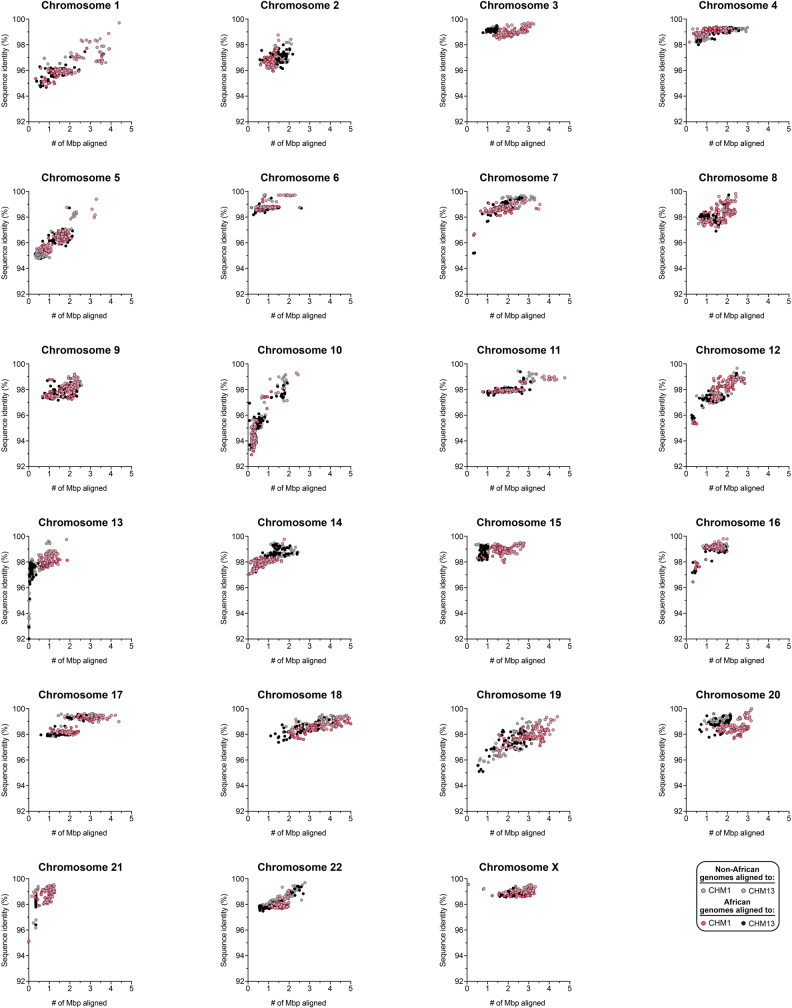
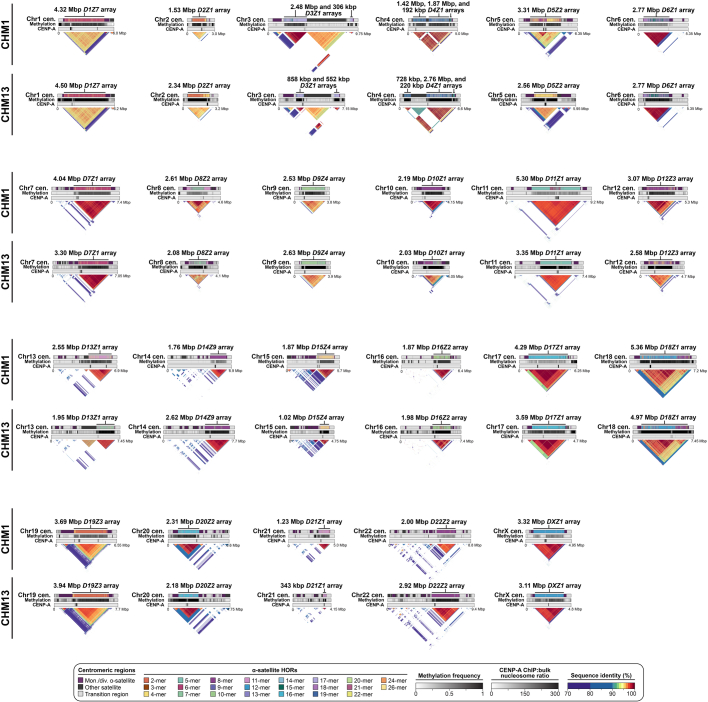
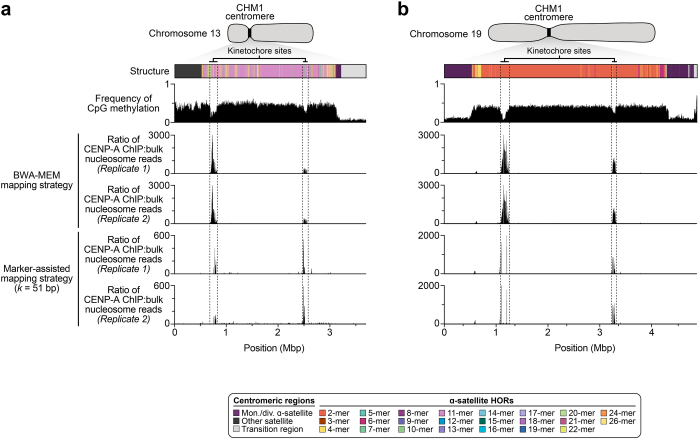
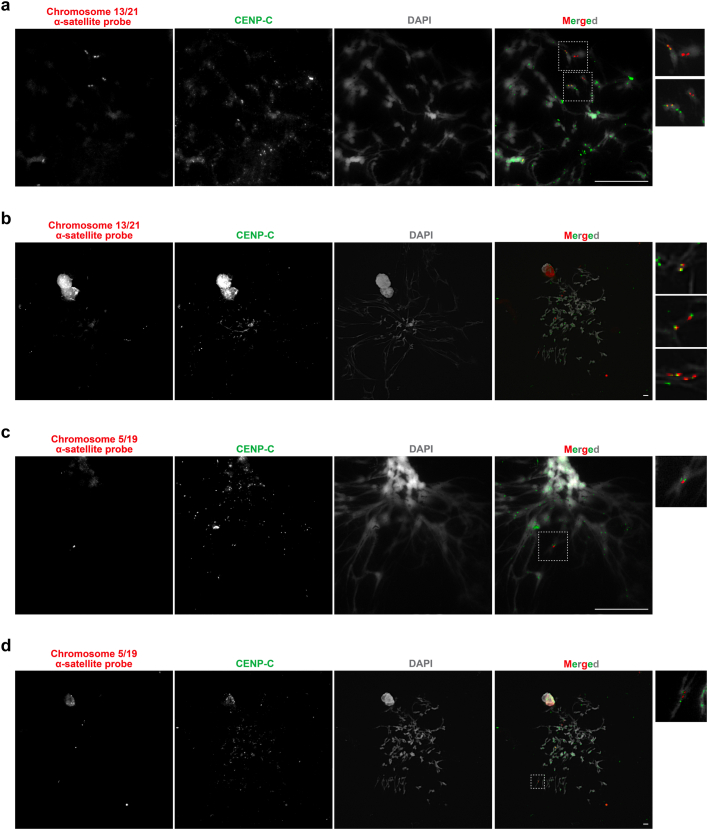
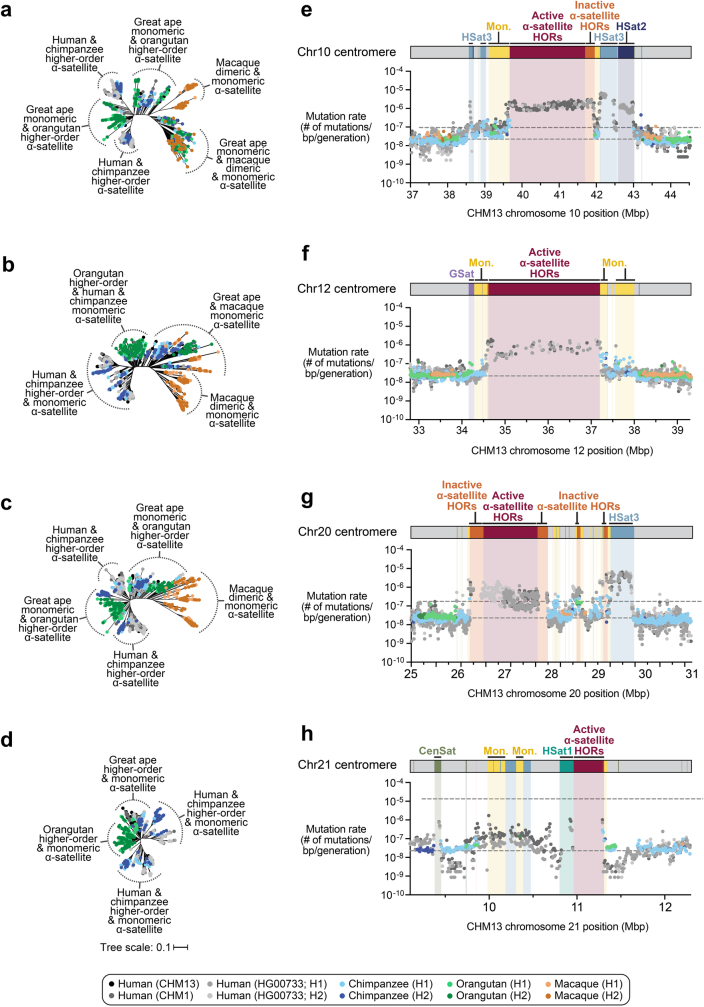
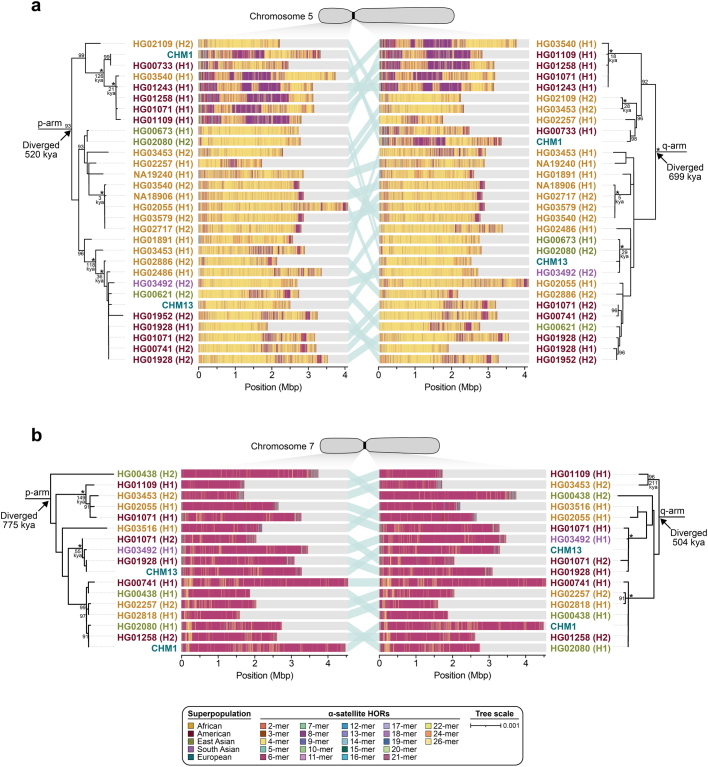
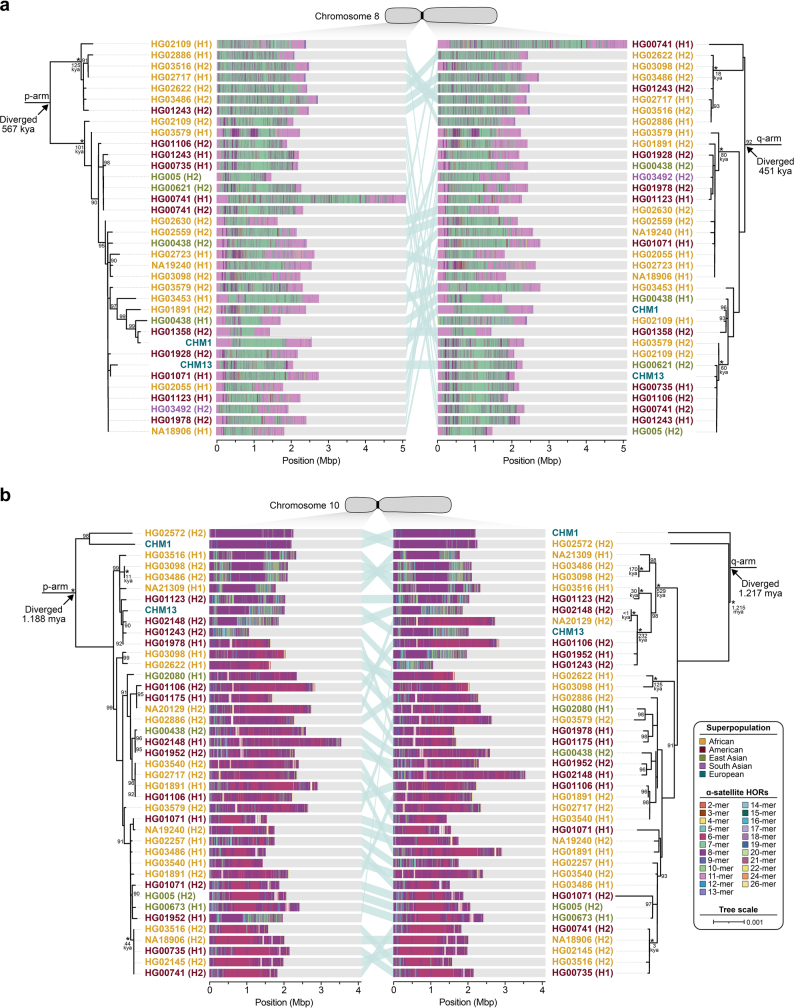
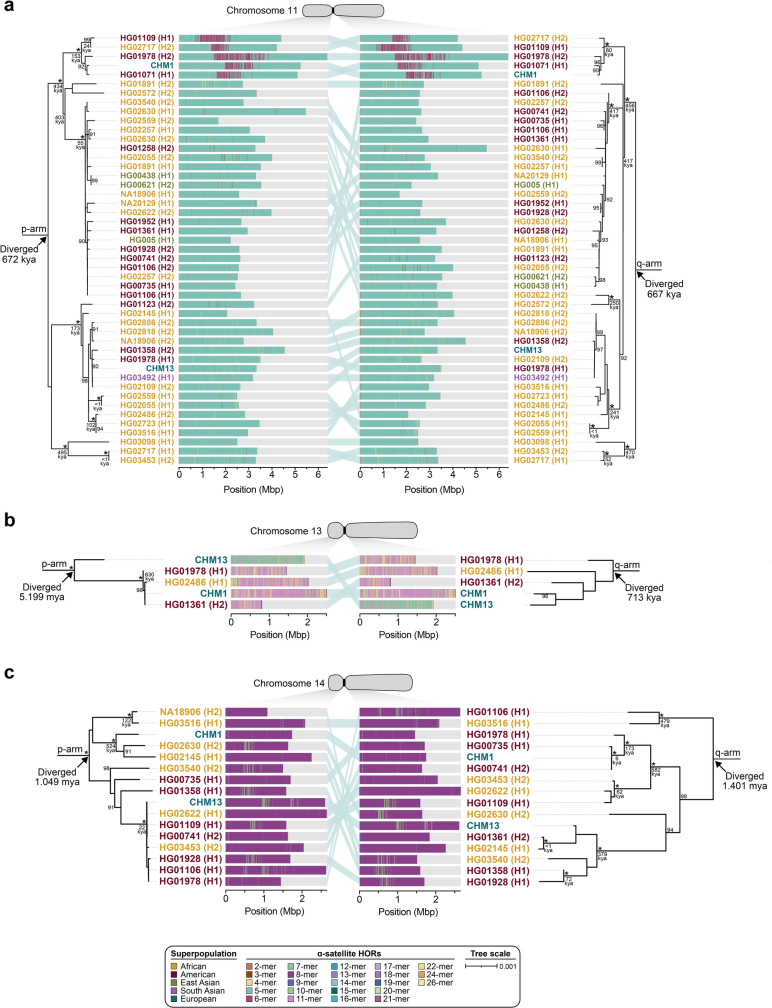
Human centromeres have been traditionally very difficult to sequence and assemble owing to their repetitive nature and large size1. As a result, patterns of human centromeric variation and models for their evolution and function remain incomplete, despite centromeres being among the most rapidly mutating regions2,3. Here, using long-read sequencing, we completely sequenced and assembled all centromeres from a second human genome and compared it to the finished reference genome4,5. We find that the two sets of centromeres show at least a 4.1-fold increase in single-nucleotide variation when compared with their unique flanks and vary up to 3-fold in size. Moreover, we find that 45.8% of centromeric sequence cannot be reliably aligned using standard methods owing to the emergence of new α-satellite higher-order repeats (HORs). DNA methylation and CENP-A chromatin immunoprecipitation experiments show that 26% of the centromeres differ in their kinetochore position by >500 kb. To understand evolutionary change, we selected six chromosomes and sequenced and assembled 31 orthologous centromeres from the common chimpanzee, orangutan and macaque genomes. Comparative analyses reveal a nearly complete turnover of α-satellite HORs, with characteristic idiosyncratic changes in α-satellite HORs for each species. Phylogenetic reconstruction of human haplotypes supports limited to no recombination between the short (p) and long (q) arms across centromeres and reveals that novel α-satellite HORs share a monophyletic origin, providing a strategy to estimate the rate of saltatory amplification and mutation of human centromeric DNA.


Conflict of interest statement

S.N. is an employee of Oxford Nanopore Technologies. S.K. has received travel funds to speak at events hosted by Oxford Nanopore Technologies. E.E.E. is a scientific advisory board member of Variant Bio. The other authors declare no competing interests.

Figures

Fig. 1
Fig. 1. Overview of the centromeric genetic and epigenetic variation between two human genomes.
Complete assembly of centromeres from two hydatidiform moles, CHM1 and CHM13, reveals both small- and large-scale variation in centromere sequence, structure and epigenetic landscape. The CHM1 and CHM13 centromeres are shown on the left and right, respectively, between each pair of chromosomes. The length (in Mb) of the α-satellite higher-order repeat (HOR) array(s) is indicated, and the location of centromeric chromatin, marked by the presence of the histone H3 variant CENP-A, is indicated by a dark red circle. Transposable elements that are polymorphic in these regions are shown in Supplementary Fig. 73. Mon./div., monomeric/diverged.
Fig. 2
Fig. 2. The variation in sequence and structure between two sets of human centromeres.
a, The allelic variation between CHM1 and CHM13 centromeric/pericentromeric haplotypes. Diagonal lines are coloured according to per cent sequence identity. The α-satellite HOR array structure is shown on the axes, along with the organization of each centromeric/pericentromeric region. b, The length of the active α-satellite HOR arrays among the CHM1 (red), CHM13 (black) and complete HPRC/HGSVC (various colours) centromeres. n = 626. The α-satellite HOR arrays range in size from 0.03 Mb on chromosome 4 to 6.5 Mb on chromosome 11. Data are mean (solid black bar) and 25% and 75% quartiles (dotted black bars).
Fig. 3
Fig. 3. Variation in the length and sequence composition of human centromeric α-satellite HOR arrays.
a, Ratio of the length of the active α-satellite HOR arrays in the CHM1 genome compared with those in the CHM13 genome. b,c, Comparison of the CHM1 and CHM13 chromosome 5 D5Z2 α-satellite HOR arrays (b) and CHM1 and CHM13 chromosome 11 D11Z1 α-satellite HOR arrays (c). The CHM1 chromosome 5 D5Z2 array contains two novel α-satellite HOR variants (Supplementary Fig. 44a) as well as a new evolutionary layer (layer 4; indicated by an arrow), which is absent from the CHM13 array. Similarly, the CHM1 chromosome 11 D11Z1 α-satellite HOR array contains a six-monomer HOR variant that is much more abundant than in the CHM13 array and comprises a new evolutionary layer, or a stretch of sequence that has evolved separately from neighbouring sequences (layer 4; indicated with an arrow), although this 1.21 Mb segment is more highly identical to the flanking sequence. The inset shows each of the new evolutionary layers with a higher stringency of sequence identity, as well as the relative position of the kinetochore. Notably, the α-satellite HOR variants comprising the new evolutionary layers in both CHM1 chromosomes 5 and 11 have divergent CpG methylation patterns despite their identical structure (Supplementary Fig. 74). Asterisk, α-satellite HORs variants that are either novel or present in higher abundance in the CHM1 centromere relative to the CHM13 centromere.
Fig. 4
Fig. 4. Variation at the site of the kinetochore among two sets of human centromeres.
a, Comparison of the length of the kinetochore site, marked by hypomethylated DNA and CENP-A-containing chromatin, between the CHM1 and CHM13 centromeres. n = 28 and 25 kinetochore sites for the CHM1 and CHM13 centromeres, respectively. Data are mean ± s.e.m. Statistical analysis was performed using a two-sided Kolmogorov–Smirnov test; NS, not significant. b, The difference in the position of the kinetochore among the CHM1 and CHM13 centromeres. c, Comparison of the CHM1 and CHM13 chromosome 6 centromeres, which differ in kinetochore position by 2.4 Mb.
Fig. 5
Fig. 5. Sequence and structure of six sets of centromeres from diverse primate species.
Complete assembly of centromeres from chromosomes 5, 10, 12, 20, 21 and X in human, chimpanzee, orangutan and macaque reveals diverse α-satellite SF organization and evolutionary landscapes. Sequence identity maps generated using StainedGlass are shown for each centromere (Methods and Supplementary Figs. 75–80), with the size of the α-satellite higher-order (human, chimpanzee and orangutan) or dimeric (macaque) repeat array indicated in Mb. The α-satellite SF for each centromeric array is indicated (vertical bar colour), with arrows illustrating the orientation of the repeats within the array. Chromosome 12 in orangutan has a neocentromere, while the chromosome 21 centromere in macaque is no longer active due to a chromosomal fusion event in that lineage. All chromosomes are labelled according to the human phylogenetic group nomenclature. The human diploid genome used as a control (second column) is HG00733—a 1000 Genomes sample of Puerto Rican origin. Note that the orangutan and macaque centromeres are drawn at half the scale with respect to the other apes.
Fig. 6
Fig. 6. Centromeres evolve with different evolutionary trajectories and mutation rates.
a,b, Phylogenetic trees of human, chimpanzee, orangutan and macaque α-satellites from the higher-order and monomeric (mon.) α-satellite regions of the chromosome 5 (a) and X (b) centromeres, respectively. c,d, The mutation rate of the chromosome 5 (c) and X (d) centromeric regions, respectively. Individual data points from 10 kb pairwise sequence alignments are shown. Note that the regions corresponding to the active α-satellite HORs have only approximate mutation rates based on human–human comparisons. Owing to unequal rates of mutation and the emergence of new α-satellite HORs, interspecies comparisons are not possible in these regions. HSat3, human satellite 3.
Fig. 7
Fig. 7. Phylogenetic reconstruction of human centromeric haplotypes and the saltatory amplification of new α-satellite HORs.
a, The strategy to determine the phylogeny and divergence times of completely sequenced centromeres using monomeric α-satellite or unique sequence flanking the canonical α-satellite HOR array from both the p- and q-arms. Chimpanzee was used as an outgroup with an estimated species divergence time of 6 million years ago (Ma). b, Maximum-likelihood phylogenetic trees depicting the p- and q-arm topologies along with the estimated divergence times reveal a monophyletic origin for the emergence of new α-satellite HORs within the chromosome 12 (D12Z3) α-satellite HOR array. This array shows a complex pattern of new α-satellite HOR insertions and deletions over a short period of evolutionary time. The asterisks indicate nodes with 100% bootstrap support, and nodes with 90–99% bootstrap support are indicated numerically. Nodes without an asterisk or number have bootstrap support <90%. The haplotypes from the p- and the q-arm trees are linked with a light teal bar, as shown in the schematic in a. Note that most differences in the order of the haplotypes occur at the terminal branches, where the order of sequence taxa can be readily reshuffled to establish near-complete concordance. Thus, there are no significant changes in the overall topologies of the phylogenetic tree. ka, thousand years ago.
Extended Data Fig. 1
Extended Data Fig. 1. Variation in the sequence and structure of centromeric α-satellite higher-order repeat (HOR) arrays among 56 diverse human genomes.
Plots showing the percent sequence identity between centromeric α-satellite HOR arrays from CHM1 (y-axis), CHM13 (x-axis), and 56 other diverse human genomes [generated by the Human Pangenome Reference Consortium (HPRC) and Human Genome Structural Variation Consortium (HGSVC)]. Each data point shows the percent of aligned bases from each human haplotype to either the CHM1 (left) or CHM13 (right) α-satellite HOR array(s). The percent of unaligned bases are shown in black. The size of each data point corresponds to the total percent of aligned bases among the CHM1 and CHM13 centromeric α-satellite HOR arrays. Precise quantification of the sequence identity and proportion of aligned versus unaligned sequences is provided in Supplementary Table 6. Enlarged versions of these plots are shown in Supplementary Figs. 14, 15.
Extended Data Fig. 2
Extended Data Fig. 2. Sequence identities between the CHM1 and CHM13 centromeric regions.
Histogram showing the distribution of sequence identities from complete contig alignments between centromeric regions in the CHM1 and CHM13 genomes. The α-satellite HOR, monomeric/divergent α-satellite, other satellite, and non-satellite portions were assessed separately and reveal a much larger distribution in sequence identities for the α-satellite HORs. The mean and standard deviation (s.d.) are indicated.
Extended Data Fig. 3
Extended Data Fig. 3. Comparison of the CHM1 and CHM13 centromeric regions.
Dot plots showing the percent sequence identity between the CHM1 and CHM13 centromeric regions. Plots were generated with StainedGlass. Enlarged versions of these plots are shown in Supplementary Figs. 16, 17.
Extended Data Fig. 4
Extended Data Fig. 4. Comparison of CHM1 and CHM13 centromeric α-satellite HOR arrays to those from 56 diverse human genomes.
Plots showing the percent sequence identity and number of megabase pairs (Mbp) aligned for 56 diverse human genomes (112 haplotypes), generated by the HPRC and HGSVC, mapped to the CHM1 and CHM13 centromeric regions. Note that each data point represents a haplotype with 1:1 best mapping, although many of the centromeres are not yet complete in the HPRC and HGSVC assemblies. Enlarged versions of these plots are shown in Supplementary Figs. 18, 19.
Extended Data Fig. 5
Extended Data Fig. 5. Comparison of the genetic, epigenetic, and evolutionary landscapes between the CHM1 and CHM13 centromeric regions.
Plots showing the sequence organization (top track), CpG methylation frequency (second track), CENP-A nucleosome enrichment (third track), and evolutionary layers (bottom triangle) for each CHM1 and CHM13 centromeric region. Enlarged versions of these plots are shown in Supplementary Figs. 45–67.
Extended Data Fig. 6
Extended Data Fig. 6. CHM1 chromosome 13 and 19 centromeres have two regions enriched with CENP-A chromatin within hypomethylated α-satellite DNA.
a,b) Two strategies for mapping CHM1 CENP-A ChIP-seq data (Methods) reveal similar patterns of CENP-A chromatin enrichment, with two regions enriched with CENP-A that coincide with hypomethylated α-satellite DNA within the CHM1 a) chromosome 13 and b) chromosome 19 α-satellite HOR arrays.
Extended Data Fig. 7
Extended Data Fig. 7. The CHM1 chromosome 13 centromere likely has one kinetochore site, while the CHM1 chromosome 19 centromere has two kinetochore sites.
a-d) Immuno-FISH staining of stretched metaphase chromosome spreads from CHM1 cells with a fluorescent antibody against CENP-C (an inner-kinetochore protein; green) as well as a fluorescent chromosome 13/21 α-satellite DNA probe (a,b; red) or a fluorescent chromosome 5/19 α-satellite DNA probe (c,d; red). We find that there is a single CENP-C signal that coincides with the chromosome 13/21 α-satellite probe for each chromosome 13 sister chromatid, indicating that this chromosome likely has one kinetochore (a,b). Conversely, we find that there are two CENP-C signals that coincide with a single chromosome 5/19 α-satellite probe signal for each sister chromatid, indicating there are likely two kinetochores on this chromosome (c,d). Each experiment was performed three times with similar results. n = 32 and 34 metaphase chromosome spreads were analysed for chromosomes 13 and 19, respectively. Insets are magnified 1.7-fold (panels a and c) or 3.9-fold (panels b and d). Bar, 10 μm.
Extended Data Fig. 8
Extended Data Fig. 8. Centromeres evolve with different evolutionary trajectories and mutation rates.
a-d) Phylogenetic trees of α-satellite monomers derived from the human, chimpanzee, orangutan, and macaque chromosome a) 10, b) 12, c) 20, and d) 21 centromeric regions. e-h) Plot showing the mutation rate of the chromosome e) 10, f) 12, g) 20, and h) 21 centromeric regions. Individual data points from 10-kbp pairwise sequence alignments are shown. We note that the regions corresponding to the active α-satellite HORs have only approximate mutation rates based on human–human comparisons, Due to unequal rates of mutation and the emergence of new α-satellite HORs, interspecies comparisons are not possible in these regions.
Extended Data Fig. 9
Extended Data Fig. 9. Phylogenetic reconstruction of human chromosome 5 and 7 centromeric haplotypes.
a,b) Phylogenetic trees showing the evolutionary relationship and estimated divergence times of completely and accurately assembled a) D5Z2 α-satellite HOR arrays and b) D7Z1 α-satellite HOR arrays from CHM1, CHM13, and diverse human samples (generated by the HPRC and HGSVC). The trees were generated from 20-kbp segments in the monomeric α-satellite or unique sequence regions on the p- (left) and q- (right) arms. Asterisks indicate nodes with 100% bootstrap support, and nodes with 90–99% bootstrap support are indicated numerically. Nodes without an asterisk or number have bootstrap support <90%. The haplotypes from the p- and the q-arm trees are linked with a light teal bar, as schematized in panel a. We note that most differences in the order of the haplotypes occur at the terminal branches where the order of sequence taxa can be readily reshuffled to establish near-complete concordance. Thus, there are no significant changes in the overall topologies of the phylogenetic trees.
Extended Data Fig. 10
Extended Data Fig. 10. Phylogenetic reconstruction of human chromosome 8 and 10 centromeric haplotypes.
a,b) Phylogenetic trees showing the evolutionary relationship and estimated divergence times of completely and accurately assembled a) D8Z2 α-satellite HOR arrays and b) D10Z1 α-satellite HOR arrays from CHM1, CHM13, and diverse human samples (generated by the HPRC and HGSVC). The trees were generated from 20-kbp segments in the monomeric α-satellite or unique sequence regions on the p- (left) and q- (right) arms. Asterisks indicate nodes with 100% bootstrap support, and nodes with 90–99% bootstrap support are indicated numerically. Nodes without an asterisk or number have bootstrap support <90%. The haplotypes from the p- and the q-arm trees are linked with a light teal bar, as schematized in panel a. We note that most differences in the order of the haplotypes occur at the terminal branches where the order of sequence taxa can be readily reshuffled to establish near-complete concordance. Thus, there are no significant changes in the overall topologies of the phylogenetic trees.
Extended Data Fig. 11
Extended Data Fig. 11. Phylogenetic reconstruction of human chromosome 11, 13, and 14 centromeric haplotypes.
a-c) Phylogenetic trees showing the evolutionary relationship and estimated divergence times of completely and accurately assembled a) D11Z1 α-satellite HOR arrays, b) D13Z2 α-satellite HOR arrays, and b) D14Z9 α-satellite HOR arrays from CHM1, CHM13, and diverse human samples (generated by the HPRC and HGSVC). The trees were generated from 20-kbp segments in the monomeric α-satellite or unique sequence regions on the p- (left) and q- (right) arms. Asterisks indicate nodes with 100% bootstrap support, and nodes with 90–99% bootstrap support are indicated numerically. Nodes without an asterisk or number have bootstrap support <90%. The haplotypes from the p- and the q-arm trees are linked with a light teal bar, as schematized in panel a. We note that most differences in the order of the haplotypes occur at the terminal branches where the order of sequence taxa can be readily reshuffled to establish near-complete concordance. Thus, there are no significant changes in the overall topologies of the phylogenetic trees. We note, however, in the case of the chromosome 13 p-arm (panel b), the CHM13 divergence time is exceptional (5.2 mya) compared to all other regions of the genome. The basis for this is unknown, but it may reflect ectopic exchange of the p-arm of human acrocentric chromosomes, leading to non-homologous exchange among five human chromosomes.

Update of

References

    1. Willard, H. F. Chromosome-specific organization of human alpha satellite DNA. Am. J. Hum. Genet.37, 524–532 (1985). - PMC - PubMed
    1. Alexandrov, I., Kazakov, A., Tumeneva, I., Shepelev, V. & Yurov, Y. Alpha-satellite DNA of primates: old and new families. Chromosoma110, 253–266 (2001). 10.1007/s004120100146 - DOI - PubMed
    1. Henikoff, S., Ahmad, K. & Malik, H. S. The centromere paradox: stable inheritance with rapidly evolving DNA. Science293, 1098–1102 (2001). 10.1126/science.1062939 - DOI - PubMed
    1. Nurk, S. et al. The complete sequence of a human genome. Science376, 44–53 (2022). 10.1126/science.abj6987 - DOI - PMC - PubMed
    1. Altemose, N. et al. Complete genomic and epigenetic maps of human centromeres. Science376, eabl4178 (2022). 10.1126/science.abl4178 - DOI - PMC - PubMed

Publication types

MeSH terms