. 2024 Apr;628(8008):639-647.
doi: 10.1038/s41586-024-07259-6. Epub 2024 Apr 3.

Improving prime editing with an endogenous small RNA-binding protein

Affiliations

Improving prime editing with an endogenous small RNA-binding protein

Jun Yan et al. Nature. 2024 Apr.

Abstract

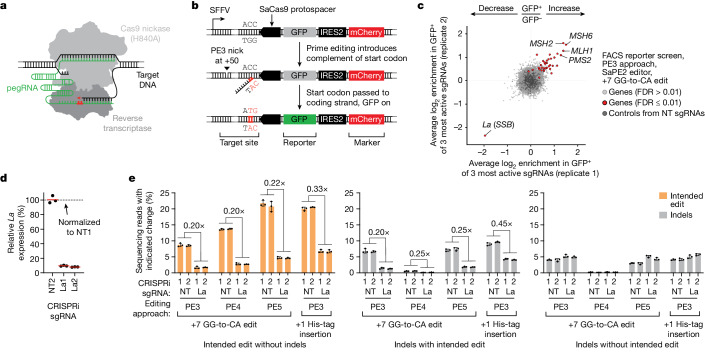
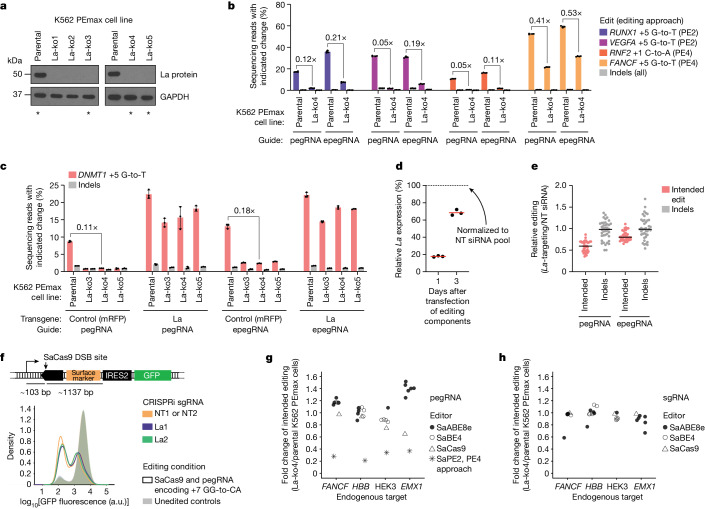
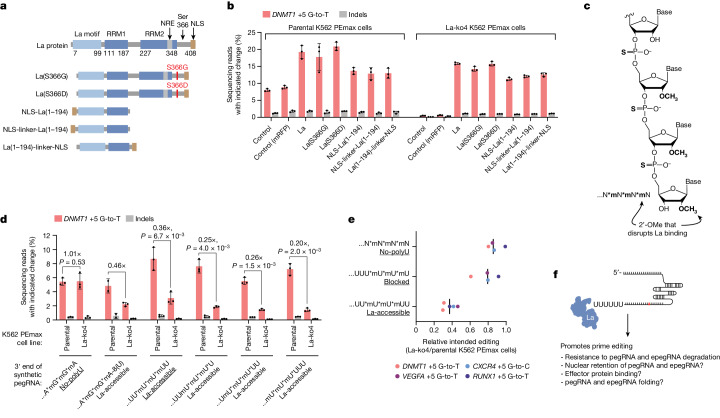
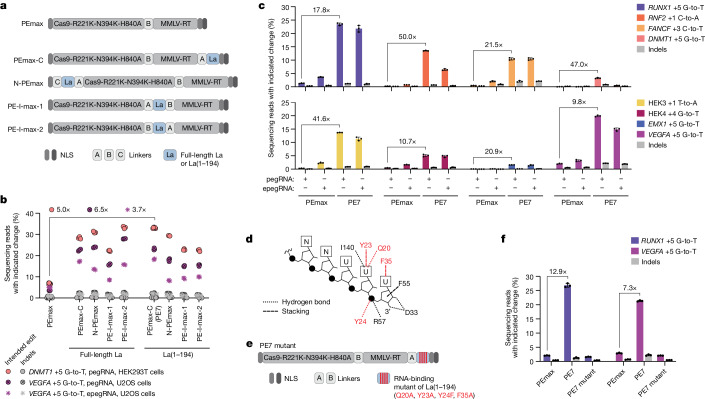
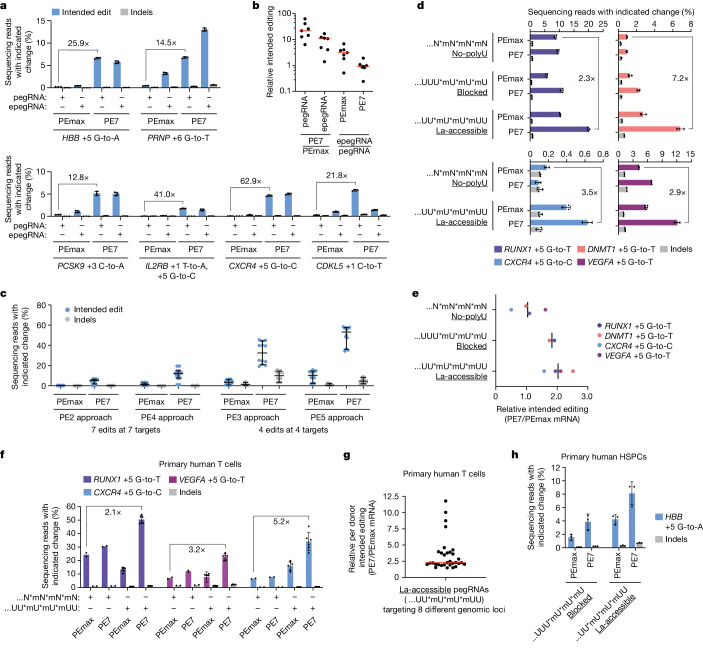
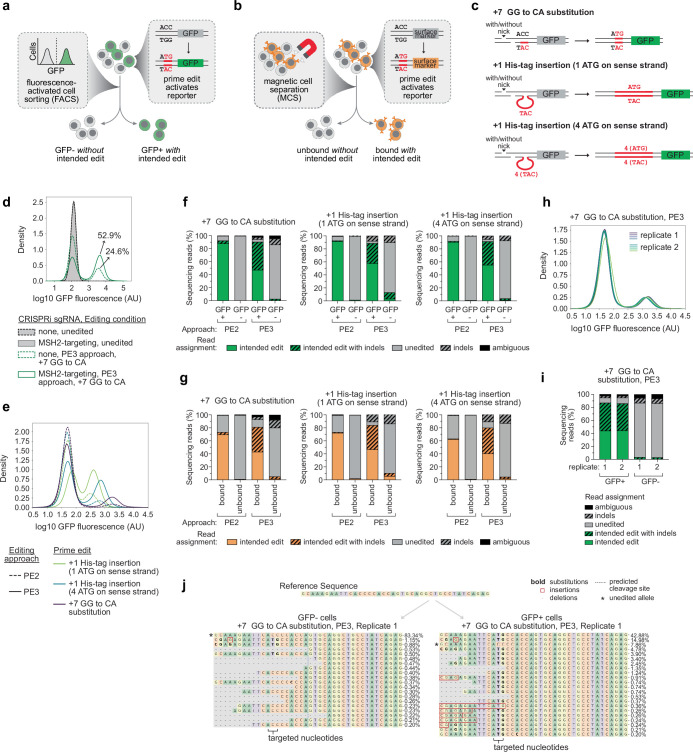
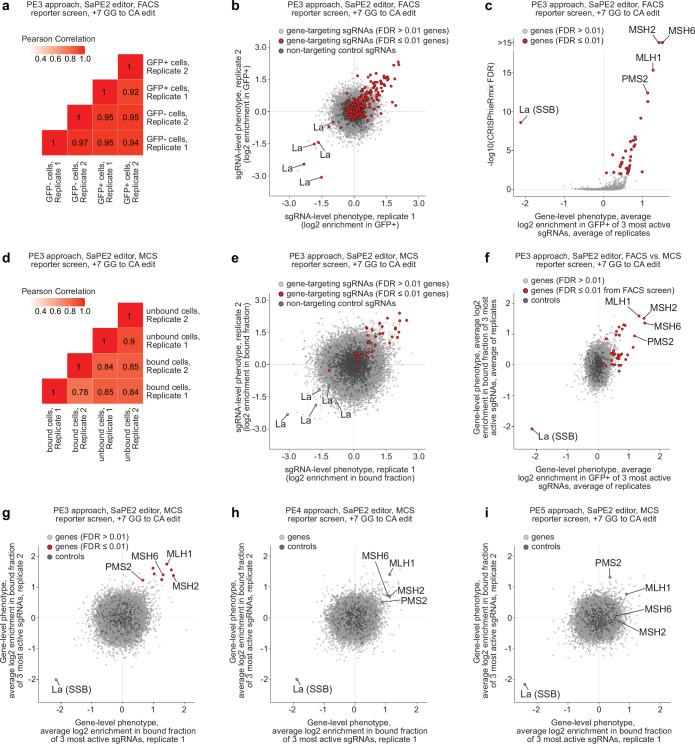
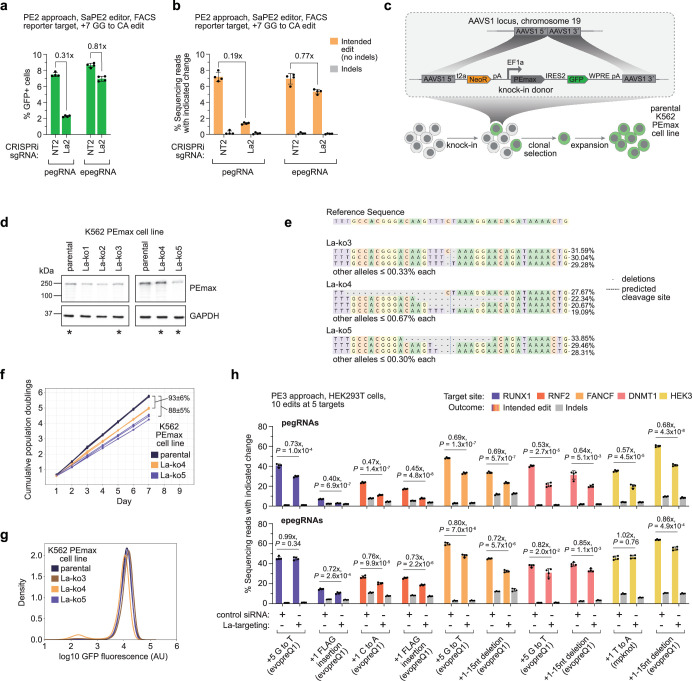
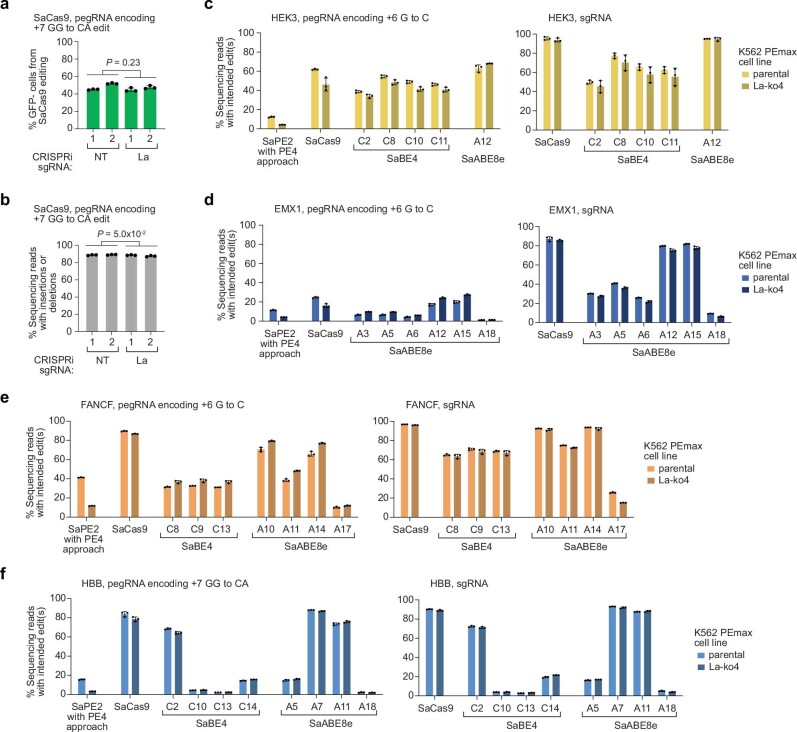
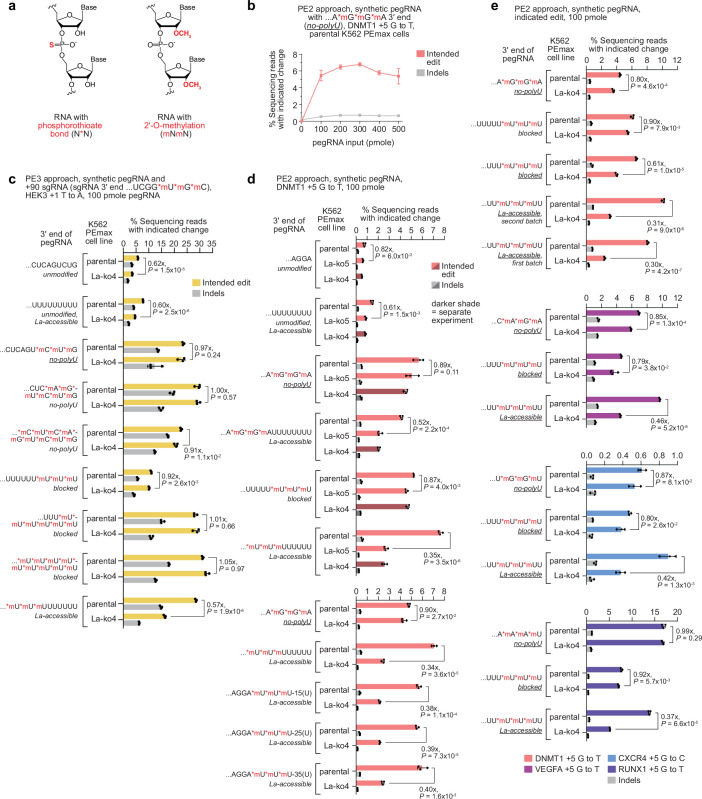
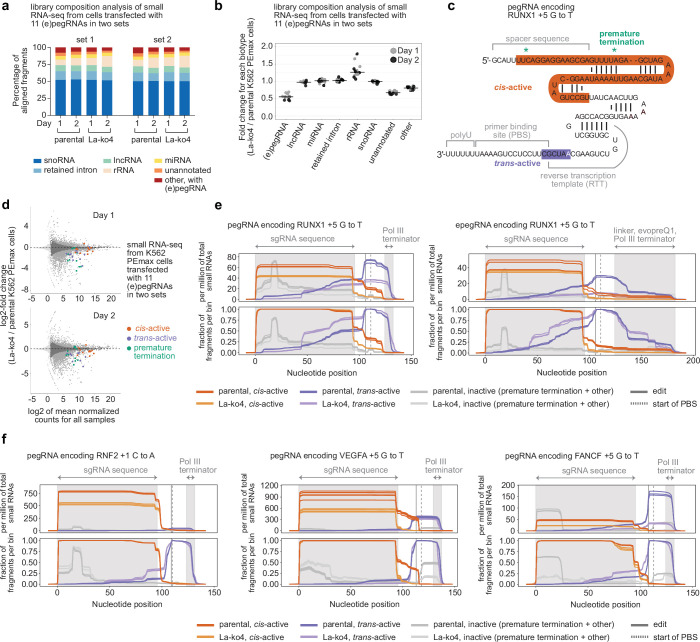
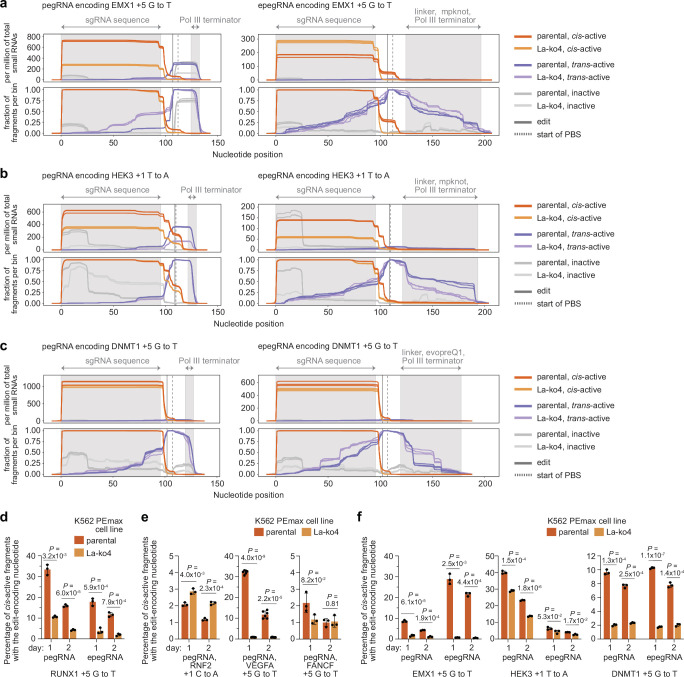
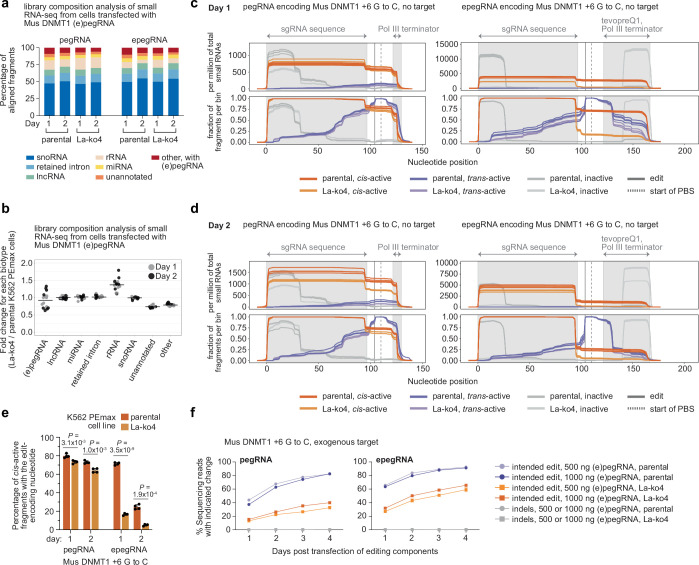
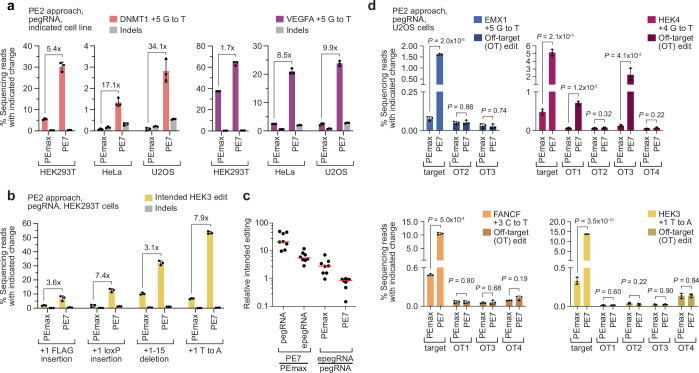
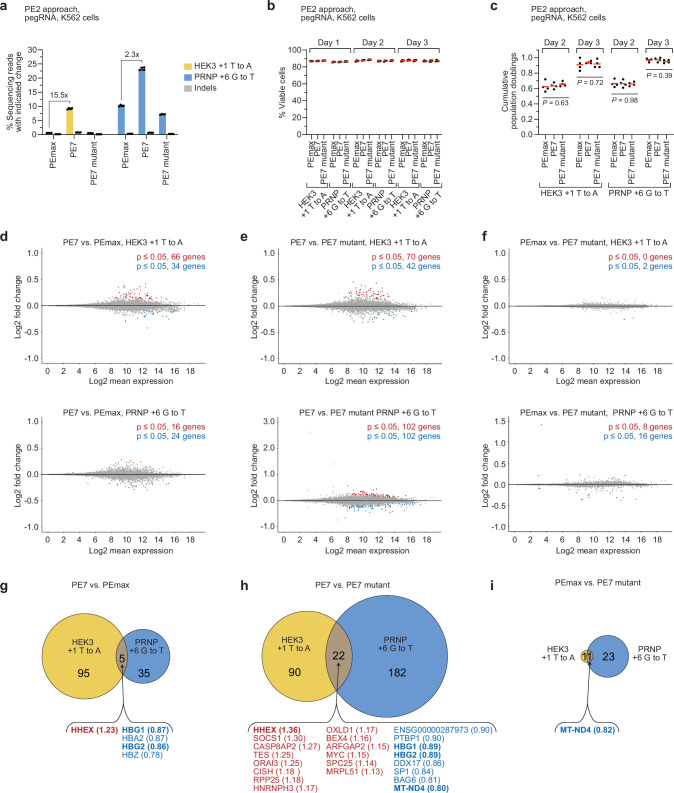
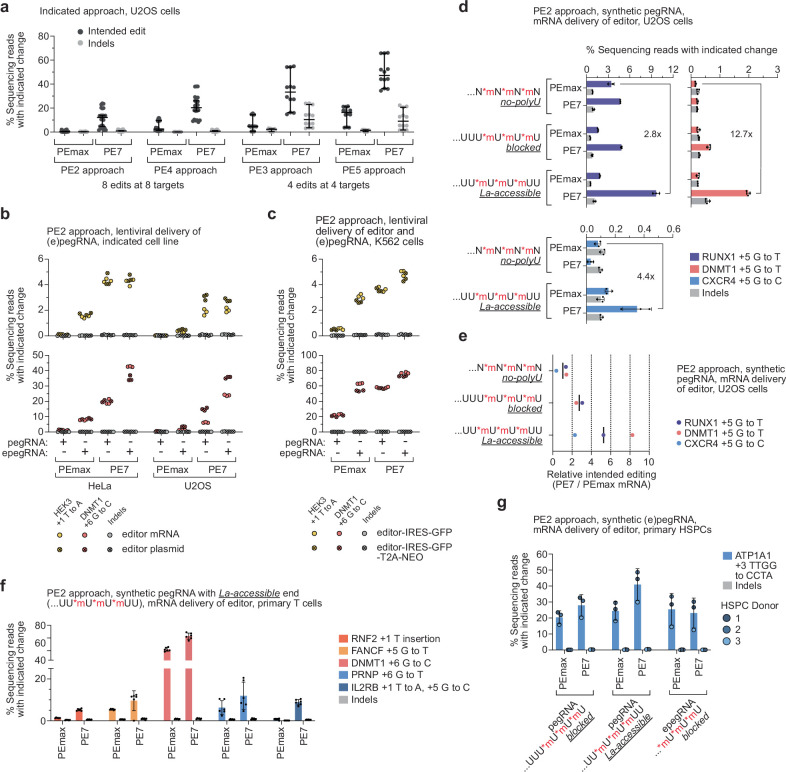
Prime editing enables the precise modification of genomes through reverse transcription of template sequences appended to the 3' ends of CRISPR-Cas guide RNAs1. To identify cellular determinants of prime editing, we developed scalable prime editing reporters and performed genome-scale CRISPR-interference screens. From these screens, a single factor emerged as the strongest mediator of prime editing: the small RNA-binding exonuclease protection factor La. Further investigation revealed that La promotes prime editing across approaches (PE2, PE3, PE4 and PE5), edit types (substitutions, insertions and deletions), endogenous loci and cell types but has no consistent effect on genome-editing approaches that rely on standard, unextended guide RNAs. Previous work has shown that La binds polyuridine tracts at the 3' ends of RNA polymerase III transcripts2. We found that La functionally interacts with the 3' ends of polyuridylated prime editing guide RNAs (pegRNAs). Guided by these results, we developed a prime editor protein (PE7) fused to the RNA-binding, N-terminal domain of La. This editor improved prime editing with expressed pegRNAs and engineered pegRNAs (epegRNAs), as well as with synthetic pegRNAs optimized for La binding. Together, our results provide key insights into how prime editing components interact with the cellular environment and suggest general strategies for stabilizing exogenous small RNAs therein.


Conflict of interest statement

B.A. is an advisory board member with options for Arbor Biotechnologies and Tessera Therapeutics. B.A. holds equity in Celsius Therapeutics. L.A.G has filed patents on CRISPR tools and CRISPR functional genomics and is a co-founder of Chroma Medicine. A.M. is a co-founder of Arsenal Biosciences, Site Tx, Spotlight Therapeutics, and Survey Genomics, serves on the boards of directors at Site Tx, Spotlight Therapeutics and Survey Genomics, is a member of the scientific advisory boards of Arsenal Biosciences, Site Tx, Spotlight Therapeutics, Survey Genomics, NewLimit, Amgen, Tenaya, and Lightcast, owns stock in Arsenal Biosciences, Site Tx, Spotlight Therapeutics, NewLimit, Survey Genomics, PACT Pharma, Tenaya, and Lightcast, and has received fees from Arsenal Biosciences, Spotlight Therapeutics, Site Tx NewLimit, Survey Genomics, Gilead, 23andMe, PACT Pharma, Juno Therapeutics, Tenaya, Lightcast, Trizell, Vertex, Merck, Amgen, Genentech, AlphaSights, Rupert Case Management, Bernstein, GLG, ClearView Healthcare Partners, and ALDA. A.M. is an investor in and informal advisor to Offline Ventures and a client of EPIQ. The Marson Laboratory has received research support from Juno Therapeutics, Epinomics, Sanofi, GlaxoSmithKline, Gilead, and Anthem. C.C.W. and R.S. are co-founders of Site Tx. J.Y. and B.A. have filed a patent application on aspects of this work through Princeton University, and B.A. has previously filed other patents on CRISPR-based technologies. The remaining authors declare no competing interests.

Figures

Fig. 1
Fig. 1. Genome-scale CRISPRi screens identify La as a key determinant of prime editing.
a, Schematic of prime editing. b, Schematic of the FACS reporter of prime editing. c, Gene-level phenotypes from genome-scale CRISPRi screen performed in FACS reporter cells with the SaPE2 editor, +7 GG-to-CA edit and the PE3 approach. Phenotypes represent enrichment of normalized sgRNA counts in GFP+ over GFP populations after prime editing (average for the top three sgRNAs per gene). Hit genes (FDR ≤ 0.01) were identified using CRISPhieRmix. Pseudogene controls generated from randomly selected non-targeting (NT) sgRNAs. d, Quantification of CRISPRi-mediated La depletion. Reverse transcription followed by quantitative PCR (RT–qPCR) of RNA from K562 CRISPRi cells with integrated MCS reporter. Data are normalized to ACTB and are presented relative to a non-targeting sgRNA (NT1). La1 and La2, La-targeting sgRNAs. e, Percentages of prime editing outcomes produced at the integrated MCS reporter using the SaPE2 editor with or without depletion of La in K562 CRISPRi cells. Percentages of intended prime editing without indels (left), indels with the intended prime edit (middle) and indels without the intended edit (right) plotted separately. Editing components delivered by plasmid transfection in c and e. Horizontal bars in d indicate geometric means (n = 3 independent biological replicates). Data and error bars in e indicate mean ± s.d. (n = 3 independent biological replicates). Image of the prime editor protein in a adapted from ref. , Elsevier, under a Creative Commons licence CC BY 4.0. Images of DNA and pegRNA in a adapted from ref. , Elsevier.
Fig. 2
Fig. 2. La promotes prime editing across edit types and genomic loci.
a, Western blot analysis of K562 cells constitutively expressing PEmax (K562 PEmax parental) and clones with genetic disruption of La (La-ko1 through La-ko5). Asterisks indicate cell lines used in this study. See also Extended Data Fig. 3d. b, Percentages of prime editing outcomes at indicated genomic loci. pegRNAs and epegRNAs (evopreQ1) were delivered as plasmids without or with MLH1dn (PE2 or PE4, respectively). c, Percentages of prime editing outcomes with or without ectopic expression of La. Expression plasmids for La or mRFP control were delivered alongside plasmids encoding pegRNA or epegRNA (evopreQ1). The PE2 approach was used. d, Quantification of RNAi-mediated La depletion. RT–qPCR from HEK293T cells. Data normalized to ACTB and presented relative to the non-targeting (NT) siRNA pool. e, Fold changes in prime editing outcomes across ten PE3 edits (substitutions, insertions and deletions) at five genomic loci in HEK293T cells with or without La depletion. Editing percentages are presented in Extended Data Fig. 3h. f, Top, schematic of the MCS reporter, including distances between the predicted SaCas9 cut site and sequences required for GFP expression. Bottom, flow cytometry analysis of MCS reporter cells with and without CRISPRi-mediated La depletion after induction of SaCas9-mediated DSB and unedited controls. Quantification presented in Extended Data Fig. 4a. g,h, Fold changes in editing outcomes induced with pegRNA (g) or sgRNA (h) using SaABE8e, SaBE4, SaCas9 or SaPE2 (PE4 approach, g only) in La-ko4 relative to parental K562 PEmax cells (intended edits only). Editing percentages presented in Extended Data Fig. 4c–f. Editing components were delivered by plasmid transfection in b,c and eh. Data and error bars in b and c indicate the mean ± s.d. (n = 4 and 3 independent biological replicates, respectively). Horizontal bars in d and e indicate geometric means (n = 3 independent biological replicates) and medians of fold changes (10 edits, each with n = 4 independent biological replicates plotted individually), respectively. Data in g and h represent ratios of means for individual editing outcomes (n = 3 independent biological replicates for each outcome).
Fig. 3
Fig. 3. La functionally interacts with the 3′ ends of polyuridylated pegRNAs.
a, Domain architectures of La and mutants. NRE, nuclear retention element Linker, SGGS. b, Percentages of prime editing outcomes with or without ectopic expression of La or mutants depicted in a. Expression plasmids were delivered to indicated cells alongside the plasmid encoding the DNMT1 +5 G-to-T pegRNA. c, Schematic of RNA with chemical modifications (bold); specifically, phosphorothioate bonds (asterisks in sequence representation) and 2′-OMe modifications (‘m’ in sequence representation). d, Percentages of prime editing outcomes produced using 100 pmole of synthetic pegRNAs with indicated 3′ end configurations. e, Fold changes in average intended prime editing at four genomic loci in La-ko4 cells relative to parental K562 PEmax cells produced using 100 pmole of synthetic pegRNA with the indicated 3′ end configurations. Editing percentages provided in Extended Data Fig. 5e. f, Model of La interaction with pegRNAs. The PE2 approach was used in b,d,e. Underlining in d,e indicates particular 3′ end configuration patterns. Data and error bars in b and d indicate the mean ± s.d. (n = 2–3 independent biological replicates). Vertical bars in e indicate medians (4 edits) of ratios of means (n = 3 independent biological replicates for each edit). P values in d are from one-tailed unpaired Student’s t-test. Image of pegRNA in f adapted from ref. , Elsevier.
Fig. 4
Fig. 4. Fusion of the La RNA-binding, N-terminal domain to PEmax improves prime editing.
a, Schematics of prime editor architectures. Medium grey NLS, bipartite NLS (SV40); dark grey NLS, NLS (c-Myc); A, B, C, linkers (Methods); MMLV-RT, human codon-optimized MMLV-RT. b, Percentages of prime editing outcomes produced with editors from a, pegRNAs or an epegRNA (evopreQ1), and the PE2 approach at DNMT1 and VEGFA loci in indicated cells. c, Percentages of prime editing outcomes at eight endogenous loci in U2OS cells using pegRNAs or epegRNAs (HEK3, mpknot; HEK4, tevopreQ1; all other loci, evopreQ1) and the PE2 approach. Data from pegRNAs also plotted in Extended Data Fig. 11a. d, Schematic of interactions between the La N-terminal domain and RNA with 3′-UUUOH . Red font and red lines indicate residues mutated in the PE7 mutant (Q20, Y23, Y24 and F35) and associated interactions. e, Schematic of the PE7 mutant harbouring four mutations (red font and red vertical lines) in La(1–194) to disrupt 3′ polyU binding. f, Percentages of prime editing outcomes produced with PEmax, PE7 or the PE7 mutant at RUNX1 and VEGFA loci in U2OS cells with the PE2 approach and pegRNAs. Editing components were delivered by plasmid transfection in b,c,f. Data in b indicate values of independent biological replicates (n = 9 for PEmax and n = 6 for PE7 with DNMT1 edit; n = 4 for PEmax with VEGFA edit; n = 3 for all others). Data and error bars in c and f indicate the mean ± s.d. (n = 3 independent biological replicates).
Fig. 5
Fig. 5. PE7 enhances prime editing at disease-related targets and in primary human cells.
a, Percentages of prime editing outcomes at six endogenous loci in U2OS cells using pegRNAs and epegRNAs (tevopreQ1). Data from pegRNAs also plotted in c. b, Fold changes in intended prime editing for the six edits in a (editing percentages in a) and one additional edit for which editing percentages were lower (HBG1 and HBG2). c, Prime editing outcome frequencies from indicated approaches (pegRNAs only) in U2OS cells. Data from six endogenous loci in a and HBG1 and HBG2 (PE2 and PE4) or a subset (PE3 and PE5). d, Percentages of prime editing outcomes at four genomic loci in K562 cells using PEmax or PE7 mRNA and synthetic pegRNAs with indicated 3′ end configurations. e, Fold changes in average intended prime editing in K562 cells using PE7 mRNA relative to PEmax mRNA for synthetic pegRNAs with indicated 3′ end configurations. Editing percentages in d. f, Percentages of prime editing outcomes in primary human T cells using PEmax or PE7 mRNA and synthetic pegRNAs with indicated 3′ end configurations. g, Fold changes in intended prime editing in primary human T cells using PE7 mRNA relative to PEmax mRNA with La-accessible pegRNAs at eight genomic loci. h, Same as f but at the HBB locus in primary human HSPCs. The PE2 approach was used in a,b, and d–h. Underlining in d,e,g,h indicates particular 3′ end configuration patterns. Editing components were delivered by plasmid (ac) or RNA (dh) transfection. Data and error bars in a,d,f,h indicate the mean ± s.d. (n = 2–3 independent biological replicates for a and d; n = 6 or 2 donors for f; n = 3 donors for h). Horizontal or vertical bars in b and e indicate medians (7 and 2/4 edits, respectively) of ratios of means (n = 3 independent biological replicates for each edit) and in c indicate medians with 99% confidence interval (7 edits for PE2 and PE4, 4 edits for PE3 and PE5, each with n = 3 independent biological replicates plotted individually). Data and horizontal bar in g indicate ratios of intended editing and median (8 edits, n = 4 donors plotted individually).
Extended Data Fig. 1
Extended Data Fig. 1. Characterization of prime editing reporters before and during genome-scale CRISPRi screens.
a, Schematic of isolating prime edited cells with intended edit using our FACS reporter. This reporter expresses GFP upon installation of select prime edits, thus enabling separation of cells into mostly edited or mostly unedited populations using flow cytometry. The complete FACS reporter is depicted in Fig. 1b. b, Schematic of isolating prime edited cells with intended edit using our MCS reporter. This reporter expresses a synthetic cell surface marker (Igκ-hIgG1-Fc-PDGFRβ) upon installation of select prime edits, thus enabling separation of cells into mostly edited or mostly unedited populations using magnetic Protein G beads. The complete MCS reporter is depicted in Fig. 2f. c, Three prime edits capable of ‘switching on’ our FACS and MCS reporters (depicted with the former). d, Flow cytometry analysis of GFP expression in our FACS reporter cells (K562 CRISPRi cells with stably integrated FACS reporter) with and without prime editing (SaPE2, +7 GG to CA, PE3 with a + 50 complementary strand nick), and with and without transduction of an MSH2-targeting sgRNA. e, Flow cytometry analysis of GFP expression in our FACS reporter cells after prime editing with each of the edits depicted in c. f, Percentages of prime editing outcomes in GFP+ or GFP- cells isolated by FACS after prime editing with each of the edits depicted in c. Outcomes quantified by sequencing the FACS reporter target site. Flow cytometry analysis of edited cell populations prior to sorting presented in e. g, Percentages of prime editing outcomes in MCS reporter cells (K562 CRISPRi cells with stably integrated MCS reporter) bound or unbound to Protein G beads after editing with each of the edits depicted in c. Outcomes quantified by sequencing the MCS reporter target site. h, Flow cytometry analysis of GFP expression in our FACS reporter cells after transduction with genome-scale CRISPRi library (hCRISPRi-v2) and prime editing with the +7 GG to CA substitution edit. i, Percentages of prime editing outcomes observed in GFP+ or GFP- cell population for each replicate of the genome-scale FACS screen. Outcomes quantified by sequencing the FACS reporter target site. j, Sequences and frequencies of alleles observed at the FACS reporter target site in cell populations sorted for replicate 1 of the genome-scale FACS screen. Analysis performed with CRISPResso2. Editing components (SaPE2, indicated pegRNAs, nicking sgRNA for PE3) delivered by plasmid transfection in d-j. Data in d-f represent measurements from n = 1 cell populations. Data in g indicate means (n = 3 independent biological replicates). Data in h from n = 4 repeat measurements of each replicate of the genome-scale FACS screen. Data in i represent individual values from each replicate of the genome-scale FACS screen. Data in j depict representative results of n = 2 screen replicates.
Extended Data Fig. 2
Extended Data Fig. 2. Results of genome-scale CRISPRi screens performed with FACS and MCS reporters.
a, Pearson correlations of read counts per sgRNA between each pair of samples isolated from the genome-scale FACS screen performed with the PE3 approach. b, sgRNA-level phenotypes from each replicate of the genome-scale FACS screen. Phenotypes represent enrichment of normalized sgRNA counts in GFP+ over GFP- populations after prime editing. c, Gene-level phenotypes (average of replicates) and per gene FDRs from the genome-scale FACS screen. FDRs determined by CRISPhieRmix. For MSH2 and MSH6, CRISPhieRmix reports an FDR of 0, which we adjusted for plotting. d, Pearson correlations of read counts per sgRNA between each pair of samples isolated from the genome-scale MCS screen performed with the PE3 approach. e, sgRNA-level phenotypes from each replicate of the genome-scale MCS screen performed with the PE3 approach. Compare to b for screen-to-screen differences in technical variability. f, Gene-level phenotypes (average of replicates) from genome-scale FACS and MCS screens performed with the PE3 approach. g-i, Gene-level phenotypes from each replicate of MCS reporter screens performed with the PE3 (g), PE4 (h) and PE5 (i) approaches. sgRNAs targeting genes identified as hits (FDR ≤ 0.01, CRISPhieRmix) from the associated screen are indicated in red in b and e. Genes identified as hits (FDR ≤ 0.01, CRISPhieRmix) from the associated screen in c and g and from the FACS screen in f are indicated in red.
Extended Data Fig. 3
Extended Data Fig. 3. Validating La phenotypes with various genetic perturbation modalities.
a, b, Percentages of prime editing outcomes produced at integrated FACS reporter with pegRNA (left) or epegRNA (right, tevopreQ1) in K562 CRISPRi cells after transduction of the indicated sgRNA. Intended editing quantified by flow cytometry (a) or sequencing (b). c, Schematic of workflow used to engineer K562 clonal cell lines with PEmax expressed constitutively from the AAVS1 safe-harbor locus (parental K562 PEmax cells). d, Western blot analysis of K562 cells constitutively expressing PEmax (K562 PEmax parental) and clones with genetic disruption of La (La-ko1-La-ko5). Asterisks, cell lines used in this study. Images are from the same blot as presented in Fig. 2a. For additional details on imaging, see Methods and Supplementary Fig. 8. e, Sequences and frequencies of alleles observed at the La locus in the La-knockout clones used in this study (La-ko3 through La-ko5). Analysis performed with CRISPResso2. f, Cumulative population doublings of parental, La-ko4, and La-ko5 K562 PEmax cells. g, Flow cytometry analysis of GFP expressed from the PEmax construct at the AAVS1 locus in K562 PEmax parental, La-ko3, La-ko4, and La-ko5 cells. Data collected from cells prior to transfection for experiment depicted in Fig. 2c. h, Percentages of prime editing (PE3) outcomes across ten edits with pegRNAs (top) or epegRNAs (bottom) at five genomic loci in HEK293T cells with and without depletion of La by siRNA. Fold-changes in outcome frequencies presented in Fig. 2e. Editing components delivered by plasmid transfection in a, b and h. Data and error bars in a, b and h indicate mean ± s.d. (n = 4 independent biological replicates). Data in d, e and g depict results from characterizations of n = 1 cell lines. Percentages in f indicate relative mean ± s.d. (n = 3 independent biological replicates measured across an 8-day time course) of daily fold changes in cell numbers, essentially the relative percentages of cells to expect after one day of growth for La-ko4 and La-ko5 compared with parental K562 PEmax cells. P-values in h are from one-tailed unpaired Student’s t-test.
Extended Data Fig. 4
Extended Data Fig. 4. La has a stronger impact on prime editing than other editing modalities.
a, Percentages of GFP- cells within indicated cell populations arising from SaCas9-induced DSBs at a stably integrated MCS reporter in K562 CRISPRi cells. CRISPRi sgRNAs were delivered by lentiviral transduction. Editing components (SaCas9, +7 GG to CA pegRNA) were delivered by plasmid transfection. Representative flow cytometry data from each condition and unedited controls also presented in Fig. 2f. b, Quantification of SaCas9-induced indels at stably integrated MCS reporter described in a. c-f, Percentages of intended editing achieved in K562 PEmax parental and La-ko4 cells using SaPE2 with the PE4 approach, SaCas9, SaBE4, and SaABE8e across four genomic loci, HEK3 (c), EMX1 (d), FANCF (e) and HBB (f). The same pegRNA or sgRNA expression plasmid was used for all editing systems at each target, with select combinations excluded (SaPE2 with PE4 approach with any sgRNA and SaBE4 at EMX1). Relative editing for each intended outcome presented in Fig. 2g and h. Data and error bars in a-f indicate mean ± s.d. (n = 3 independent biological replicates). P-values in a and b are from two-tailed unpaired Student’s t-test.
Extended Data Fig. 5
Extended Data Fig. 5. Prime editing with synthetic pegRNAs designed to block or allow La binding reveals functional interaction between La and polyuridylated 3′ ends.
a, Chemical structures of ribonucleotides linked by a phosphorothioate bond (left) or with substitution of ribose 2′-OH for 2′-O-methyl groups (2′-OCH3) (right). b, Percentages of prime editing outcomes at the endogenous DNMT1 locus in parental K562 PEmax cells using one synthetic pegRNA with the indicated 3′ end configuration. Input was titrated from 0 to 500 pmole. c, d, Percentages of prime editing outcomes at the endogenous HEK3 (c) and DNMT1 (d) loci in K562 PEmax cells using 100 pmole of synthetic pegRNAs and 50 pmole of synthetic sgRNA (c only) with specified 3′ end sequences and chemical modifications. e, Percentages of prime editing outcomes at endogenous DNMT1, CXCR4, VEGFA, and RUNX1 loci in K562 PEmax parental and La-ko4 cells using 100 pmole of synthetic pegRNAs with indicated 3′ end configurations. Fold-changes in outcome frequencies also presented in Fig. 3e. Data and error bars in b-e indicate mean ± s.d. (n = 3 independent biological replicates). P-values in c-e are from one-tailed unpaired Student’s t-test.
Extended Data Fig. 6
Extended Data Fig. 6. Details of small RNA-seq experiment performed with two sets of (e)pegRNAs.
a, Composition of small RNA-seq libraries from K562 PEmax parental or La-ko4 cells. Data are from samples collected one and two days after transfection of eleven (e)pegRNAs in two sets. b, Fold changes in normalized counts of indicated biotypes in La-ko4 cells relative to parental K562 PEmax cells, from samples collected one and two days after transfection of eleven (e)pegRNAs in two sets. Counts were calculated per replicate for each set of (e)pegRNAs as the sums of properly aligned fragments classified as each biotype and normalized by total RNA counts. c, Schematic of minimum sequence defining each class of (e)pegRNA fragments from small RNA-seq (orange, cis-active; purple, trans-active). Representative sequence used (i.e., RUNX1 + 5 G to T pegRNA). Edit-encoding nucleotide (white base) and cryptic terminators (green asterisks) indicated. d, Plot (MA) of small RNA-seq data displaying mean normalized expression versus log2-fold change in expression of human genes and (e)pegRNA bins from La-ko4 cells relative to parental K562 PEmax cells. Data are from samples collected one (top) and two (bottom) days after transfection of plasmids encoding seven pegRNAs and four epegRNAs. Alignment categories are indicated (gray, human small RNA; orange, cis-active; purple, trans-active; green, premature termination) and genes with adjusted p-values ≤ 0.05 are highlighted in light gray. e, Coverage plots of small RNA-seq fragments for the pegRNA (left) or epegRNA (right) specifying RUNX1 + 5 G to T from specified cell lines collected one day after (e)pegRNA plasmid transfection. Data are normalized by counts of fragments from total human small RNA (top) or those within the corresponding bins: cis-active, trans-active, inactive (bottom). Nucleotide position 0 denotes the 5′ end of the RNA, and positions of the edit-encoding nucleotide (vertical solid line) and the start of PBS (vertical dashed line) are indicated. Shaded areas represent sgRNA sequence and Pol III terminator (pegRNA) or sgRNA sequence, linker, evopreQ1, and Pol III terminator (epegRNA). f, Coverage plots of small RNA-seq fragments for pegRNAs specifying RNF2 + 1 C to A (left), VEGFA + 5 G to T (middle) or FANCF + 5 G to T (right) from specified cell lines collected one day after (e)pegRNA plasmid transfection. Data are normalized by counts of fragments from total human small RNA (top) or those within the corresponding bins: cis-active, trans-active, inactive (bottom). Nucleotide position 0 denotes the 5′ end of the RNA, and positions of the edit-encoding nucleotide (vertical solid line) and the start of PBS (vertical dashed line) are indicated. Shaded areas represent sgRNA sequence and Pol III terminator. Data in a indicate means (n = 3 independent biological replicates). Horizontal bars in b indicate medians (12 data points per biotype, each biotype has n = 3 independent biological replicates for each day and each set of (e)pegRNAs). Data in d were calculated from n = 6 (VEGFA + 5 G to T) and 3 (all others) independent biological replicates and adjusted P-values were calculated by DESeq2 using the two-tailed Wald test with Bonferroni-Holm correction. Coverages in e and f represent n = 6 (VEGFA + 5 G to T) and 3 (all others) independent biological replicates. Image of pegRNA in c adapted from ref. , Springer Nature America.
Extended Data Fig. 7
Extended Data Fig. 7. Additional details of small RNA-seq experiment performed with two sets of (e)pegRNAs.
a-c, Coverage plots of small RNA-seq fragments for pegRNAs (left) or epegRNAs (right) encoding EMX1 + 5 G to T (a), HEK3 + 1 T to A (b) or DNMT1 + 5 G to T (c) from specified cell lines collected one day after (e)pegRNA plasmid transfection. Data are normalized by counts of fragments from total human small RNA (top) or those within the corresponding bins: cis-active, trans-active, inactive (bottom). For representative schematic of bins, see Extended Data Fig. 6c. Nucleotide position 0 denotes the 5′ end of the RNA, and positions of the edit-encoding nucleotide (vertical solid line) and the start of PBS (vertical dashed line) are indicated. Shaded areas represent sgRNA sequence, and Pol III terminator for pegRNAs and linker plus evopreQ1/mpknot and Pol III terminator for epegRNAs. d, Percentages of cis-active fragments with the edit-encoding nucleotide for the pegRNA (left) and the epegRNA (right) specifying RUNX1 + 5 G to T in K562 PEmax parental or La-ko4 cells. Associated coverage plots presented in Extended Data Fig. 6e. e, Same as d but for pegRNAs specifying RNF2 + 1 C to A (left), VEGFA + 5 G to T (middle) or FANCF + 5 G to T (right). Associated coverage plots presented in Extended Data Fig. 6f. f, Same as d but for pegRNAs and epegRNAs specifying EMX1 + 5 G to T (left), HEK3 + 1 T to A (middle) or DNMT1 + 5 G to T (right). Associated coverage plots presented in a-c. Coverages depicted in a-c represent n = 3 independent biological replicates. Data and error bars in d-f indicate mean ± s.d. (n = 6 and 3 independent biological replicates for VEGFA + 5 G to T and all others, respectively). P-values in d-f are from two-tailed unpaired Student’s t-test.
Extended Data Fig. 8
Extended Data Fig. 8. Details of small RNA-seq experiment performed with non-targeting pegRNA and epegRNA, each specifying a + 6 G to C edit in a target site adapted from the Mus musculus DNMT1 gene.
a, Composition of small RNA-seq libraries from K562 PEmax parental or La-ko4 cells. Data from samples collected one and two days after transfection of plasmid encoding a pegRNA or an epegRNA specifying mouse DNMT1 + 6 G to C. b. Fold changes in normalized counts of indicated biotypes in La-ko4 cells relative to parental K562 PEmax cells, from samples collected one and two days after transfection of plasmid encoding a pegRNA or an epegRNA specifying mouse DNMT1 + 6 G to C. Counts were calculated per replicate for the pegRNA and the epegRNA as the sums of properly aligned fragments classified as each biotype and normalized by total RNA counts. c, d, Coverage plots of small RNA-seq fragments for the pegRNA (left) or the epegRNA (right) specifying mouse DNMT1 + 6 G to C edit from specified cell lines, which lack the (e)pegRNA target, collected one (c) and two (d) days after (e)pegRNA plasmid transfection. Data are normalized by counts of fragments from total human small RNA (top) or those within the corresponding bins: cis-active, trans-active, inactive (bottom). Nucleotide position 0 denotes the 5′ end of the RNA, and positions of the edit-encoding nucleotide (vertical solid line) and the start of PBS (vertical dashed line) are indicated. Shaded areas represent sgRNA sequence, and Pol III terminator for the pegRNA and tevopreQ1 plus Pol III terminator for the epegRNA. e, Percentages of cis-active fragments with the edit-encoding nucleotide for the pegRNA (left) and the epegRNA (right) specifying mouse DNMT1 + 6 G to C edit in K562 PEmax parental or La-ko4 cells without the (e)pegRNA target. Associated coverage plots presented in c and d. f, Percentages of prime editing outcomes in K562 PEmax parental and La-ko4 cells transduced with the mouse DNMT1 target and transfected with either the pegRNA or epegRNA plasmid specifying mouse DNMT1 + 6 G to C. Data are from samples collected on indicated days. Data in a indicate means (n = 4 independent biological replicates). Horizontal bars in b indicate medians (16 data points per biotype, each biotype has n = 4 independent biological replicates for the pegRNA and epegRNA on each day). Coverages depicted in c and d represent n = 4 independent biological replicates. Data and error bars in e and f indicate mean ± s.d. (n = 4 and 3 independent biological replicates, respectively). P-values in e are from two-tailed unpaired Student’s t-test.
Extended Data Fig. 9
Extended Data Fig. 9. PE7 enhances prime editing in different cell lines and with different edit types with minimal effect on off-target editing.
a, Percentages of prime editing outcomes at DNMT1 and VEGFA loci in HEK293T, HeLa, and U2OS cells. b, Percentages of prime editing outcomes at HEK3 locus in HEK293T cells. c, Fold changes in intended prime editing. Editing percentages in Fig. 4c. d, Percentages of editing outcomes produced by PEmax or PE7 with the PE2 approach at on- and off-target sites using pegRNAs targeting the EMX1 (top left), HEK4 (top right), FANCF (bottom left), and HEK3 (bottom right) loci in U2OS cells. On-target editing data also presented in Fig. 4c and Extended Data Fig. 11a. Editing components delivered by plasmid transfection in a-d. Data and error bars in a, b and d indicate mean ± s.d. (n = 3 independent biological replicates). Horizontal bars in c indicate medians (8 edits) of ratios of means (n = 3 independent biological replicates for each edit). P-values in d are from two-tailed unpaired Student’s t-test.
Extended Data Fig. 10
Extended Data Fig. 10. PE7 has negligible effects on cell viability, cell growth, and mRNA abundance compared with PEmax and PE7 mutant.
a, Percentages of prime editing outcomes at the endogenous HEK3 and PRNP loci in K562 cells using PEmax, PE7 or PE7 mutant. Editing components delivered by plasmid transfection. Cells from this experiment were also used for analyses in b-i. b, Percentages of viable K562 cells quantified by flow cytometry one, two, and three days after transfection of pegRNA plasmid specifying either HEK3 + 1 T to A or PRNP + 6 G to T and PEmax, PE7, or PE7 mutant encoding plasmid. c, Cumulative population doublings of K562 cells two and three days after transfection of pegRNA plasmid specifying either HEK3 + 1 T to A or PRNP + 6 G to T and PEmax, PE7, or PE7 mutant encoding plasmid. d-f, Plot (MA) of RNA-seq data displaying mean normalized gene expression versus log2-fold change in gene expression from K562 cells edited with PE7 relative to PEmax (d), PE7 relative to PE7 mutant (e), and PEmax relative to PE7 mutant (f). Analyses were performed with cells edited using two different pegRNAs, one specifying HEK3 + 1 T to A (top) and one specifying PRNP + 6 G to T (bottom). Upregulated and downregulated genes with adjusted P-values ≤ 0.05 are highlighted in red and blue, respectively. g-i, Venn diagrams of differentially expressed genes (p ≤ 0.05) in K562 cells edited at two different loci across three comparisons: PE7 relative to PEmax (g), PE7 relative to PE7 mutant (h), and PEmax relative to PE7 mutant (i). Bolded genes represent those significantly changed in more than one of the indicated comparisons. Data and error bars in a indicate mean ± s.d. (n = 4 independent biological replicates). Horizontal bars in b and c indicate means (n = 4 independent biological replicates). P-values in c are from one-way ANOVA. RNA-seq analyses presented in d-i were from n = 4 independent biological replicates. Adjusted P-values used for d-i calculated by DESeq2 using the two-tailed Wald test with Benjamini-Hochberg correction.
Extended Data Fig. 11
Extended Data Fig. 11. PE7 improves prime editing with different approaches and delivery strategies.
a, Prime editing outcome frequencies from indicated approaches (pegRNAs only). Data from eight endogenous loci in Fig. 4c (PE2, PE4) or subset (PE3, PE5). b, Percentages of prime editing outcomes at endogenous HEK3 (top) and DNMT1 (bottom) loci after transduction of pegRNAs or epegRNAs (tevopreQ1) and transfection of PEmax or PE7 editor encoded on mRNA or plasmid in HeLa (left) and U2OS (right) cells. (e)pegRNAs used a modified sgRNA scaffold. c, Percentages of prime editing outcomes at endogenous HEK3 (top) and DNMT1 (bottom) loci after transduction of editing components in K562 cells. Two different editor expression constructs (as indicated) were tested. (e)pegRNAs use a modified sgRNA scaffold. epegRNAs use tevopreQ1. d, Percentages of prime editing outcomes at three genomic loci in U2OS cells using indicated editor mRNA and synthetic pegRNAs with no-polyU, blocked, or La-accessible 3′ end configurations. e, Fold changes in average intended prime editing in U2OS cells using PE7 mRNA relative to PEmax mRNA for synthetic pegRNAs with each indicated 3′ end configuration. Editing percentages in d. f, Percentages of prime editing outcomes at five genomic loci in primary human T cells using PEmax or PE7 mRNA and synthetic pegRNAs with a La-accessible 3′ end configuration. g, Percentages of prime editing outcomes at endogenous ATP1A1 locus in primary human HSPCs using PEmax or PE7 mRNA and synthetic (e)pegRNAs with blocked or La-accessible 3′ end configuration. Editing components delivered as indicted or by plasmid (a) or RNA (d-g) transfection. Data and error bars in d, f and g indicate mean ± s.d. (n = 3 independent biological replicates in d, n = 6 and 3 donors in f and g, respectively). Horizontal bars in a indicate medians with 99% confidence interval (8 edits for PE2/4, 4 edits for PE3/5, each with n = 3 independent biological replicates). Data in b and c indicate individual values of n = 3 independent biological replicates. Vertical bars in e indicate medians (2/3 edits) of ratios of means (n = 3 independent biological replicates for each edit).

References

    1. Chen, P. J. & Liu, D. R. Prime editing for precise and highly versatile genome manipulation. Nat. Rev. Genet.24, 161–177 (2023). - PMC - PubMed
    1. Wolin, S. L. & Cedervall, T. The La protein. Annu. Rev. Biochem.71, 375–403 (2002). - PubMed
    1. Anzalone, A. V., Koblan, L. W. & Liu, D. R. Genome editing with CRISPR–Cas nucleases, base editors, transposases and prime editors. Nat. Biotechnol.38, 824–844 (2020). - PubMed
    1. Anzalone, A. V. et al. Search-and-replace genome editing without double-strand breaks or donor DNA. Nature576, 149–157 (2019). - PMC - PubMed
    1. Chen, P. J. et al. Enhanced prime editing systems by manipulating cellular determinants of editing outcomes. Cell184, 5635–5652.e29 (2021). - PMC - PubMed