. 2024 Apr;628(8006):110-116.
doi: 10.1038/s41586-024-07193-7. Epub 2024 Apr 3.

Heat flows enrich prebiotic building blocks and enhance their reactivity

Affiliations

Heat flows enrich prebiotic building blocks and enhance their reactivity

Thomas Matreux et al. Nature. 2024 Apr.

Abstract

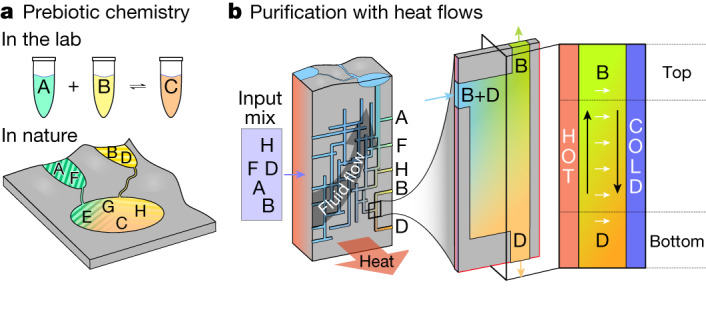
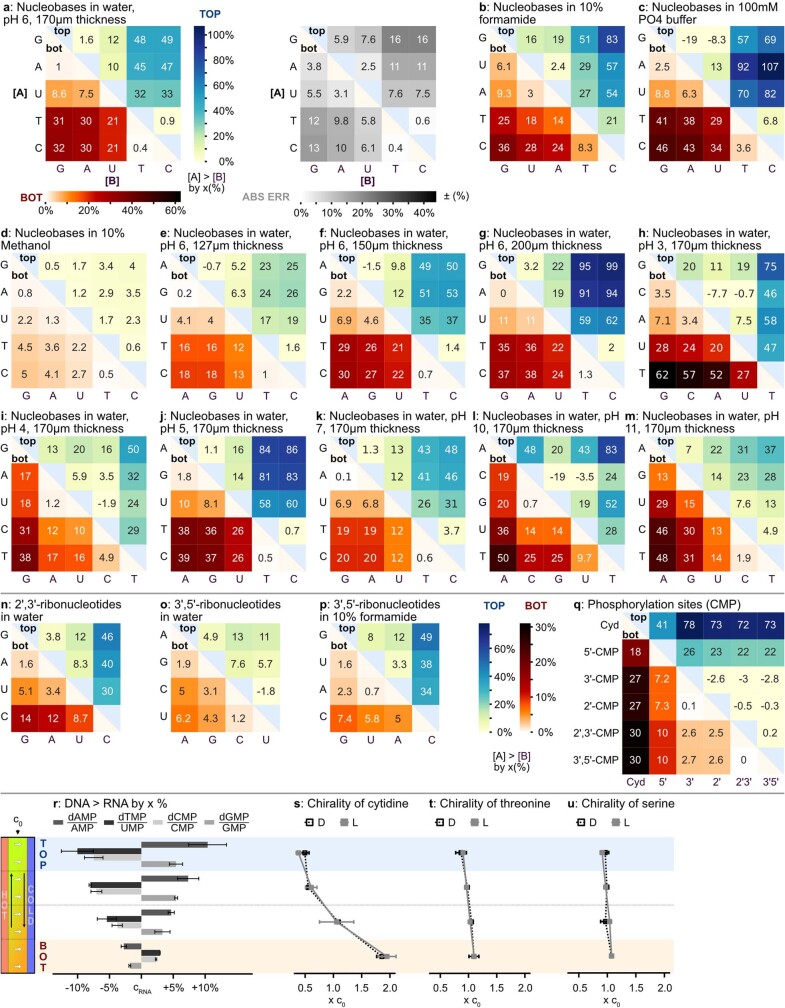
The emergence of biopolymer building blocks is a crucial step during the origins of life1-6. However, all known formation pathways rely on rare pure feedstocks and demand successive purification and mixing steps to suppress unwanted side reactions and enable high product yields. Here we show that heat flows through thin, crack-like geo-compartments could have provided a widely available yet selective mechanism that separates more than 50 prebiotically relevant building blocks from complex mixtures of amino acids, nucleobases, nucleotides, polyphosphates and 2-aminoazoles. Using measured thermophoretic properties7,8, we numerically model and experimentally prove the advantageous effect of geological networks of interconnected cracks9,10 that purify the previously mixed compounds, boosting their concentration ratios by up to three orders of magnitude. The importance for prebiotic chemistry is shown by the dimerization of glycine11,12, in which the selective purification of trimetaphosphate (TMP)13,14 increased reaction yields by five orders of magnitude. The observed effect is robust under various crack sizes, pH values, solvents and temperatures. Our results demonstrate how geologically driven non-equilibria could have explored highly parallelized reaction conditions to foster prebiotic chemistry.


Conflict of interest statement

The authors declare no competing interests.

Figures

Fig. 1
Fig. 1. Purifying the prebiotic clutter.
a, Prebiotic chemistry reactions often require precisely timed mixing of well-defined starting materials with intermediate purification steps for high product yields. In nature, starting solutions are complex mixtures that react to produce many undesirable side products. b, Ubiquitous heat flows through thin rock fractures, fed by geothermal fluid flow (grey arrow), form a geo-microfluidic system that separates even highly similar prebiotic chemicals from each other through substance-sensing thermophoresis (white arrows) and fluid convection (black arrows). Owing to the geological scale, many different solution compositions are reached simultaneously.
Fig. 2
Fig. 2. Thermophoretic enrichment of prebiotic organics in a single heat flow chamber.
a, Illustration of the selective enrichment of prebiotic components for a mixture of 2AI, 2AT and 2AO in a thermal gradient (25–40 °C). Heat maps show the concentration ratios of all possible substance pairs in the bottom (orange shaded) and top (blue shaded) sections of the chamber. For example (dashed boxes), in the top section, 2AO is (142 ± 52)% more concentrated than 2AI, whereas in the bottom section, 2AI is (32 ± 3.6)% enriched over 2AO (errors = s.d., three repeats). b, Enrichment in a mixture of all proteogenic amino acids (30 µM each) reveals a strong enrichment of aliphatic amino acids isoleucine (I), valine (V) and leucine (L) in the bottom section (orange shade) against glycine (G) (up to (81 ± 25)% and serine (S), asparagine (N) and glutamine (Q) (up to (62 ± 17)%). Consistently, the aliphatic amino acids are strongly depleted in the top section (blue shade), resulting in up to (315 ± 138)% higher local glycine concentration. See Extended Data Figs. 2–4 for measurements at other initial pH values, temperature gradients, salt concentrations and error maps. Source Data
Fig. 3
Fig. 3. Enrichment of nucleobases, nucleosides and nucleotides.
a, In mixtures of nucleobases A, U, T, C and G with an initial concentration of 30 µM, C and T are enriched up to (32 ± 13)% (error = s.d., three repeats) against G, A and U in the bottom section. Enrichments in the top section are inverted but at lower absolute concentrations because of thermophoretic depletion (11.5 to 31 µM, corresponding to 0.5–0.9-fold c0). b, Enrichment strongly depends on the phosphorylation state. In the bottom section, cyclic 2′,3′-AMP and 3′,5′-AMP are enriched up to (62 ± 0.3)% relative to adenosine and (14 ± 0.6)% relative to the linearly phosphorylated 5′-AMP, 3′-AMP or 2′-AMP. The enrichment is inverted in the top section. ce, Enrichment patterns similar to those of nucleobases, but with reduced strength, are also found for nucleosides (c) and nucleotides (d,e). Extended Data Fig. 5 and Supplementary Figs. 1–3 show more conditions and error tables. Source Data
Fig. 4
Fig. 4. Experimental and modelled purification of prebiotic organics in a network of connected rock cracks.
a, Experimental setup of a small network of three interconnected chambers with a volume inflow of 1 nl s−1 of an amino acid mixture and ΔT = 16 K. b, After 60 h, the chamber contents from three repeats were frozen and divided into individual parts according to the colour gradations in a and measured by HPLC. Exemplary separations of amino acids I versus N and I versus F are shown. Concentration ratios in chamber 2 (brown shade) versus 3 (blue shade) range from [I]/[N] = 23-fold (brown) to [N]/[I] = 4.2-fold (blue). For thermophoretically similar amino acids F and I, these range from [I]/[F] = 2.8-fold (brown) to [F]/[I] = 1.4-fold (blue). The dashed black line indicates equal concentration. c, Data from b in red compared with an otherwise identical run at ΔT = 10 K (blue) and 0 K (control, green) show stronger enrichment at higher temperatures and no effect without heat flux. d, Larger systems (Nx × Ny = 20 × 20, ΔT = 6 K) of connected heat flow chambers with a volume inflow of 1 nl s−1 per input channel are modelled numerically. e, Concentration ratios between amino acids I and N in the chamber system show a similar but amplified pattern as in b. f, Maximum enrichments [N]/[I]¯ (purple) and [I]/[N]¯ (green) scale with the temperature difference and the size of the system. The dashed lines show the conditions in e and g. Error bars represent the s.d. from several simulations (Methods). gi, Maximum enrichments in the system shown in d for all possible combinations of substances for a mixture of amino acids (g), adenine (nucleobase/nucleoside/nucleotides) (h) and 2-aminoazoles (i). Highlighted boxes indicate maximum enrichments for the pair I and N shown in e. See Extended Data Fig. 6 for error values. Source Data
Fig. 5
Fig. 5. Experimental and modelled enhancement of reaction yields by heat-flow-driven, selective purification of reactants.
a, TMP-associated dimerization of glycine. b, Even in a single heat flux chamber (ΔT = 14 K), the product yield of Gly dimerization increases to up to (3.6 ± 0.6)% after 16 h from undetectable yields in the controls (ΔT = 0 K) for [Gly]init = 1 mM and 10 mM and [TMP]init = 1 mM (errors = s.d., three repeats). c, The reaction rates from equations (9)–(13) were determined experimentally by simultaneously fitting to the product concentrations for bulk glycine dimerization after 16 h with 10 mM and 100 mM initial Gly concentrations over three orders of magnitude of TMP concentrations (left) and to a time series up to 120 h for [Gly]init and [TMP]init = 100 mM (right). d, Gly dimerization was modelled numerically in networks of connected cracks by using reaction rates obtained in c. The 2D maps show product concentrations of GlyGly from TMP-induced dimerization after 120 h without (ΔT = 0 K) and with (ΔT = 10 K) applied heat flux with an inflow rate of 1 nl s−1 per input channel. Each pixel corresponds to the bottom concentration of GlyGly in a separate crack (reaction volume, orange). e, Statistics of all reactant concentrations in 100 distinct systems of Nx = 20 by Ny = 20 connected cracks. Without heat flow (ΔT = 0 K, solid line), TMP (black) and Gly (blue) concentrations remain unchanged at 1 µM, leading to vanishingly low product concentration (GlyGly, purple). With heat flow (ΔT = 10 K), reactant concentrations are increased more than four orders of magnitude, so that—in 0.1% of all chambers—at least 10 µM of product can be formed. Shaded area denotes the s.d. by several runs (Methods). f, The reaction yields of TMP-driven glycine dimerization increase exponentially with the applied temperature gradient. Source Data
Extended Data Fig. 1
Extended Data Fig. 1. Experiment setup and analysis.
a, Preparation of heat flux cells. The microfluidic structure defined by the FEP foil (5) is sandwiched between two sapphires with thicknesses of 500 µm (4; cooled sapphire, with inlets/outlets of 1 mm diameter) and 2,000 µm (6; heated sapphire). The sapphire–FEP–sapphire block is then placed on an aluminium base (2) covered by a heat-conducting foil on the back (1) and front (3) for optimal heat conduction to the cryostat and the sapphire, and held in place by a steel frame (7). The steel frame is connected to the aluminium base by six torque-controlled screws for a homogeneous force distribution. The height of the chamber is measured with a confocal micrometer at three positions (bottom, middle and top) to ensure a homogeneous thickness. Together with another heat-conducting foil (8), an Ohmic heating element (9) is placed on top of the heated sapphire mounted to the steel frame with torque-controlled screws. Chambers are pre-flushed using low-viscosity, fluorinated oil to check for tightness and push out residual gas inclusions. The sample is then pulled into the oil-filled chamber. After loading the sample, the tubings are closed. b, Application of the temperature gradient. The assembled chamber is mounted onto a cooled aluminium block connected to a cryostat. The heaters are connected to a power supply that is controlled by Arduino boards. To stop the experiment, heaters and the cryostat are turned off and the chamber is stored at −80 °C for at least 15 min. c, Differential recovery of four fractions. The freezing allows us to cut the frozen interior of the heat flow cell into four fractions. Fewer fractions would lower resolution by averaging over a larger fraction of the chamber, whereas more fractions would make subsequent analysis difficult because of volume limitations and being more prone to error (Extended Data Fig. 2).
Extended Data Fig. 2
Extended Data Fig. 2. Enrichment of 2-aminoazoles and amino acids for different temperature gradients (errors = s.d., three repeats, same for all; see raw data tables in Supplementary Tables 5–65).
a, Accumulation plots for 2-aminoazoles under 5 K, 10 K and 18 K gradients. For 18 K, accumulation at the bottom is strongest (up to 2.5-fold c0). The strong accumulation for high thermal gradients goes together with an increased separation between species, both at the bottom, for which 2AI is most abundant, and at the top, for which the situation is reversed with up to 142% excess of 2AO versus 2AI. Corresponding errors are shown in the right column. The error maps each show the absolute enrichment error, for example, 2AI versus 2AO (32±3.6)%, so the error range varies between (32−3.6)% = 28.4% and (32+3.6)% = 35.6%. b, Extraction of cysteine and isoleucine + leucine in four (25%) and 12 (8%) fractions. The 8% bottom fraction shows, as expected from theory, a higher value but has a higher error. Also, spatial errors (y axis) increase on more detailed extraction. c, Calculated steady state for 2-aminoazoles for dT = 18 K in a closed heat flow chamber. The experimentally average zones (top 25% and bottom 25%) are marked in grey. In the bottom fraction, the average goes over zones of different concentration ratio, including both excess and underrepresentation of species and, thus, lowering the effectively measured enrichment. This indicates that enrichments in a realistic setting can go up further. d, Assuming a fixed concentration at the top, we find that concentrations vary more than one order of magnitude. e, We use this as a measure of maximal pairwise separation between species for several temperature gradients and species (Supplementary Fig. 6), finding that, even at 5 K, separation values >20% are possible. f, In a mixture of non-proteogenic and proteogenic amino acids and small organics molecules (diluted to 50 µM and containing 0.02-fold lithium citrate, 0.01% phenol and 0.2% thiodiglycol), no clear pattern of separation is observed with non-proteogenic amino acids on both the strongly and the weakly accumulating sides. Error maps defined as in a. g, The same is the case for extraction in 8% fractions, with higher absolute values but also increased errors owing to the now higher impact of volume variations when manually cutting the frozen chamber content. Error maps defined as in a. Source Data
Extended Data Fig. 3
Extended Data Fig. 3. Enrichment between proteinogenic amino acids (30 µM each) with different initial pH values (errors = s.d., three repeats, same for all).
Analysis reveals a strong enrichment of amino acids isoleucine, leucine and phenylalanine at the bottom of the chamber for all pH values against glycine (65–113%) and serine, asparagine and glutamine (35–85%). In the top fraction, the situation is inverted, with up to 300+%. The order and enrichments change with pH as thermophoresis is influenced by, for example, charged state. On the right side, the errors per value of the heat maps are shown as defined in Extended Data Fig. 2a. Source Data
Extended Data Fig. 4
Extended Data Fig. 4. Enrichment between proteinogenic amino acids (30 µM each) with different concentrations of NaCl (errors = s.d., three repeats, same for all).
For all salt concentrations, analysis reveals a strong enrichment of amino acids isoleucine and leucine at the bottom of the chamber against asparagine, serine and glutamine (13–29%). In the top fraction, the situation is inverted, with up to 40+%. On the right side, the errors per value of the heat maps are shown as defined in Extended Data Fig. 2a. Source Data
Extended Data Fig. 5
Extended Data Fig. 5. Enrichment of nucleobases and nucleotides for various settings (errors = s.d., three repeats, same for all).
a, Plot from Fig. 3 as reference, with its corresponding error map as defined in Extended Data Fig. 2a. bd, Enrichments in different solvents. Although 10% formamide and phosphate buffer do not alter accumulation and separation, for methanol, the amplitude decreases massively. eg, Enrichment for different fracture thicknesses. After 18 h, accumulation is stronger for thicker cells, even though this also goes together with varied times needed to reach a steady state. hm, Enrichments for different initial pH values. The general behaviour and order of magnitude stay the same as shown in Fig. 3c. However, the most dominant species changes over pH. Error maps for bm are shown in Supplementary Fig. 3. np, Enrichment of 2′,3′-cyclic and 3′,5′-cyclic nucleotides in water and for the latter in 10% formamide in water. For 2′,3′-cyclic nucleotides, C is enriched up to 14% over the other nucleotides. For 3’,5′-cyclic nucleotides, we find that C (bottom) and G (top) are dominant in individual fractions in formamide, whereas in water, overall enrichment is weaker and dominated by A and U. q, Enrichment between cytidine and cytidine monophosphates (CMP, 30 µM each). Nucleotides (5′, 3′, 2′, 2′,3′, 3′,5′) are enriched against the nucleoside by at least 18%. Cyclic CMPs are enriched against linear CMPs by up to 10%. Even though having the same mass, 2′-CMP is enriched against 5′-CMP and 3′-CMP by 2.5%. Errors for nq are shown in Supplementary Fig. 3. r, Direct comparison of DNA versus 5′-RNA nucleotides. For pyrimidine nucleotides, we observe a stronger accumulation at the bottom for DNA nucleotides (dCMP versus 5′-CMP and dTMP versus 5′-UMP). For purine nucleotides, the inverse situation is true with up to 10% DNA nucleotide excess at the top (dAMP versus 5′-AMP). su, Accumulation profiles of D-cytidine and L-cytidine, D-threonine and L-threonine and D-serine and L-serine. We do not find any substantial enrichment between the two chiralities. Source Data
Extended Data Fig. 6
Extended Data Fig. 6. Experimental and modelled separation of molecules in a network of connected rock cracks.
Top, experimental setup of a small network of three interconnected chambers with a volume inflow of 1 nl s−1 of the same amino acid mixture used in Fig. 2 and ΔT = 16 K. After 60 h, the chamber contents from three repeats were frozen and divided into individual parts according to the colour gradations and measured by HPLC. As well as the main-text examples (I versus N and I versus F), selected pairs are shown. For instance, thermophoretically different amino acids glycine (G) and isoleucine (I) separate readily, whereas mass-identical L and I only show minor concentration differences in our experimental system. Further examples and a detailed overview over spatial resolution are shown in Supplementary Figs. 4 and 5. Bottom, maximum enrichments in the system as shown in Fig. 4d for mixtures of amino acids, adenine (nucleosides/nucleotides), and 2-aminoazoles. Error maps as defined in Extended Data Fig. 2a. Source Data
Extended Data Fig. 7
Extended Data Fig. 7. Pairwise enrichment of amino acids from extracts of Fig. 4g, analogous to Fig. 4e.
Each scatter plot shows the correlation of concentrations in the lower part of each heat flow chamber of 30 simulated networks of 20 × 20 chambers, normalized to the inflow concentration (= 1). Amino acids with similar thermophoresis (for example, G versus S) are similarly concentrated (or depleted) and, thus, hardly enriched against each other. Amino acids with strongly different thermophoresis (see Extended Data Table 1), such as I versus S, are concentrated or depleted very differently. The thermophoretically stronger species I is, thereby, more strongly depleting in the upper regions of the network than the thermophoretically weaker S, so that S occurs here, for example, with more than 1,000 times the concentration of I. The absolute concentration of S is still 0.1 times the initial concentration (purple). Even with an enrichment of 73 times S compared with I (orange), the absolute concentration of S is still at a usable 7.8 times the initial concentration. Source Data
Extended Data Fig. 8
Extended Data Fig. 8. Concentration profiles in heat flux cell and fit for Soret coefficients.
For aminoazoles (A1–A3), nucleobases (A4–B4) and amino acids (C1–G4), the measured concentration/initial concentration is depicted for all four fractions (errors = s.d., three repeats, same for all). Further data are shown in Supplementary Fig. 7. For fitted Soret coefficients, see Extended Data Table 1. A1: 2AO; A2: 2AI; A3: 2AT; A4: adenine; B1: cytosine; B2: guanine; B3: thymine; B4: uracil; C1: alanine; C2: cysteine; C3: aspartic acid; C4: glutamic acid; D1: phenylalanine; D2: glycine; D3: histidine; D4: isoleucine; E1: lysine; E2: leucine; E3: methionine; E4: asparagine; F1: proline; F2: glutamine; F3: arginine; F4: serine; G1: threonine; G2: valine; G3: tryptophan; G4: tyrosine. Source Data
Extended Data Fig. 9
Extended Data Fig. 9. Numerical calculation of an exemplary accumulation of substances with low thermophoretic strength (for example, glycine) versus those with high thermophoretic strength (for example, isoleucine).
The 2D plots show, respectively, glycine (blue) and isoleucine (purple) bottom concentration for the same system of Nx = 40 by Ny = 20 randomly connected heat flow chambers (in a single system). Each pixel corresponds to one chamber. Isoleucine is more concentrated because of its high Soret coefficient, so there are many chambers with more than tenfold concentration. Owing to the resulting more efficient transport to the lower part of the system, it is only present in low concentrations further downstream in the upper part of the system (red box, 0.0004-fold initial concentration). Glycine is less concentrated owing to the lower Soret coefficient and, thus, less transported to the lower part of the system. Downstream, it is therefore still found at higher concentrations in the upper part of the system (red box, 0.5-fold initial concentration). In summary, substances with high thermophoretic strength are purified in the front part (x < 20, upstream) of the system and substances with low thermophoretic strength in the back part (x ≥ 20, downstream). Source Data

References

    1. Muchowska KB, Varma SJ, Moran J. Synthesis and breakdown of universal metabolic precursors promoted by iron. Nature. 2019;569:104–107. - PMC - PubMed
    1. Trapp O, Teichert J, Kruse F. Direct prebiotic pathway to DNA nucleosides. Angew. Chem. Int. Ed. Engl. 2019;58:9944–9947. - PubMed
    1. Becker S, et al. Unified prebiotically plausible synthesis of pyrimidine and purine RNA ribonucleotides. Science. 2019;366:76–82. - PubMed
    1. Preiner M, et al. A hydrogen-dependent geochemical analogue of primordial carbon and energy metabolism. Nat. Ecol. Evol. 2020;4:534–542. - PubMed
    1. Jash B, Tremmel P, Jovanovic D, Richert C. Single nucleotide translation without ribosomes. Nat. Chem. 2021;13:751–757. - PubMed