. 2024 Apr 3;24(1):125.
doi: 10.1186/s12935-024-03258-9.

Deciphering the prognostic features of bladder cancer through gemcitabine resistance and immune-related gene analysis and identifying potential small molecular drug PIK-75

Affiliations

Deciphering the prognostic features of bladder cancer through gemcitabine resistance and immune-related gene analysis and identifying potential small molecular drug PIK-75

Tingting Cai et al. Cancer Cell Int. .

Abstract

Background: Bladder cancer (BCa) stands out as a prevalent and highly lethal malignancy worldwide. Chemoresistance significantly contributes to cancer recurrence and progression. Traditional Tumor Node Metastasis (TNM) stage and molecular subtypes often fail to promptly identify treatment preferences based on sensitivity.

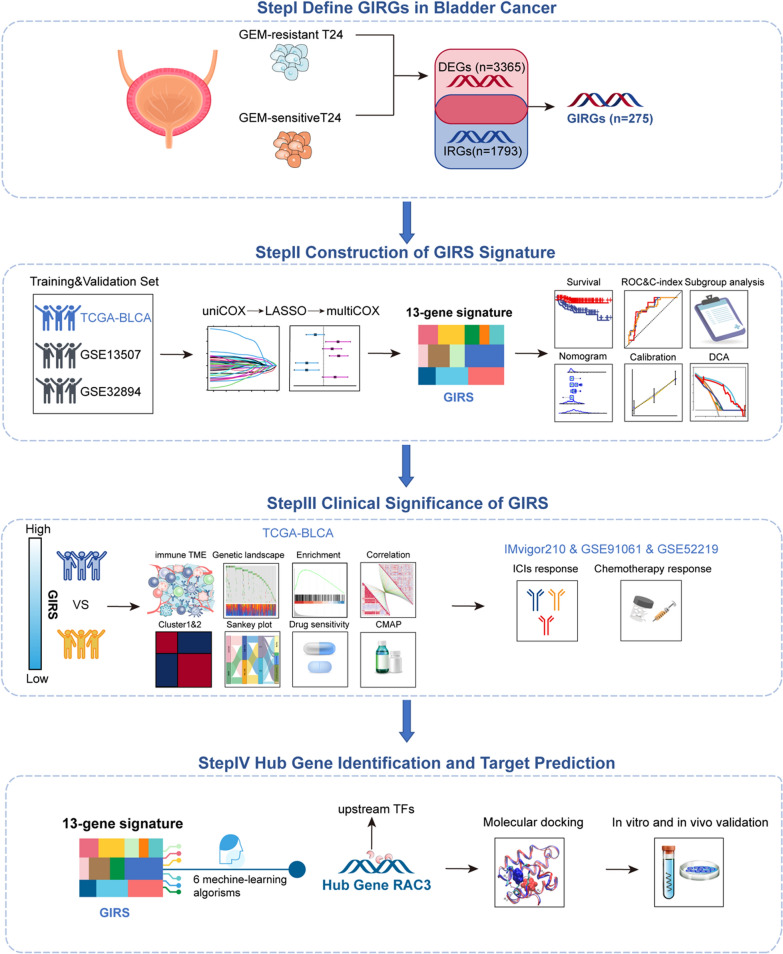
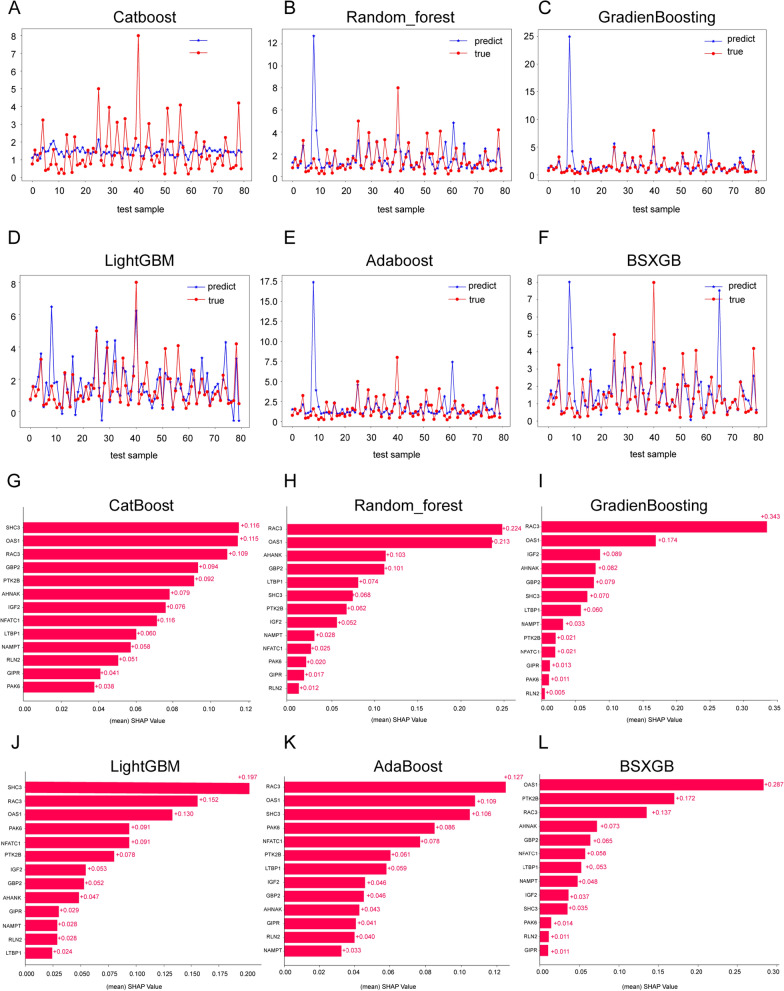
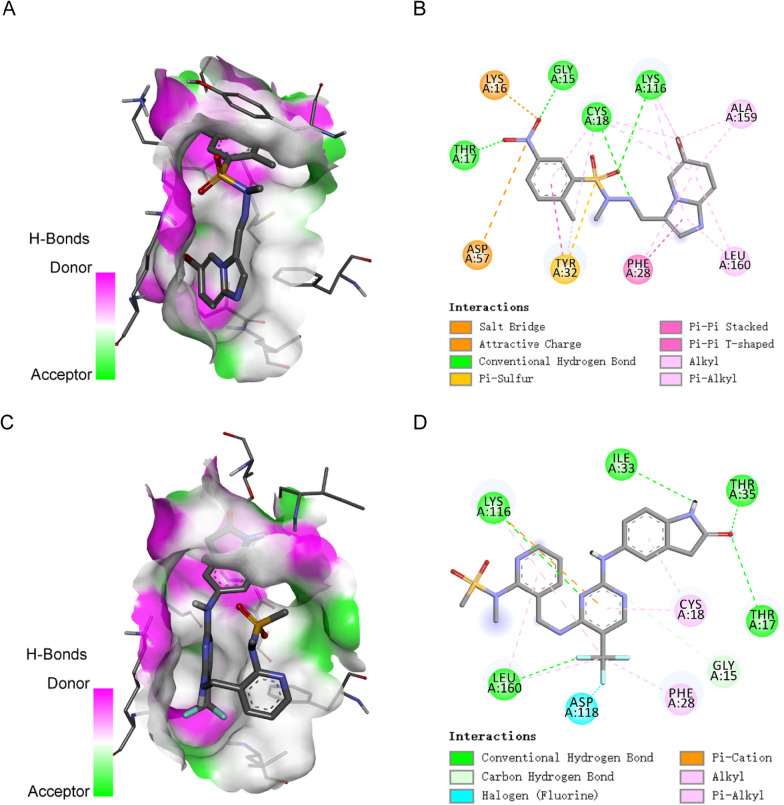
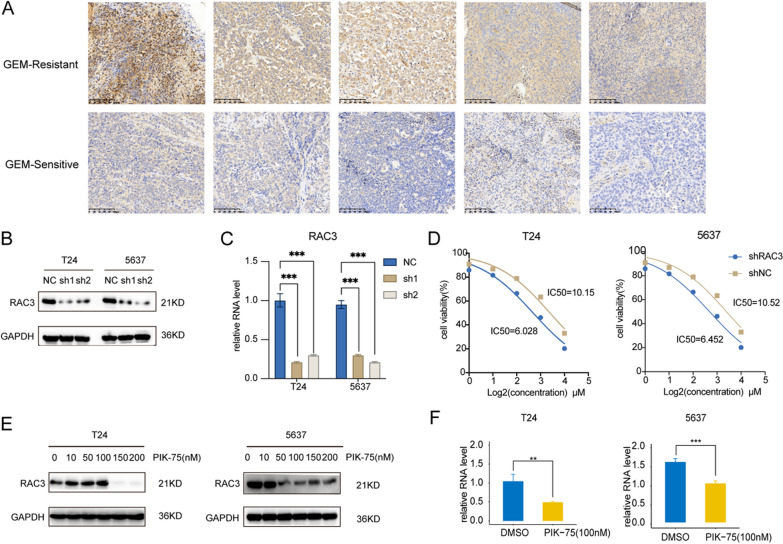
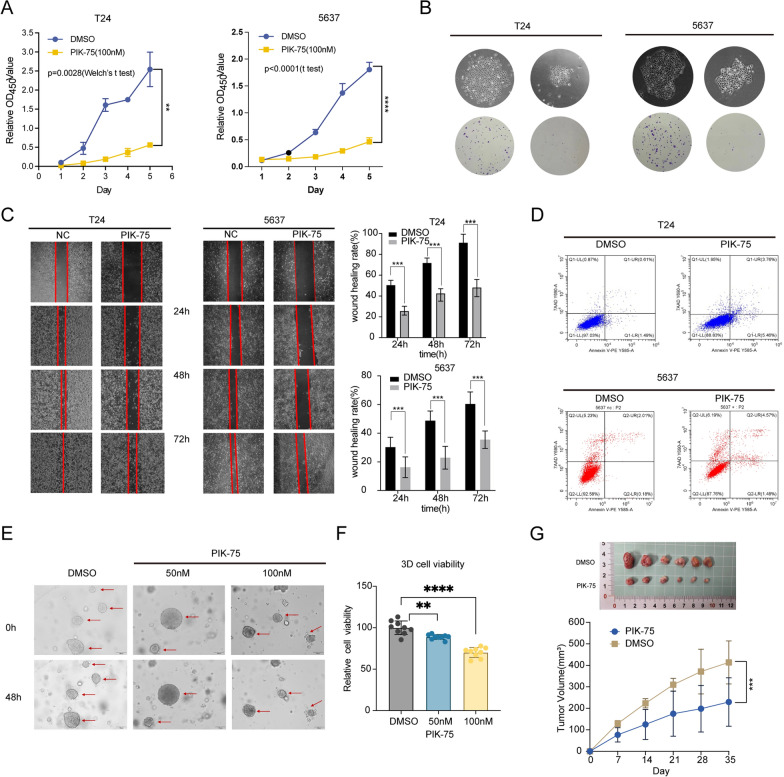
Methods: In this study, we developed a prognostic signature for BCa with uni-Cox + LASSO + multi-Cox survival analysis in multiple independent cohorts. Six machine learning algorithms were adopted to screen out the hub gene, RAC3. IHC staining was used to validate the expression of RAC3 in BCa tumor tissue. RT-qPCR and Western blot were performed to detect and quantify the mRNA and protein levels of RAC3. CCK8, colony formation, wound healing, and flow cytometry analysis of apoptosis were employed to determine cell proliferation, migration, and apoptosis. Molecular docking was used to find small target drugs, PIK-75. 3D cell viability assay was applied to evaluate the ATP viability of bladder cancer organoids before and after PIK-75 treated.

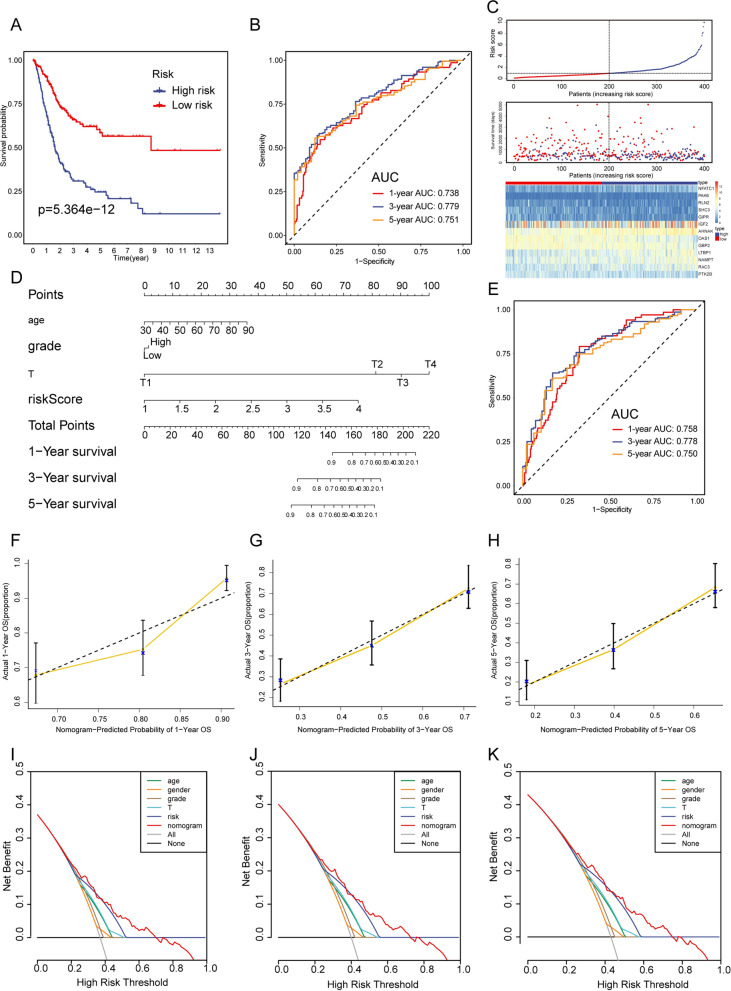
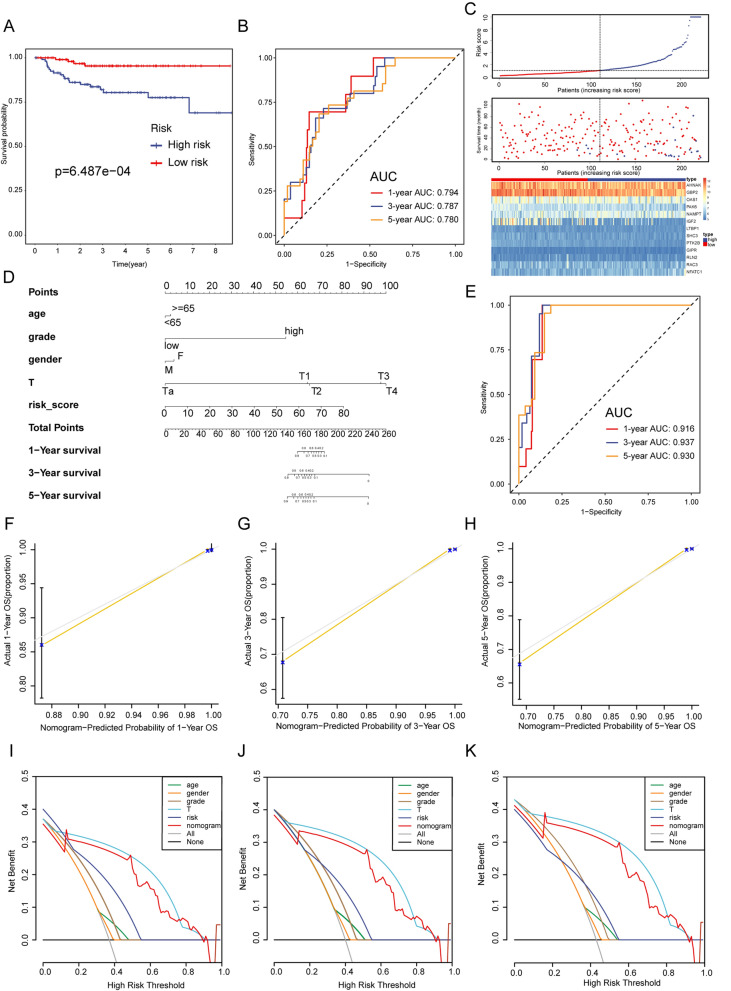
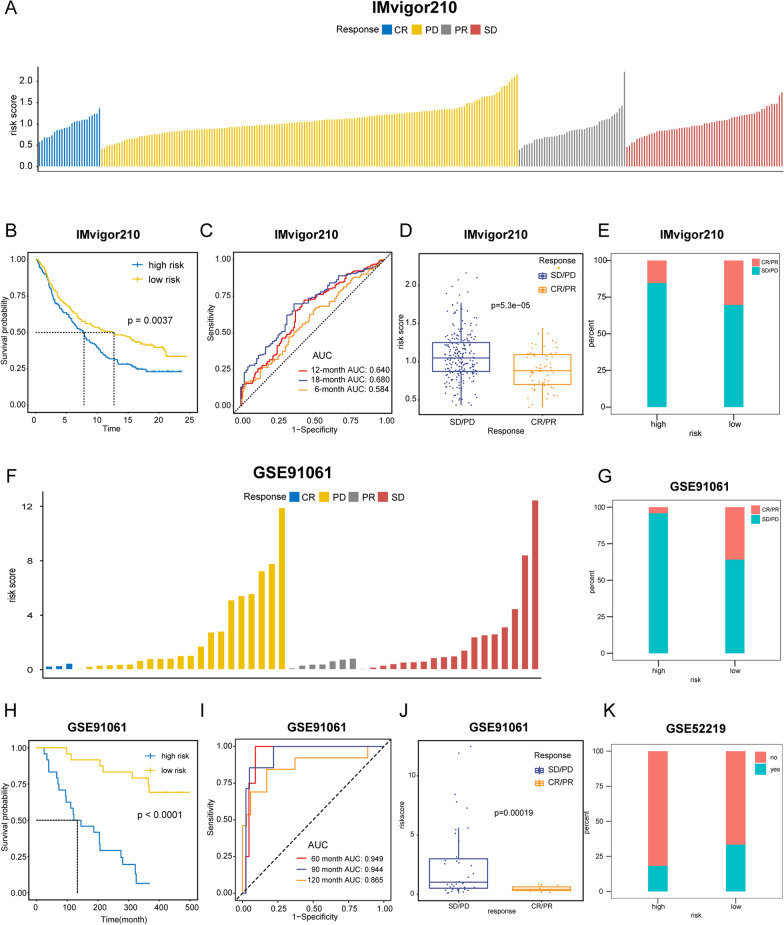
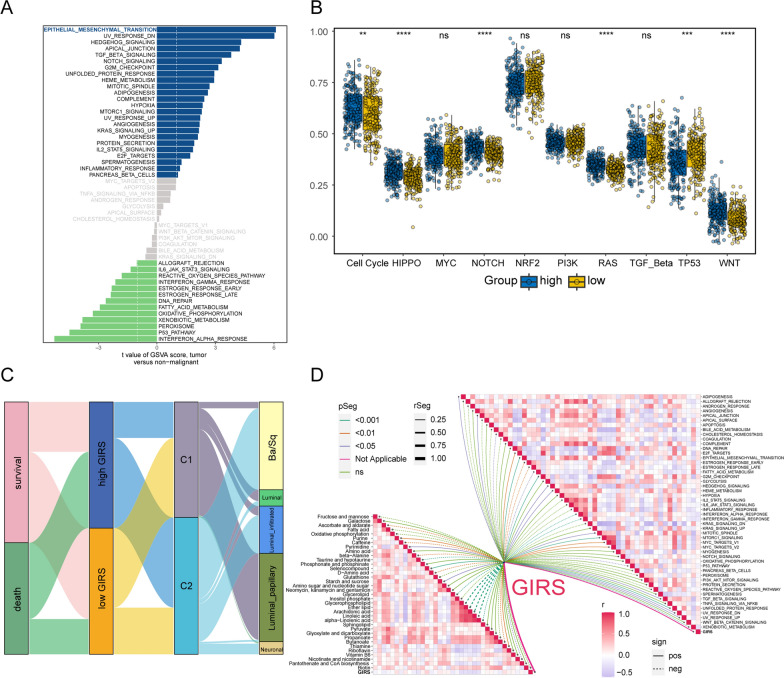
Results: The established clinical prognostic model, GIRS, comprises 13 genes associated with gemcitabine resistance and immunology. This model has demonstrated robust predictive capabilities for survival outcomes across various independent public cohorts. Additionally, the GIRS signature shows significant correlations with responses to both immunotherapy and chemotherapy. Leveraging machine learning algorithms, the hub gene, RAC3, was identified, and potential upstream transcription factors were screened through database analysis. IHC results showed that RAC3 was higher expressed in GEM-resistant BCa patients. Employing molecular docking, the small molecule drug PIK-75, as binding to RAC3, was identified. Experiments on cell lines, organoids and animals validated the biological effects of PIK-75 in bladder cancer.

Conclusions: The GIRS signature offers a valuable complement to the conventional anatomic TNM staging system and molecular subtype stratification in bladder cancer. The hub gene, RAC3, plays a crucial role in BCa and is significantly associated with resistance to gemcitabine. The small molecular drug, PIK-75 having the potential as a therapeutic agent in the context of gemcitabine-resistant and immune-related pathways.

Keywords: Bladder cancer; Machine learning; PIK-75; Prognostic signature; RAC3.


Conflict of interest statement

The authors declare no competing interests.

Figures

Fig. 1
Fig. 1
The workflow of our study
Fig. 2
Fig. 2
Identification of GIRGs and construction of GIRS signature. A A volcano plot was used to visualize the DEGs between GEM-sensitive and GEM-resistant T24 cell lines. B A Venn diagram was adopted to visualize the GIRGs. C The LASSO regression lambda filter. The optimal λ was generated when the partial likelihood of deviance reached the minimum value and the corresponding LASSO coefficients of each GIRG were also obtained. D The forest plot illustrated the Multivariate Cox regression analysis of OS in the TCGA training cohort. E, F GIRS scores among distinct molecular subtypes [Lund1 staging system (E); AJCC TNM staging system (F)] in GSE32894. Statistical comparisons were conducted using the Kruskal–Wallis test
Fig. 3
Fig. 3
Survival analysis between GIRS subgroups and nomogram development in the TCGA-BLCA training cohort. A Kaplan–Meier curve analysis of OS between high and low GIRS subgroups. B Time-dependent ROC analysis of GIRS for predicting OS at 1, 3, and 5 years. C The distribution of GIRS signature, the vital status of patients, and the expression of GIRGs. D Nomogram development. E Time-dependent ROC curves at 1, 3, and 5 years of the nomogram. FH The calibration plots of nomogram for predicting BCa patients with 1, 3, and 5-year OS. The nomogram’s ideal performance is shown by the dashed lines. IK The decision curve analysis of nomogram and other clinical factors for 1, 3, and 5-year risk. The black line represents the hypothesis that no patient died after 1, 3, and 5 years
Fig. 4
Fig. 4
Survival analysis between GIRS subgroups and nomogram validation in the validation cohort GSE32894. A Kaplan–Meier curve analysis of OS between high and low GIRS subgroups. B Time-dependent ROC analysis of GIRS for predicting OS at 1, 3, and 5 years. C The distribution of GIRS signature, the vital status of patients, and the expression of GIRGs. D Nomogram development. E Time-dependent ROC curves at 1, 3, and 5 years of the nomogram. FH The calibration plots of nomogram for predicting BCa patients with 1, 3, and 5-year OS. The nomogram’s ideal performance is shown by the dashed lines. IK The decision curve analysis of nomogram and other clinical factors for 1, 3, and 5-year risk. The black line represents the hypothesis that no patient died after 1, 3, and 5 years
Fig. 5
Fig. 5
Implications of GIRS for immunotherapy and chemotherapy response prediction in three therapeutic cohorts. A Distribution of GIRS for patients exhibiting different immunotherapeutic responses in the IMvigor210. B Kaplan–Meier curve analysis of OS between high and low GIRS subgroups in the IMvigor210. C Time-dependent ROC analysis for predicting OS in the IMvigor210. D GIRS score in the CR/PR group and SD/PD group in IMvigor210. Statistical comparisons were conducted using the t-test (p = 5.3e−05). E Boxplot displayed the GIRS signature in patients with different immunotherapy responses in the IMvigor210. F Distribution of GIRS for patients exhibiting different immunotherapeutic responses in the GSE91061. G Boxplot displayed the GIRS signature in patients with different immunotherapy responses in the GSE91061. H Kaplan–Meier curve analysis of OS between high and low GIRS subgroups in the GSE91061. I Time-dependent ROC analysis for predicting OS in the GSE91061. J GIRS score in the CR/PR group and SD/PD group. Statistical comparisons were conducted using the t-test (p = 0.00019). K Boxplot displayed the GIRS signature in patients with different immunotherapy responses in the GSE52219
Fig. 6
Fig. 6
Enrichment analysis and correlation analysis between GIRS subtypes based on the TCGA cohort. A Difference in pathway activities scored per patient by GSVA between the high and low GIRS subgroups. Shown were t values from a linear model. B Violin plot illustrated the difference in oncopathways between the high and low GIRS subgroups. C Sankey plot visualized the relationships among the C1/C2 clusters, Lund1 subtypes, GIRS, and survival status. D Butterfly plot illustrated the correlation between the GIRS and metabolic pathways, the enrichment pathways based on GSVA of GO and KEGG terms
Fig. 7
Fig. 7
Drug sensitivity analysis in GIRS subgroups (A) Nine drugs that were more sensitive to high GIRS patients. B Six drugs that were more sensitive to low GIRS patients
Fig. 8
Fig. 8
Hub gene identification by 6 machine learning algorithms. A–F 6 machine learning classifier accuracy (Catboost, Random Forest, GDBT, LGBM, Adaboost, and BSXGB). Red lines represent true data and blue lines represent predicted data. G–L Through six machine learning algorithms (Catboost, Random Forest, GDBT, LGBM, Adaboost, and BSXGB), the contribution value of each gene that makes up the signature to the model is calculated and ranked from largest to smallest. SHAP value represents the absolute average of the effect of each gene on the model
Fig. 9
Fig. 9
3D structure of RAC3- PIK-75 complex and RAC3- PF-562271 complex based on molecular docking. A The binding mode of the complex RAC3 with PIK-75. B The amino acid residues to which PIK-75 bonded in the protein pocket. C The binding mode of the complex RAC3 with PF-562271. D The amino acid residues to which PF-562271 bonded in the protein pocket
Fig. 10
Fig. 10
RAC3 was higher expressed in GEM-resistant patients. A Representative images of IHC staining of RAC3 of tumor tissue from gemcitabine-sensitive (GEM-sensitive) or gemcitabine-resistant (GEM-resistant) patients. B Western blot analysis of RAC3 in T24 and 5637 after transfected with shNC or shRAC3. C qPCR analysis of the mRNA levels of RAC3 after transfected with shNC or shRAC3. D IC50 analysis of T24 and 5637 treated by gemcitabine. E Western blot analysis of RAC3 after PIK-75- or DMSO-treated. F qPCR analysis of the mRNA levels of RAC3 after PIK-75- or DMSO-treated
Fig.11
Fig.11
PIK-75 inhibit the growth of BCa in vitro and in vivo. A, B CCK8 assay (A) and colony formation assay (B) of BCa cells. C A wound-healing assay of BCa cells. D The FACS results of Annexin V-PE/7-AAD staining after PIK-75- or DMSO-treated. E, F Morphological changes (E) and 3D cell viability assay (F) of BCa organoids after PIK-75- or DMSO-treated. G Images of the xenograft tumors from MB49 cells subcutaneously injected c57BL/6 mice and tumor growth curves were plotted. The mice were subjected to intraperitoneal administration (i.p.) of PIK-75 or DMSO (as a control) following tumor establishment

References

    1. Babjuk M, Burger M, Capoun O, Cohen D, Compérat EM, Dominguez Escrig JL, Gontero P, Liedberg F, Masson-Lecomte A, Mostafid AH, et al. European association of urology guidelines on non-muscle-invasive bladder cancer (Ta, T1, and carcinoma in situ) Eur Urol. 2022;81:75–94. doi: 10.1016/j.eururo.2021.08.010. - DOI - PubMed
    1. Porta-Pardo E, Godzik A. Mutation drivers of immunological responses to cancer. Cancer Immunol Res. 2016;4:789–798. doi: 10.1158/2326-6066.CIR-15-0233. - DOI - PMC - PubMed
    1. Iasonos A, Schrag D, Raj GV, Panageas KS. How to build and interpret a nomogram for cancer prognosis. J Clin Oncol. 2008;26:1364–1370. doi: 10.1200/JCO.2007.12.9791. - DOI - PubMed
    1. Kerr KF, Brown MD, Zhu K, Janes H. Assessing the clinical impact of risk prediction models with decision curves: guidance for correct interpretation and appropriate use. J Clin Oncol. 2016 doi: 10.1200/JCO.2015.65.5654. - DOI - PMC - PubMed
    1. Zou Y, Xie J, Zheng S, Liu W, Tang Y, Tian W, Deng X, Wu L, Zhang Y, Wong C-W, et al. Leveraging diverse cell-death patterns to predict the prognosis and drug sensitivity of triple-negative breast cancer patients after surgery. Int J Surg. 2022;107:106936. doi: 10.1016/j.ijsu.2022.106936. - DOI - PubMed